SILVER Is Very Bearish! Short!
Take a look at our analysis for SILVER.
Time Frame: 1h
Current Trend: Bearish
Sentiment: Overbought (based on 7-period RSI)
Forecast: Bearish
The market is on a crucial zone of supply 6,339.4.
The above-mentioned technicals clearly indicate the dominance of sellers on the market. I recommend shorting the instrument, aiming at 6,221.8 level.
P.S
We determine oversold/overbought condition with RSI indicator.
When it drops below 30 - the market is considered to be oversold.
When it bounces above 70 - the market is considered to be overbought.
Like and subscribe and comment my ideas if you enjoy them!
Silver

XAGUSD (Silver) – 1-Hour Timeframe Tradertilki AnalysisMy friends, good morning,
I have prepared an XAGUSD-Silver analysis for you on the 1-hour timeframe.
My friends, if XAGUSD-Silver reaches the levels between 60.69393 and 60.11226, I will open a buy position and target the 63.16603 level.
My friends, I share these analyses thanks to each like I receive from you. Your likes increase my motivation and encourage me to support you in this way.🙏✨
Thank you to all my friends who support me with their likes.❤️

SLV: short-term perspective Any local pullback into the rising EMAs (55–53–51 area) could form a higher low, potentially setting up one more leg higher toward the 65–77 mid-term resistance zone.
Chart:
Macro (weekly):

AUDUSD: potential medium-term reversal🛠 Technical Analysis: On the 4-hour timeframe, AUDUSD is forming a classic Head and Shoulders pattern, indicating a potential trend reversal from bullish to bearish. While a "Global bullish signal" remains on the chart, the price action has stalled, creating a defined "Neckline" support at 0.66200. The current accumulation at this support level suggests seller pressure is building. The trade setup relies strictly on a breakout confirmation: a candle close below 0.66200 would validate the pattern and trigger a sell-off towards the next major support zone at 0.64500.
———————————————
❗️ Trade Parameters (SELL)
———————————————
➡️ Entry Point: Sell only on a confirmed breakdown of support (approx. 0.66033 / below 0.66200)
🎯 Take Profit: 0.64523 (Support)
🔴 Stop Loss: Above the Right Shoulder (approx. 0.66786)
⚠️ Disclaimer: This is a potential trade idea based on current chart patterns; do not enter before the support level is broken, as the trend could still hold.

SLV vs. IAU: Why Silver Is Crushing Gold ETFsMarket Performance: The Silver Surge
The iShares Silver Trust (SLV) is significantly outperforming its gold counterpart. Over the past year, SLV delivered a staggering 98.9% return. In contrast, the iShares Gold Trust (IAU) posted a respectable but lower 60.2% gain. Investors focused solely on safety often miss this growth engine. While gold acts as a stable store of value, silver behaves aggressively. This dynamic has resulted in SLV turning a $1,000 investment into $2,532 over five years. Gold generated $2,322 over the same period. The data confirms silver’s dominance in the current bull market.
High-Tech and Science: The Industrial Driver
Silver is not just a currency; it is a critical industrial component. Science dictates this market reality. Silver possesses the highest electrical and thermal conductivity of all metals. Consequently, the high-tech sector drives massive demand. Manufacturers require silver for 5G networks, advanced electronics, and medical devices. Unlike gold, which sits in vaults, industry consumes silver. This consumption creates a fundamental scarcity that drives price appreciation during economic expansions.
Green Tech and Patent Analysis
The global shift toward renewable energy directly benefits SLV. Patent filings for photovoltaic (solar) technologies have surged globally. Silver is the primary conductive element in solar panels. As the world transitions to net-zero emissions, solar demand creates a price floor for silver. Furthermore, electric vehicle (EV) patents increasingly rely on silver for contacts and circuitry. This structural trend ensures that SLV tracks the green energy boom, not just monetary policy.
Geopolitics and Geostrategy: Critical Minerals
Geopolitical tensions are reshaping the precious metals landscape. Nations now view silver as a strategic material rather than just a luxury good. Governments are securing supply chains for critical minerals to ensure technological sovereignty. This geostrategic hoarding reduces global supply elasticity. As major powers decouple their economies, control over silver mining and refining becomes a national security issue. Investors in SLV profit from this heightened competition for physical resources.
Macroeconomics: The Inflation Hedge
Both trusts capitalize on global debt concerns. Sovereign debt levels are rising uncontrollably across major economies. Investors traditionally use precious metals to hedge against currency debasement. However, silver offers a "high beta" play on inflation. When inflation expectations rise, silver typically rises faster than gold due to its smaller market size. Current macroeconomic conditions favor this volatility. The market anticipates continued currency devaluation, fueling inflows into hard assets like SLV.
Business Models and Fund Structure
The iShares business model focuses on accessibility. Both SLV and IAU allow investors to bypass the costs of storing physical bars. However, their cost structures differ. IAU charges a lean 0.25% expense ratio, appealing to cost-conscious holders. SLV charges 0.50%. Investors pay this premium for silver’s explosive growth potential. The fund structure is a grantor trust, meaning it holds physical bullion. This protects investors from counterparty risks associated with futures contracts or derivatives.
Risk Management and Volatility
High returns come with higher risk. SLV carries a beta of 0.18, indicating positive correlation with equity volatility. IAU holds a beta of -0.06, acting as a true diversifier. Consequently, SLV suffered a maximum drawdown of nearly 39% over five years. Gold dropped only 21.8% in the same period. Management of portfolio risk requires understanding this difference. Aggressive traders prefer SLV for its torque; conservative savers choose IAU for stability.
Conclusion: The Strategic Choice
The iShares Silver Trust offers superior leverage to the global industrial recovery. While IAU remains the safer, cheaper hedge, SLV is the growth leader. The combination of green technology demand and monetary debasement creates a perfect storm for silver. Investors willing to tolerate higher fees and deeper drawdowns have reaped larger rewards. As long as the precious metals bull market persists, silver’s dual nature ensures it will continue to outpace gold.

Silver Holds Trend Structure as Buyers Step In🥈 XAG/USD: SILVER BREAKOUT SETUP | DAY/SWING TRADE BLUEPRINT 📊
💎 Asset: XAG/USD (Silver vs. U.S. Dollar) - Metals Market
⏰ Timeframe: Day Trading / Swing Trading
📈 MARKET ANALYSIS
Current Price: $61.89 (Real-time verified December 15, 2025)
Recent High: $64.62 (All-time high recorded this week)
Strategy: BULLISH MOMENTUM CONFIRMED
✅ Hull Moving Average Pullback Strategy Active
✅ Bullish outlook supported by Fed policy
✅ Strong momentum structure intact
✅ Rising industrial demand driving prices higher
🎯 TRADE PLAN
📍 Entry Zone: Buy above Hull MA @ $63.00
Wait for price confirmation above moving average
Strong buyer presence confirms breakout validity
🎯 Target Zone: $66.00
Major resistance confluence area
Overbought conditions likely
Profit-taking zone - scale out recommended
⚠️ Risk Disclaimer:
Ladies & Gentlemen (OG Traders) - Stop Loss and Take Profit levels are YOUR personal decision. Manage YOUR capital, take YOUR profits at YOUR own risk. This is educational analysis, not financial advice.
🔗 CORRELATED PAIRS TO WATCH (IN USD)
1️⃣ OANDA:XAUUSD (Gold) - $2,650-$2,680 range
📌 Correlation: Highly positive (+0.85-0.90)
💡 Gold and Silver move together as precious metals. When Gold pushes higher, Silver typically follows with amplified momentum.
2️⃣ TVC:DXY (U.S. Dollar Index) - Currently @ 98.32-98.53 range
📌 Correlation: Strongly negative (-0.70-0.80)
💡 Dollar declining for three consecutive weeks - weakening Dollar = stronger Silver prices. Watch for DXY breakdown below 98.00 support.
3️⃣ FX:EURUSD (Euro) - $1.05-$1.06 range
📌 Correlation: Positive (+0.60-0.70)
💡 Euro strength = Dollar weakness = Silver rally. Monitor Euro breakouts above 1.0600.
4️⃣ FX:USDJPY (Yen) - 152-156 range
📌 Correlation: Negative (-0.50-0.60)
💡 Yen strength signals risk-off sentiment, benefiting safe-haven metals like Silver.
5️⃣ CSE:GC (Gold Futures) - Watch for directional cues
📌 Correlation: Near-perfect positive (+0.90+)
💡 Gold futures lead Silver movements. Track institutional positioning.
🔑 KEY TECHNICAL POINTS
✔️ Breakout Confirmed: Silver consolidating above $64.00 level after reaching new highs
✔️ Volume Profile: Strong buyer accumulation on pullbacks
✔️ Moving Averages: Hull MA providing dynamic support structure
✔️ RSI: Monitor overbought zones near target - exit signals critical
✔️ Trend Structure: Higher highs, higher lows = bullish continuation pattern
💰 FUNDAMENTAL CATALYSTS
🔹 Silver added to U.S. critical minerals list - increasing strategic importance
🔹 Fed rate policy supporting precious metals environment
🔹 Industrial demand from solar/electronics sectors rising
🔹 Weakening Dollar providing tailwind for commodity prices
⚡ TRADING REMINDERS
✅ Manage position sizing (never risk more than 1-2% per trade)
✅ Watch DXY correlation - Dollar weakness = Silver strength
✅ Set alerts at $63.00 entry and $66.00 target zones
✅ Scale out profits at resistance levels
✅ Trail stops as price advances to lock gains
🚀 Let's Secure These Profits! Drop a 👍 if you're watching this setup!
📌 Follow for more metal market opportunities and professional trading blueprints!
#XAGUSD #Silver #MetalsTrading #TechnicalAnalysis #SwingTrading #DayTrading #ForexTrading #PreciousMetals #TradingSetup #MarketAnalysis
⚠️ FINAL DISCLAIMER: Trading precious metals involves substantial risk. This analysis is for educational purposes only and is not financial advice. Always conduct your own research and trade responsibly according to your risk tolerance.

Silver bullish rebound support at 6288The Silver remains in a bullish trend, with recent price action showing signs of a corrective pullback within the broader uptrend.
Support Zone: 6288 – a key level from previous consolidation. Price is currently testing or approaching this level.
A bullish rebound from 6288 would confirm ongoing upside momentum, with potential targets at:
6500 – initial resistance
6600 – psychological and structural level
6700 – extended resistance on the longer-term chart
Bearish Scenario:
A confirmed break and daily close below 6288 would weaken the bullish outlook and suggest deeper downside risk toward:
6190 – minor support
6110 – stronger support and potential demand zone
Outlook:
Bullish bias remains intact while the Silver holds above 6288. A sustained break below this level could shift momentum to the downside in the short term.
This communication is for informational purposes only and should not be viewed as any form of recommendation as to a particular course of action or as investment advice. It is not intended as an offer or solicitation for the purchase or sale of any financial instrument or as an official confirmation of any transaction. Opinions, estimates and assumptions expressed herein are made as of the date of this communication and are subject to change without notice. This communication has been prepared based upon information, including market prices, data and other information, believed to be reliable; however, Trade Nation does not warrant its completeness or accuracy. All market prices and market data contained in or attached to this communication are indicative and subject to change without notice.

Silver Bear
Traders are trading silver like USD is collapsing tomorrow. 47923481239 bearish divergences on indicators don't matter to these traders they simply buy because of green candles like UNGA DUNGA. That big giant red candle that went straight down last Friday doesn't scare these traders apparently. That bearish divergence on the RSI doesn't scare these traders, apparently silver is just going up forever...

SILVER Set To Grow! BUY!
My dear friends,
SILVER looks like it will make a good move, and here are the details:
The market is trading on 61.986 pivot level.
Bias - Bullish
Technical Indicators: Supper Trend generates a clear long signal while Pivot Point HL is currently determining the overall Bullish trend of the market.
Goal - 62.997
Recommended Stop Loss - 61.372
About Used Indicators:
Pivot points are a great way to identify areas of support and resistance, but they work best when combined with other kinds of technical analysis
Disclosure: I am part of Trade Nation's Influencer program and receive a monthly fee for using their TradingView charts in my analysis.
———————————
WISH YOU ALL LUCK

XAGUSD H1 | Bullish Bounce Off Overlap SupportMomentum: Bullish
Price is currently above the ichimoku cloud.
Buy entry: 61.439
- Overlap support
- 61.8% Fib retracement
- 161.8% Fib extension
Stop Loss: 59.974
- Swing low support
Take Profit: 63.815
- Pullback resistance
High Risk Investment Warning
Stratos Markets Limited (tradu.com/uk ), Stratos Europe Ltd (tradu.com/eu ):
CFDs are complex instruments and come with a high risk of losing money rapidly due to leverage. 70% of retail investor accounts lose money when trading CFDs with this provider. You should consider whether you understand how CFDs work and whether you can afford to take the high risk of losing your money.
Stratos Global LLC (tradu.com/en ): Losses can exceed deposits.
Please be advised that the information presented on TradingView is provided to Tradu (‘Company’, ‘we’) by a third-party provider (‘TFA Global Pte Ltd’). Please be reminded that you are solely responsible for the trading decisions on your account. Any information and/or content is intended entirely for research, educational and informational purposes only and does not constitute investment or consultation advice or investment strategy. The information is not tailored to the investment needs of any specific person and therefore does not involve a consideration of any of the investment objectives, financial situation or needs of any viewer that may receive it. Past performance is not a reliable indicator of future results. Actual results may differ materially from those anticipated in forward-looking or past performance statements. We assume no liability as to the accuracy or completeness of any of the information and/or content provided herein and the Company cannot be held responsible for any omission, mistake nor for any loss or damage including without limitation to any loss of profit which may arise from reliance on any information supplied by TFA Global Pte Ltd.

SILVER Long IdeaWe have a unconfirmed ascending triangle formation at silver. After the daily close on the red lines , formation will be confirmed and we can target easly to the blue area as shown

SILVER BULLISH CONTINUATION|LONG|
✅SILVER compresses into a tightening range above a rising ICT trendline, showing clear bullish market structure and sustained buy-side pressure. Price is coiling below resistance, suggesting smart money accumulation — patience is key while waiting for a clean upside breakout toward higher liquidity. Time Frame 4H.
LONG🚀
✅Like and subscribe to never miss a new idea!✅

Precious metals lead the way: silver, platinum, and palladium!On December 2, FreshForex analysts had already highlighted the high potential of the metals market — and the market quickly confirmed this scenario with a sharp rise in prices: silver (XAGUSD) +12.89%, platinum (XPTUSD) +9.03%, and palladium (XPDUSD) +8.75% . Our metals forecasts not only played out — this segment confidently outperformed many other asset classes. Investors are moving away from the dollar and government bonds into real assets amid expectations of U.S. rate cuts. Prices are also being fueled by news of supply deficits and rising industrial demand for these metals. Against this backdrop, interest in precious metals is growing among both retail and large institutional investors.
Growth Drivers:
Silver (XAGUSD) is rising due to a supply shortage : demand from the solar energy sector and electronics is increasing, while inventories are declining. For investors, silver is also a more affordable alternative to gold .
Palladium (XPDUSD) is supported by limited supply and geopolitical risks : the market depends heavily on Russia and South Africa, while demand for palladium in automotive catalysts and electronics remains strong. As a result, even rumors of sanctions or export restrictions can sharply push prices higher.
Platinum (XPTUSD) is gaining value amid mining disruptions in South Africa , which remains a key global supplier. At the same time, demand from industry and hydrogen-related projects keeps the market tight, meaning any news from the mining sector is quickly reflected in prices.
If a dovish Fed policy and a weak dollar persist, interest in precious metals as a “hedge against currency devaluation” is likely to remain high. Silver receives an additional boost from the “green” agenda — the development of solar energy and electric vehicles, where it is used in virtually every component.
Platinum and palladium continue to depend on a limited number of supplier countries, making any disruptions in mining or logistics powerful price triggers. In this environment, even minor news about production cuts or new restrictions can spark another wave of growth. As long as the market sees a supply deficit and no quick way to significantly increase output, the bullish scenario retains strong potential.
FreshForex analysts note that in the coming months, the performance of silver, platinum, and palladium will largely depend on the Fed’s rate-cut trajectory, the pace of the global “green” transition, and mining-related news from key regions — primarily South Africa and Russia. Investors are advised to maintain strict risk management and closely monitor the macroeconomic calendar.

Silver's Advantage over Gold Might Be Coming to an EndThe gold/silver ratio is now below 68. The balance may have turned too much in favor of silver and is currently testing the -2 standard deviation of the 2020-to-date regression trend. The heightened demand from China, rising energy investments, and opposite reactions to tariff fears are some of the main reasons for the imbalance. Sometimes the ratio goes to extremes but eventually comes back to long-term averages. As 2020 was a game changer in the economy, the 2020-to-date regression line can be accepted as the balance point.
When the rebalancing price action begins, a "buy gold, sell silver" pair trade opportunity might emerge.

Silver Fibonacci Analysis 03/02/2021simply showing the power of Fibonacci
we had seen a Bullish Divergence and Hidden Bullish Divergence on MACD and by the confluences of 4 Fibonacci tools (Retracement, Extension, Projection, Time Zones) in an ascending Chanel...
So we are
Speculating...$$$
A TP Zone Starting from 39.43$ to 41.16$
a Safe and Sure TP can be 39.43$
It is a Swing Trade and it Shall take Few weeks time to develop.
I am expecting the TP to happen at middles of April 2021,
Please thanks Me In the Comments when you enjoyed your 125250 PIPS of Joyful Profits.

BTCUSD: tactical retest🛠 Technical Analysis: On the 4-hour timeframe, Bitcoin (BTCUSD) is attempting to break out of the descending channel toward the 100,000 area. The market is currently in a consolidation phase, preparing for a retest of the resistance zone between $92,000 and $93,000. The chart shows a "local bullish signal," indicating momentum is shifting in favor of buyers. A successful breakout from this zone is expected to allow buyers to test the area near $104,351.
———————————————
❗️ Trade Parameters (BUY)
———————————————
➡️ Entry Point: Buy on retest of the zone $92,000 – $93,000
🎯 Take Profit: $104,351 Resistance)
🔴 Stop Loss: approx. $87,900
⚠️ Disclaimer: This is a potential trade idea based on current technical chart patterns; crypto markets are highly volatile and subject to rapid changes.

SILVER: Still Bullish! Buy The Dip!In this Weekly Market Forecast, we will analyze the XAGUSD (SILVER) for the week of Dec. 15 - 19th.
Silver .... still strong! With a weakened USD due to an interest rate cut by the Fed, there are no headwinds to offer resistance.
Be mindful that this market is overextended, and a pullback is pending.
There is a +FVG to draw price to it below. That would make a great area to look for dip buying opportunities.
Enjoy!
May profits be upon you.
Leave any questions or comments in the comment section.
I appreciate any feedback from my viewers!
Like and/or subscribe if you want more accurate analysis.
Thank you so much!
Disclaimer:
I do not provide personal investment advice and I am not a qualified licensed investment advisor.
All information found here, including any ideas, opinions, views, predictions, forecasts, commentaries, suggestions, expressed or implied herein, are for informational, entertainment or educational purposes only and should not be construed as personal investment advice. While the information provided is believed to be accurate, it may include errors or inaccuracies.
I will not and cannot be held liable for any actions you take as a result of anything you read here.
Conduct your own due diligence, or consult a licensed financial advisor or broker before making any and all investment decisions. Any investments, trades, speculations, or decisions made on the basis of any information found on this channel, expressed or implied herein, are committed at your own risk, financial or otherwise.

$VGZ: The Alpha Goat is Staring at the Ceiling🐐 This chart is screaming "hidden gem." While everyone is chasing the giants, AMEX:VGZ is quietly flexing distinct relative strength against almost the entire market. It’s knocking on the door of a massive breakout, but the door is still locked.
WHAT THE CHART SAYS
The Vibe: Pure compression. We have a solid impulsive move up, followed by a "high and tight" consolidation. It’s coiled like a spring.
The Ceiling (Resistance): That red line is the "No Fly Zone." Price keeps wicking up there and getting rejected. We need a clean break through that roof to start the party.
The Floor (Support): Buyers are stepping in higher and higher. The lows are rising, which tells us the bulls are impatient.
MULTI-FACTOR READ
The technicals are flashing some interesting signals. Momentum is in a "wait and see" mode—not overheating, but definitely awake. Relative Strength is the real star here; this thing is green against nearly every major asset class. However, Sentiment is getting a little "frothy" (too much greed), so don't be shocked if we chop sideways to cool off the hype before the next leg up.
3 SCENARIOS
A) The "Alpha Breakout" (Bullish)
Trigger: We smash through the red ceiling with big energy.
Vibe: Blue skies. No resistance left overhead.
B) The "Chill & Grill" (Neutral)
Trigger: We keep bouncing between the floor and the ceiling.
Vibe: Boring, but healthy. Let the weak hands get bored and leave.
C) The "Fakeout" (Bearish)
Trigger: We lose the recent higher-low structure.
Vibe: The breakout failed. Back to the drawing board.
EDUCATIONAL EXECUTION BLUEPRINT
Breakout Style: Don't guess. Wait for the candle to actually CLOSE above the ceiling. Wicks don't count.
Dip Buyer: If it pulls back to the floor and holds, that's your low-risk entry , if it dosnt hold the trade is invald.
ENGAGEMENT DRIVER Poll:
Is this a "High Tight Flag" ready to fly, or a "Double Top" trap? share in the comments!
EXAMPLES ON OTHER RELEVANT TICKERS:
AMEX:GDX (Gold Miners): The big brother. If this starts running, AMEX:VGZ gets a tailwind.
TVC:DXY (US Dollar): The villain. Gold hates a strong dollar. Watch for rejection.
AMEX:GLD (Gold Spot): The King. Trading near highs and looking strong.
CRYPTOCAP:BTC ?
DISCLAIMER This is educational technical analysis, not financial advice.

LONG OPPORTUNITY LOOMING ON SILVER!Will silver retest 60 before another rally to the upside?
N.B!
- XAGUSD price might not follow the drawn lines . Actual price movements may likely differ from the forecast.
- Let emotions and sentiments work for you
- ALWAYS Use Proper Risk Management In Your Trades
#silver
#xagusd

Silver is in the Bullish directionHello Traders
In This Chart XAGUSD HOURLY Forex Forecast By FOREX PLANET
today XAGUSD analysis 👆
🟢This Chart includes_ (XAGUSD market update)
🟢What is The Next Opportunity on XAGUSD Market
🟢how to Enter to the Valid Entry With Assurance Profit
This CHART is For Trader's that Want to Improve Their Technical Analysis Skills and Their Trading By Understanding How To Analyze The Market Using Multiple Timeframes and Understanding The Bigger Picture on the Charts

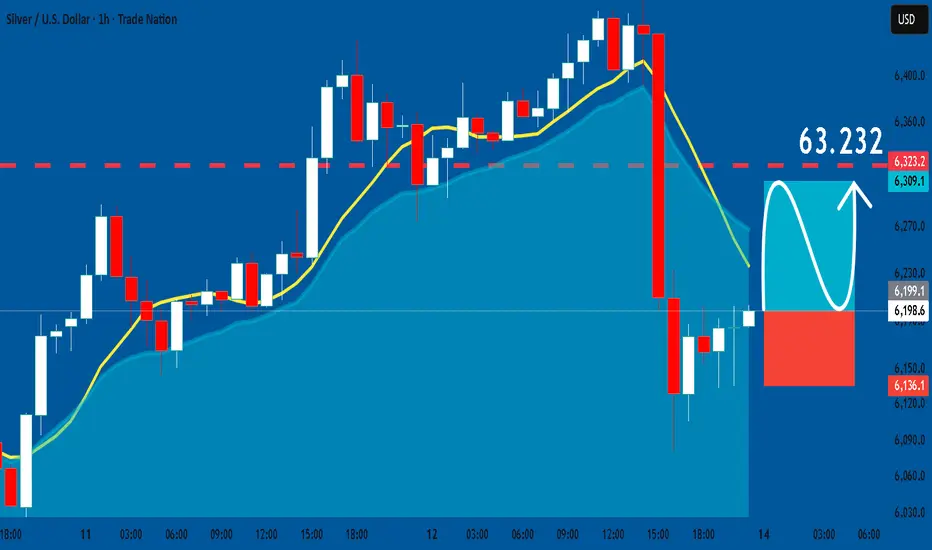
SILVER: Long Trade Explained
SILVER
- Classic bullish setup
- Our team expects bullish continuation
SUGGESTED TRADE:
Swing Trade
Long SILVER
Entry Point - 61.991
Stop Loss - 61.361
Take Profit - 63.232
Our Risk - 1%
Start protection of your profits from lower levels
Disclosure: I am part of Trade Nation's Influencer program and receive a monthly fee for using their TradingView charts in my analysis.
❤️ Please, support our work with like & comment! ❤️
GOLD and SILVER going through similar Breakouts (2) Second post showing silvers breakout pattern from again an ascending triangle on the monthly timeframe
I think silver might make some more movement within the triangle before a bigger break out occurs.
These two charts illustrate the similarities of the breakout pattern

GOLD and SILVER going through similar Breakouts Large ascending triangle patterns are being broken out of on both GOLD and SILVER
This is the pattern for gold and the next chart posted will be the similar one, being silver.
Monthly timeframe breakout
