Gold Bull Market Update and Outlook Q4 2025 / Q1 2026📌 Executive Summary
• Base case (60%): The current pullback is a normal retracement within the primary bull trend. We expect consolidation through late Q4-2025 and potentially into January 2026, followed by a resumption of the uptrend in Q1/Q2-2026.
• Drivers remain intact: Persistent central-bank accumulation, reserve-diversification dynamics, and episodic macro/geopolitical risk keep the structural bid under gold.
• Positioning stance: Maintain core long exposure, add tactically on weakness into the $3.8k–$4.0k zone spot equivalent with tight risk controls, and ladder call spreads into Q2-2026.
• Risk skew: Near-term pullback risk persists position shakeouts, macro data surprises. Structural bearish risks are low unless central-bank demand materially softens.
________________________________________
🧭 Market Context & Recent Price Action
• Gold printed successive record highs into mid-October; front-month futures traded above $4,170/oz before easing. Headlines framed the rally as policy and safe-haven led, with year-to-date gains exceptionally strong.
• Central-bank demand continues to underpin the move: WGC and sell-side coverage highlight accelerating official-sector buying and diversification away from FX reserves; banks forecast higher prices into 2026.
• The current setback aligns with prior bull-market pauses (e.g., Apr–Jul 2025 and Sep 2024–Dec 2024 pullbacks), consistent with the user-stated pattern of multi-month consolidations before trend resumption.
What’s new in headlines late Oct–Nov 2025:
• Pullback is “technical and temporary,” with buy-the-dip framing from UBS; next tactical target cited around $4,200.
• Official-sector flows: Korea & Madagascar exploring reserve increases; PBoC extended buying streak into September.
• WSJ coverage stresses gold’s role in erosion of trust in fiat/central banks and the reserve-diversification theme.
________________________________________
🔑 Structural Bull Case 2025-2026
1. Official-Sector Accumulation:
o Multi-year build in central-bank gold holdings (EM-led) as a sanctions-resilient reserve asset; this remains the single most important marginal buyer narrative.
2. Reserve Diversification & Financial Geopolitics:
o Evidence that gold’s share of global reserves has risen while some institutions reassess currency composition.
3. Macro Volatility & Policy Trajectory:
o Periodic growth scares, policy pivots, and real-rate uncertainty sustain hedging demand. Street targets for late-2026 (e.g., ~$4,900 GS) anchor upside convexity.
4. Market Microstructure:
o Thin above prior highs and crowded shorts on pullbacks can fuel sharp upside re-accelerations when macro catalysts hit data, geopolitics, policy hints.
________________________________________
📊 Technical Map Top-Down
• Primary trend: Up. The sequence of higher highs/higher lows since 2024 remains intact; current move is a trend-within-trend consolidation.
• Pullback anatomy: Prior bull pauses (Apr–Jul 2025; Sep–Dec 2024) lasted 2–4 months, with troughs forming on volatility compression and momentum washouts—a template for now.
• Key tactical zones spot-equiv.:
o $3,800–$4,000: First reload area prior breakout shelf / 50–61.8% of the last leg.
o $4,200–$4,250: First resistance / re-acceleration trigger retests of breakdown pivots.
o $4,350–$4,400: High congestion; decisive weekly close above here re-opens ATH extension.
________________________________________
🗓️ Scenario Pathing Q4-2025 → Q2-2026
• Base Case 60% — “Consolidate then resume”:
o Sideways-to-lower into late Q4/Jan 2026 as positioning resets; range $3.8k–$4.2k.
o Breakout resumption in Q1/Q2-2026 as macro and official flows re-assert.
• Bullish Extension 25% — “Shallow dip, quick reclaim”:
o Softer real yields / risk flare trigger swift recapture of $4.2k–$4.4k and new highs earlier in Q1-2026.
o Catalysts: heavier central-bank prints, geopolitical shock, or earlier policy-easing rhetoric.
• Bear-Risk 15% — “Deeper flush, trend intact”:
o Hawkish macro surprise or forced deleveraging drives $3.6k–$3.7k probes; structure holds unless official-sector demand meaningfully fades
________________________________________
🧪 What to Watch High-Signal Indicators
• Official-Sector Data: Monthly updates from WGC, IMF COFER clues, and PBoC reserve disclosures. Continuation of EM purchases = green light for the bull.
• Rates & Liquidity: Real-rate direction and dollar liquidity conditions around data and policy communications.
• Microstructure: CFTC positioning inflections, ETF out/in-flows a lagging but useful confirmation when they finally turn.
• Asia Physical/Policy: China/Japan retail and wholesale dynamics; policy/tax headlines can create short-term volatility.
________________________________________
🎯 Strategy & Implementation
1) Core:
• Maintain strategic long allocation consistent with mandate e.g., 3–5% risk budget; avoid pro-cyclical reductions during orderly pullbacks.
2) Tactical Adds
• Scale-in buy program within $3.8k–$4.0k
• Optionality: Buy Q2-2026 call spreads (e.g., 4.2/4.8) on dips; fund via selling Q1-2026 downside put spreads around $3.6k–$3.7k where comfortable with assignment.
3) Risk Controls 🛡️:
• Hard-stop any tactical adds on weekly close < ~$3.6k or if credible evidence emerges of official-sector demand reversal.
Silver

Silver (XAGUSD): Possible buy setupSilver (XAGUSD): Possible buy setup. Plan is clear. I think this is SMT and there will be a huge amount of liquidity here. Let's see if I am right.
Cheers

Silver (XAGUSD): Possible buy setup, refinedSilver (XAGUSD): Possible buy setup, refined. Price took more liquidity before going bullish.
Cheers

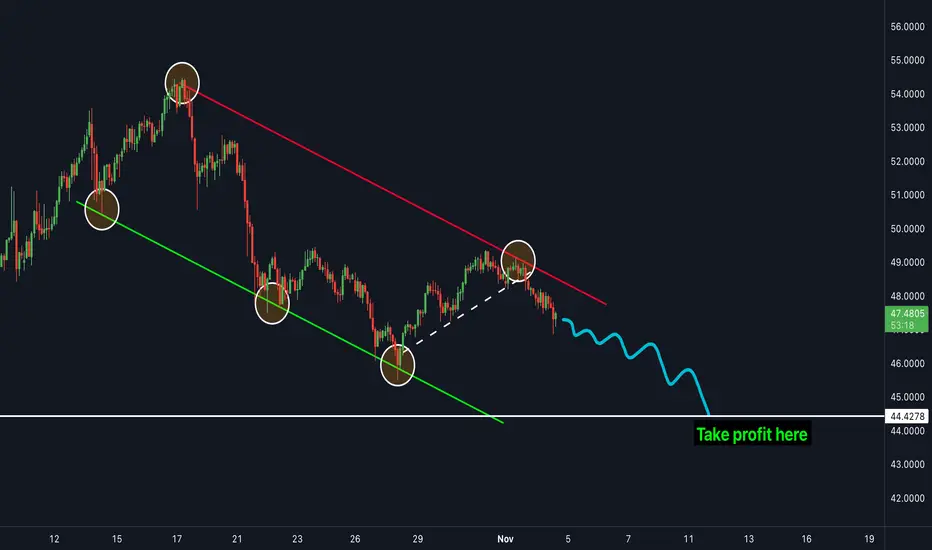
SILVER is ready to drop more - SELL NOW!Silver has been in a clear downtrend for the last few weeks and has struggled to move to the upside. The price is currently in between a bearish channel and is bouncing in-between both resistance and support zones. The price broke the most recent trendline (shown in white) which acted as a support zone. The next target is the white line shown on the chart as "take profit". This is the next major support zone which the price is very likely to hit next.
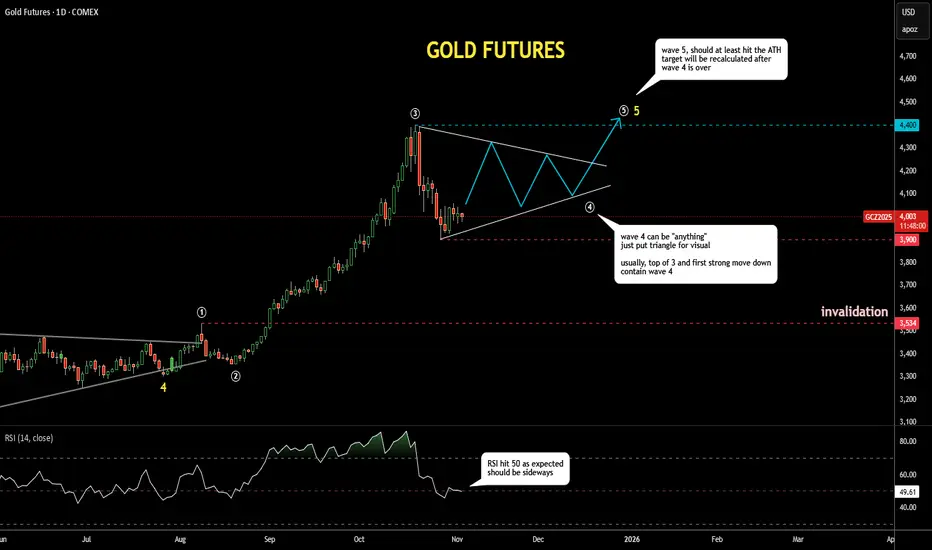
Gold Update 04NOV2025: Wave 4 Dropped Into Target AreaGold futures dropped into the pink-box target area based on the Fibonacci retracement between $3,750 and $4,000.
As expected, the RSI has reached the 50 “waterline”, where it could find some support and start moving around that level.
Many traders lose money in fourth waves, as they can be “anything” and often last longer than one’s pocket. I’ve outlined a triangle shape in wave 4 just for visual context.
The range built through the peak of wave 3 around $4,400 and the bottom of recent panic selling near $3,900 will likely contain most of the volatility in wave 4.
It can take time… testing one’s patience.
SILVER Will Go Higher! Long!
Take a look at our analysis for SILVER.
Time Frame: 1D
Current Trend: Bullish
Sentiment: Oversold (based on 7-period RSI)
Forecast: Bullish
The market is approaching a key horizontal level 4,796.6.
Considering the today's price action, probabilities will be high to see a movement to 5,274.4.
P.S
Overbought describes a period of time where there has been a significant and consistent upward move in price over a period of time without much pullback.
Like and subscribe and comment my ideas if you enjoy them!

XAGUSDXAGUSD price is in a correction phase, there is a possibility that the price will test the support level of 44$. If the price can hold above the level of 43.90, it is expected that the price will have a chance to rebound.
** Very Risky Trade
🔥Trading futures, forex, CFDs and stocks carries a risk of loss.
Please consider carefully whether such trading is suitable for you.
>>GooD Luck 😊
❤️ Like and subscribe to never miss a new idea!

$3800 target for Gold coming soonExpecting Gold to have a minor Drop to $3800. Then Hover back to test $4000 again.
So load up when it drops.
Happy investing all!

Silver sideways consolidation capped at 4980Silver remains in a bullish trend, with recent price action showing signs of a corrective pullback within the broader uptrend.
Support Zone: 4737 – a key level from previous consolidation. Price is currently testing or approaching this level.
A bullish rebound from 4737 would confirm ongoing upside momentum, with potential targets at:
4980 – initial resistance
5066 – psychological and structural level
5166 – extended resistance on the longer-term chart
Bearish Scenario:
A confirmed break and daily close below 4737 would weaken the bullish outlook and suggest deeper downside risk toward:
4667 – minor support
4600 – stronger support and potential demand zone
Outlook:
Bullish bias remains intact while the silver holds above 4737. A sustained break below this level could shift momentum to the downside in the short term.
This communication is for informational purposes only and should not be viewed as any form of recommendation as to a particular course of action or as investment advice. It is not intended as an offer or solicitation for the purchase or sale of any financial instrument or as an official confirmation of any transaction. Opinions, estimates and assumptions expressed herein are made as of the date of this communication and are subject to change without notice. This communication has been prepared based upon information, including market prices, data and other information, believed to be reliable; however, Trade Nation does not warrant its completeness or accuracy. All market prices and market data contained in or attached to this communication are indicative and subject to change without notice.

XAGUSD - Silver BUY CAPITALCOM:SILVER
Previously, Silver had a huge selloff, but on October 28, price on Daily timeframe tapped into 50 EMA, created a doji candle and failed to make LL to support continuing sell bias
Price on 1H, 4H, and Daily timeframe are all trading above EMA50
4H making HH-HL and recently broke above major resistance at 48.6, where bearish momentum appeared to sit at.
After breaking above said resistance, price came up and created a HH, then came down to retest the same resistance thats now reacting as support.
While doing so, price came down and tapped into the 50% Fib area, which was also where the previous HH was at, and price then created a strong bullish candle on 4H rejecting that same level.
Scaling down to 1H we can see the 1H candle that closed above a minor pullback LH structure and is also where the 4H closed at. I consider that 1H candle my entry and targeting either -62% Fib or another major resistance at 52.338 .

02.11 - Silver UP Setup based on H4 order flow. Buy orders has been collected so is possible to price go higher to sell silver for better price. Now is time to wait for price sweep liquidity and give lower time confirmation to buy (m5 order flow). Simple as that.

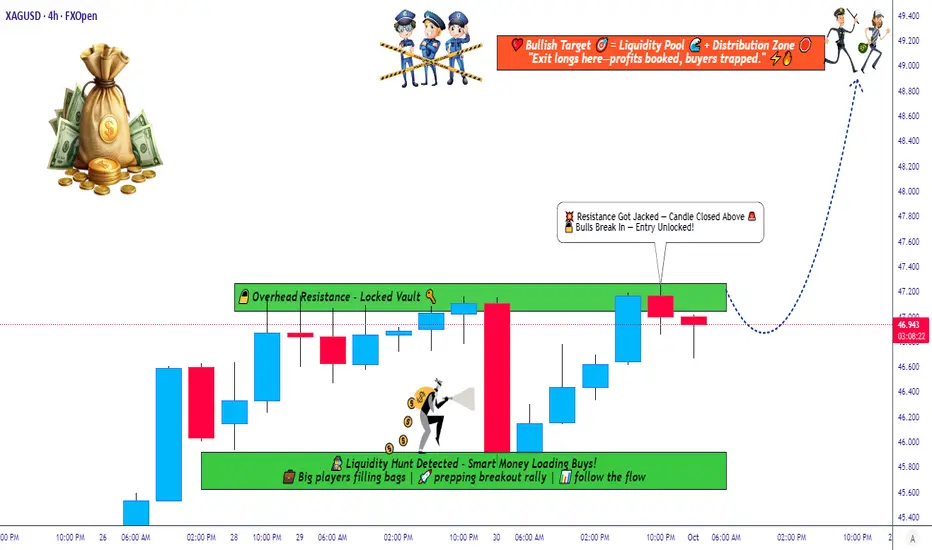
Silver Strategy Map — Thief Layers, Smart Targets, and Risk Zone📊 XAG/USD “Silver vs U.S Dollar” — Metals Market Wealth Strategy Map (Swing/Day Trade)
🔑 Plan: Bullish Setup
This setup follows the “Thief Strategy”, which means using layered limit entries to scale into the trade. Instead of going all-in at one level, we “steal the entries” across multiple layers.
💰 Layered Buy Limit Entries (Example Setup):
46.200
46.400
46.600
46.800
47.000
👉 You can increase layers as per your own plan and risk style.
🛑 Stop Loss (Protective Exit): 45.600
(This is my thief SL — but you’re free to adjust as per your own risk appetite.)
🎯 Target Zone: 49.000
⚠️ Around 49.300, we see a “Police Barricade” (heavy resistance + overbought conditions + potential trap).
That’s where profits should be taken — escape with gains before the trap closes!
Why This Setup?
Support Zones: Strong accumulation zones forming near 45.600–46.000.
Trend Bias: Silver remains bullish in the medium-term metals market outlook.
Layering Strategy Advantage: Reduces entry risk and allows better average fill.
Profit Zone: 49.000 aligns with strong supply area + RSI extension risk.
🔗 Correlation & Related Pairs to Watch
OANDA:XAUUSD (Gold vs USD): Gold often leads Silver’s moves — watch Gold for early signals.
TVC:DXY (US Dollar Index): A weaker USD usually boosts metals.
TVC:PLATINUM & CAPITALCOM:PALLADIUM : Industrial metals correlation — strong moves here can influence Silver sentiment.
TVC:SILVER Futures: Always track COMEX Silver contracts for volume confirmation.
✨ “If you find value in my analysis, a 👍 and 🚀 boost is much appreciated — it helps me share more setups with the community!”
📌 Disclaimer: This is a Thief-style trading strategy, created just for fun and educational sharing. Not financial advice — trade at your own risk.
#XAGUSD #Silver #Metals #TradingStrategy #SwingTrade #DayTrade #ThiefStrategy #Gold #DXY #Forex #Commodities
ADA JESSE LIVERMORE SPECULATIVE ACCUMULATION CYLINDERADA is currently experiencing a Jesse Livermore Accumulation Cylinder described in 1925
Typically this pattern resolves with powerful moves to the upside when presenting in a basing pattern
Other assets that underwent this pattern before explosive moves up are
Palladium
Platinum
Silver
Uranium
MOS
IPI
LEU
LTBR

SILVER My Opinion! SELL!
My dear friends,
Please, find my technical outlook for SILVER below:
The price is coiling around a solid key level - 48.678
Bias - Bearish
Technical Indicators: Pivot Points Low anticipates a potential price reversal.
Super trend shows a clear sell, giving a perfect indicators' convergence.
Goal - 47.933
About Used Indicators:
The pivot point itself is simply the average of the high, low and closing prices from the previous trading day.
Disclosure: I am part of Trade Nation's Influencer program and receive a monthly fee for using their TradingView charts in my analysis.
———————————
WISH YOU ALL LUCK

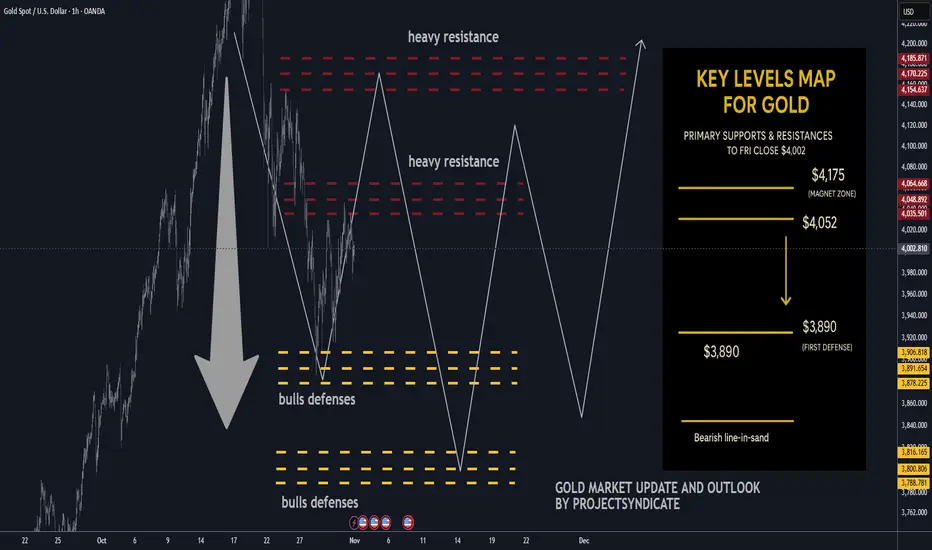
Gold next week: Key S/R Levels and Outlook for Traders🔥 GOLD WEEKLY SNAPSHOT — BY PROJECTSYNDICATE
🏆 High/Close: $4,108 → ~$4,002 — sellers defended overhead; weekly close soft within range.
📈 Trend: Neutral / correction mode still ON; not expecting new highs near term.
🛡 Supports: $3,890 → $3,800 — pivotal shelves for downside containment.
🚧 Resistances: $4,052 / $4,175 — magnet zones for supply / fade attempts.
🧭 Bias next week: Prefer short sells into $4,052–$4,175 with take-profit toward $3,890 → $3,800. Invalidation on sustained reclaim > $4,175; failure of $3,800 risks extension lower.
🌍 Macro tailwinds/headwinds :
• Rates: Real yields stable-to-firm keep upside contained; any dovish surprise could spark squeezes into resistance.
• FX: DXY mixed—lack of broad USD weakness limits impulse follow-through.
• Flows: CB/ETF demand supportive on deep dips but tepid near highs.
• Geopolitics: Event risk provides intermittent bids; not a trend driver this week.
🎯 Street view: Medium-term bullish narratives reserve diversification, policy easing into 2026 remain, but near-term tape favors mean-reversion lower under resistance.
________________________________________
🔝 Key Resistance Zones
• $4,052 — immediate ceiling; prior supply pivot likely to cap first tests
• $4,175 — upper resistance; acceptance above flips tone from corrective to constructive
🛡 Support Zones
• $3,890 — first defense; loss invites momentum probes
• $3,800 — critical structural base; break risks downside acceleration
________________________________________
⚖️ Base Case Scenario
Range-to-soft trade within $3,800–$4,175. Rallies into $4,052–$4,175 are sellable; expect rotations back toward $3,890 with scope to $3,800 if sellers press.
🚀 Breakout Trigger
Only a sustained acceptance > ~$4,175 negates the correction and opens $4,200+ pathing; conversely, firm rejection at $4,052 with a daily close < $3,890 increases odds of a $3,800 test.
💡 Market Drivers
• Fed path & real-yield drift
• USD index swings
• ETF/CB flow tone on dips vs. rips
• Risk sentiment headlines (geopolitics/trade)
🔓 Bull / Bear Trigger Lines
• Bullish above: $4,175 correction phase likely over if held
• Bearish below: $3,890 → risk expands under $3,800
🧭 Strategy
Short-sell from overhead resistances ($4,052 → $4,175).
Scale profits into $3,890 then $3,800; keep stops tight above trigger levels. Stand aside on fresh longs until sustained reclaim above $4,175 reasserts momentum.
SILVER: Long Trading Opportunity
SILVER
- Classic bullish setup
- Our team expects bullish continuation
SUGGESTED TRADE:
Swing Trade
Long SILVER
Entry Point - 48.678
Stop Loss - 48.476
Take Profit - 49.035
Our Risk - 1%
Start protection of your profits from lower levels
Disclosure: I am part of Trade Nation's Influencer program and receive a monthly fee for using their TradingView charts in my analysis.
❤️ Please, support our work with like & comment! ❤️

SILVER 4H - double top before the dropAfter a strong rally, silver retested the 49.0–49.5 area aligning with the key 0.618 Fibonacci level. On the 4H chart, we see a clear double-top pattern with falling volume and oscillator divergence. Price already broke below the short-term trendline and failed to hold above resistance - a classic sign of fading bullish momentum.
Fundamentally, silver faces pressure as the dollar stabilizes and rate-cut expectations fade. Industrial demand from Asia is cooling too, reducing the “safe-haven” appeal.
Tactically, while price stays below 49.5, the path of least resistance is down toward 43.8 and possibly 41.1 - key accumulation zones. A breakout above 50.0 would cancel the bearish setup.
Every silver rally ends the same way - right when everyone starts to believe it’ll never end.

Short in silverAs you can see there is shorting opportunity in silver as well as gold so what is your view on this??????

Silver. XAGUSD Beautiful Elliott wave structureSilver has a textbook elliott wave structure. Wave 3 has hit extension 2,00 — standard region to end wave 3— Now it seems to be working on wave 4. Ideal region to complete this pullback resides between extensions 1,00 and 1,236. Once this 4th wave is completed, Silver will develop wave 5 towards at least extension 2,618

SilverXAGUSD
- Completed " 12345 " Impulsive Waves
- Demand Zone
- Fibonacci Level - 50.00% / 61.80%
- RSI - Divergence
- Bullish Channel as an corrective pattern in Short Time Frame

Silver oversold bounce resistance at 4980The Silver remains in a bullish trend, with recent price action showing signs of a corrective pullback within the broader uptrend.
Support Zone: 4737 – a key level from previous consolidation. Price is currently testing or approaching this level.
A bullish rebound from 4737 would confirm ongoing upside momentum, with potential targets at:
4980 – initial resistance
5066 – psychological and structural level
5166 – extended resistance on the longer-term chart
Bearish Scenario:
A confirmed break and daily close below 4737 would weaken the bullish outlook and suggest deeper downside risk toward:
4667 – minor support
4600 – stronger support and potential demand zone
Outlook:
Bullish bias remains intact while the silver holds above 4737. A sustained break below this level could shift momentum to the downside in the short term.
This communication is for informational purposes only and should not be viewed as any form of recommendation as to a particular course of action or as investment advice. It is not intended as an offer or solicitation for the purchase or sale of any financial instrument or as an official confirmation of any transaction. Opinions, estimates and assumptions expressed herein are made as of the date of this communication and are subject to change without notice. This communication has been prepared based upon information, including market prices, data and other information, believed to be reliable; however, Trade Nation does not warrant its completeness or accuracy. All market prices and market data contained in or attached to this communication are indicative and subject to change without notice.

XAGUSDHello Traders! 👋
What are your thoughts on Silver ?
Silver entered a corrective phase following its recent rally and is now trading below the resistance zone and the broken trendline.
This structure suggests weakening bullish momentum and a potential continuation to the downside once the pullback completes.
We expect price to complete a pullback toward the broken zone and then resume its downward movement toward the identified support levels.
As long as silver remains below the resistance and trendline, the bearish bias stays valid.
A confirmed break and close above resistance would invalidate this scenario.
Don’t forget to like and share your thoughts in the comments! ❤️

Stop!Loss|Market View: AUDUSD🙌 Stop!Loss team welcomes you❗️
In this post, we're going to talk about the near-term outlook for the AUDUSD currency pair☝️
Potential trade setup:
🔔Entry level: 0.65191
💰TP: 0.64101
⛔️SL: 0.65706
"Market View" - a brief analysis of trading instruments, covering the most important aspects of the FOREX market.
👇 In the comments 👇 you can type the trading instrument you'd like to analyze, and we'll talk about it in our next posts.
💬 Description: Sell pressure remains particularly strong on the Austrian and New Zealand dollars, with these two pairs expected to see the most significant strengthening of the USD. Currently, there is an open gap near this year's POC level, and a breakout of this level (near short-term support at 0.65230) will likely trigger a downward impulse amid liquidation by buyers (their stop-loss levels).
Thanks for your support 🚀
Profits for all ✅
❗️ Updates on this idea can be found below 👇
