SILVER My Opinion! SELL!
My dear followers,
I analysed this chart on SILVER and concluded the following:
The market is trading on 58.349 pivot level.
Bias - Bearish
Technical Indicators: Both Super Trend & Pivot HL indicate a highly probable Bearish continuation.
Target - 57.776
Safe Stop Loss - 58.724
About Used Indicators:
A super-trend indicator is plotted on either above or below the closing price to signal a buy or sell. The indicator changes color, based on whether or not you should be buying. If the super-trend indicator moves below the closing price, the indicator turns green, and it signals an entry point or points to buy.
Disclosure: I am part of Trade Nation's Influencer program and receive a monthly fee for using their TradingView charts in my analysis.
———————————
WISH YOU ALL LUCK
Silver

From Silver Shine to Zinc Strength: Hindustan Zinc’s Rally AheadBreakout: Stock has broken out of a descending triangle (bullish signal).
Current Price: ₹498.10
Target Zone: ₹572.10 (upside potential)
Stop-Loss: ₹444.95 (risk level)
Volume: Strong at 36.55M, confirming momentum.
Market Drivers
Silver Rally: Recent gains supported by rising silver prices.
Sector Strength: Outperformed metals sector and Sensex in early December.
Fundamentals
India’s only integrated zinc producer.
Strong reserves with >25 years mine life.
⚠️ Disclaimer
This is educational analysis only, not investment advice. Please consult a SEBI-registered advisor before trading.

XAGUSD H1 | Bearish Reaction Off Pullback ResistanceMomentum: Bearish
Price is currently below the ichimoku cloud.
Sell entry: 57.933
- Strong pullback resistance
- 61.8% Fib retracement
- 100% Fib projection
- Fair Value Gap
Stop Loss: 58.903
- Swing high resistance
Take Profit: 56.729
- Swing low support
High Risk Investment Warning
Stratos Markets Limited (tradu.com/uk ), Stratos Europe Ltd (tradu.com/eu ):
CFDs are complex instruments and come with a high risk of losing money rapidly due to leverage. 70% of retail investor accounts lose money when trading CFDs with this provider. You should consider whether you understand how CFDs work and whether you can afford to take the high risk of losing your money.
Stratos Global LLC (tradu.com/en ): Losses can exceed deposits.
Please be advised that the information presented on TradingView is provided to Tradu (‘Company’, ‘we’) by a third-party provider (‘TFA Global Pte Ltd’). Please be reminded that you are solely responsible for the trading decisions on your account. Any information and/or content is intended entirely for research, educational and informational purposes only and does not constitute investment or consultation advice or investment strategy. The information is not tailored to the investment needs of any specific person and therefore does not involve a consideration of any of the investment objectives, financial situation or needs of any viewer that may receive it. Past performance is not a reliable indicator of future results. Actual results may differ materially from those anticipated in forward-looking or past performance statements. We assume no liability as to the accuracy or completeness of any of the information and/or content provided herein and the Company cannot be held responsible for any omission, mistake nor for any loss or damage including without limitation to any loss of profit which may arise from reliance on any information supplied by TFA Global Pte Ltd.

SILVER (XAGUSD): Consolidation & Trading Plan
Silver keep coiling within a narrow range on a daily.
Depending on the side of its breakout, I expect 2
potential scenarios.
If the market breaks and closes above 59.0 - the resistance
of the range, expect a bullish continuation to 60.0 level.
If the market breaks and closes below 56.2 - the support
of the range, expect a down movement to 54.5
Alternatively, keep trading the market within the range,
buying from the support and selling from the resistance.
❤️Please, support my work with like, thank you!❤️
I am part of Trade Nation's Influencer program and receive a monthly fee for using their TradingView charts in my analysis.

Silver Might Be Accumulating Strength for the Next Leg UpAfter the massive 24% run from the late-November dip, silver is now consolidating between 56.40 and 59. The bullish rally's 41-degree-sloped trend has now broken and is currently being retested. This is not necessarily a bearish signal given the very steep slope and the 24% surge, but if silver manages to break out of the retest and clear the 59 resistance together, there is a chance for another leg higher.
The breakout above 50 was massive because that level has acted as resistance since the 1980s, and every time silver approached it in the past, it triggered months-long selloffs. Given that this is a historically key moment combined with favorable fundamentals, silver still has potential for more upside. However, a retreat below 56.40 could alter the short- to medium-term trajectory.

SilverXAGUSD
- Completed " 12345 " Impulsive Waves and " A " Correction Waves
- RSI - Divergence
- Resistance Level
- Break of Structure
- Fibonacci Level - 100.00% / 121.70%

SILVER REBOUND AHEAD|LONG|
✅ SILVER price is reacting off the anchored demand block, with displacement showing early signs of bullish orderflow returning.
A liquidity sweep beneath intraday lows suggests engineered sell-side delivery before a corrective move higher into the target zone.Time Frame 1H.
LONG🚀
✅Like and subscribe to never miss a new idea!✅

SILVER Free Signal! Buy!
Hello,Traders!
SILVER shows price reacting inside a fresh demand block after a liquidity sweep, signaling potential bullish displacement as long as the demand floor holds.
--------------------
Stop Loss: 5,643$
Take Profit: 5,780$
Entry: 5,700$
Time Frame: 1H
--------------------
Buy!
Comment and subscribe to help us grow!
Check out other forecasts below too!
Disclosure: I am part of Trade Nation's Influencer program and receive a monthly fee for using their TradingView charts in my analysis.

Silver potential drop incoming?Silver came to within whiskers of reaching $59, before easing lower in the last couple of days, and it is now disapplying a potential H&S pattern on the hourly. If the pattern's neckline at 56.45-56.50 area breaks, then we could potentially see a quick drop to the next support which comes in between $53.90 to $54.48. Within this zone, $54.22 is an interesting H1 level to watch for a potential bounce should we get to it.
By Fawad Razaqzada, market analyst with FOREX.com

Silver is in the Bullish directionHello Traders
In This Chart XAGUSD HOURLY Forex Forecast By FOREX PLANET
today XAGUSD analysis 👆
🟢This Chart includes_ (XAGUSD market update)
🟢What is The Next Opportunity on XAGUSD Market
🟢how to Enter to the Valid Entry With Assurance Profit
This CHART is For Trader's that Want to Improve Their Technical Analysis Skills and Their Trading By Understanding How To Analyze The Market Using Multiple Timeframes and Understanding The Bigger Picture on the Charts

Silver sideways consolidation capped at 5875 resistanceThe Silver remains in a bullish trend, with recent price action showing signs of a corrective pullback within the broader uptrend.
Support Zone: 5420 – a key level from previous consolidation. Price is currently testing or approaching this level.
A bullish rebound from 5420 would confirm ongoing upside momentum, with potential targets at:
5875 – initial resistance
6000 – psychological and structural level
6106 – extended resistance on the longer-term chart
Bearish Scenario:
A confirmed break and daily close below 5420 would weaken the bullish outlook and suggest deeper downside risk toward:
5350 – minor support
5275 – stronger support and potential demand zone
Outlook:
Bullish bias remains intact while the Silver holds above 5420. A sustained break below this level could shift momentum to the downside in the short term.
This communication is for informational purposes only and should not be viewed as any form of recommendation as to a particular course of action or as investment advice. It is not intended as an offer or solicitation for the purchase or sale of any financial instrument or as an official confirmation of any transaction. Opinions, estimates and assumptions expressed herein are made as of the date of this communication and are subject to change without notice. This communication has been prepared based upon information, including market prices, data and other information, believed to be reliable; however, Trade Nation does not warrant its completeness or accuracy. All market prices and market data contained in or attached to this communication are indicative and subject to change without notice.

Silver’s 220% Rally: Still Worth Buying Now?Many have recommended investing in silver in recent years. I wasn’t a strong believer, but seeing its 220% growth — even outperforming gold — is impressive. For new investors, silver carries high risk at current levels. In my view, $50 would be a much more attractive entry price

AUDUSD: trendline breakout🛠 Technical Analysis: On the 4-hour timeframe, AUDUSD has broken above a key descending trendline and is currently testing immediate resistance near 0.65595. Although a "Global bearish signal" remains visible from the previous crossover, the recent price action suggests a bullish reversal if buyers can clear this short-term obstacle. The projected trade setup anticipates a confirmed breakout above this level, opening the door for a rapid rally toward the main resistance zone at 0.66200.
🌍 Fundamental Analysis: Volatility is expected to increase towards the end of the week amid Australian GDP data and key US data on Friday and Thursday. Traders are also exercising caution ahead of next week's Fed meeting, but this is more relevant to the medium-term outlook.
❗️ Trade Parameters (BUY) ❗️
➡️ Entry Point: Buy on breakout above short-term resistance (approx. 0.65600 – 0.65650)
🎯 Take Profit: 0.66200 (Major Resistance Zone)
🔴 Stop Loss: Below the recent consolidation (approx. 0.65369)
⚠️ Disclaimer: This is a potential trade idea based on current analysis; market conditions and price direction are subject to change based on news factors and volatility.

Why Silver Is Reaching New High?Why Is Silver Reaching New Highs?”
There are two key reasons for this:
First, it is due to de-dollarization. At this juncture, there are no other currencies ready to take over as the dominant reserve currency. Therefore, the market is turning to precious metals like gold and silver. We can also observe that each time the dollar trends lower, precious metals tend to move in the opposite direction.
Second, why is silver gaining momentum over gold this time? While gold is still trading below its October high, silver has already broken above it with strong momentum.
These are the two questions we will be discussing today.
Mirco Silver Futures
Ticker: SIL
Minimum fluctuation:
0.005 per troy ounce = $5.00
Disclaimer:
• What presented here is not a recommendation, please consult your licensed broker.
• Our mission is to create lateral thinking skills for every investor and trader, knowing when to take a calculated risk with market uncertainty and a bolder risk when opportunity arises.
CME Real-time Market Data help identify trading set-ups in real-time and express my market views. If you have futures in your trading portfolio, you can check out on CME Group data plans available that suit your trading needs www.tradingview.com

Gold — continuing the correctionInitially, we may draw one more small wave up, slightly above 4,350 — but it’s not necessary. Then we will move down into the 3,900 range (slightly lower). After that we’ll see — overall, the outlook points to a deeper correction.

4000 year old money EuphoriaKudos to my good friends that have patiently waited a decade for this ancient money to finally yield great returns. But it's my job here to urge caution and share the lessons of historical finance.
First, let's try to "value" silver historically:
Code of Hammurabi (1750 BC):
Minimum wage for common labor; 8 grains of silver (0.65 g) per day (0.021 oz)
Classical Athens – Periclean period (~450–430 BC):
Unskilled; 1 drachma = ~4.3 g per day (0.138 oz)
Skilled; 1.5–2 drachmae (0.21–0.28 oz)
Roman Republic (Early Empire – Augustus to ~200 AD):
Legionary; 2–2.3 g net per day (0.064–0.074 oz)
Urban unskilled; 3.5 g per day (0.1125 oz)
Roman Empire – Diocletian’s Edict (301 AD):
Farm labor; 0.5-1g per day (0.016-0.032 oz)
Sassanid Persia (~500–600 AD)
1 silver drachm ≈ 4 g per day (0.129 oz)
Medieval England – Statute of Labourers (1351, post-Black Death):
2-3 pence per day; 1 penny = 1.2-1.4g silver (0.077-0.135 oz)
United States – Early Federal period (1790–1800)
Common laborer $0.50–$1.00 per day; U.S. silver dollar = 24.06 g silver (0.39-0.66 oz)
United States – Coinage Act era average wage (1790s–1830s)
Unskilled labor ~$0.75–$1.25 per day (0.58–0.97 oz)
Throughout most of monetary history when silver was actually money, one day of common or semi-skilled labor bought roughly 0.05 to 0.28 troy ounces of silver (with 0.10–0.15 oz being the most common sweet spot in stable empires).
Today (Dec 3, 2025), with silver trading at $57.50/oz, an 8-hour low-skill U.S. wage at $17–$20/hr buys ≈ 2.37–2.78 troy ounces of silver per day — 10–25× higher than almost any pre-1900 historical benchmark.
So one could interpret this historic perspective in two ways:
Silver still has enormous upside to reapproach historical labor norms; An 8-hour U.S. production worker (~$31.50/hr) currently buys ≈ 4.4 troy oz per day — that is 4–7× higher than even the richest silver-standard societies ever paid free citizens, and 200–800× higher than the worst monetary collapses. For today’s wage to buy only the historical average of 0.12 oz/day, silver would need to trade around $2,100/oz.
We no longer pay wages in silver, so the comparison is meaningless; Labor is now paid in fiat, and silver is primarily an industrial/hedge asset. Monetary demand is only a fraction of what it once was, and productivity, technology, and energy inputs have exploded. A direct 1:1 labor peg is never coming back.
Now, let's dive back into the realm of historical analysis that is most relevant.
Much sooner than 4000 years ago (11 actually) silver had a great "yeet" which saw it rise bottom to peak by +493% (the current rise is at 412%). However, the drawdown from the 2011 high was -72%
If we go back half a century ago to 1976-1982 Silver rose +919% only to fall -88%.
The takeaway should not be that the rise in Silver might end here or anywhere. We just don't have enough data but we can infer historical parallels. Volatility is often a gift to investors but in silver, a 4000 year old money, it remains a double edged sword (as it may have been used to buy them back then).
Trade wisely.

SILVER - The ATH Retest Opportunity!!!🚀Silver has officially broken above its all-time high - a major milestone for the metal. But nothing moves in a straight line, and healthy trends always correct before continuing higher.
📉Price is now on its way to retest the previous ATH zone in red, which aligns perfectly with the rising trendline. This creates a powerful confluence area where buyers have historically stepped back in with strength.
⚔️As Silver taps into this intersection, we will be looking for trend-following longs, expecting the bulls to defend the zone and push toward new highs.
🏹The structure is bullish. The trendline is intact. The level is clean.
Now we wait for the reaction… will the bulls reload here? 🤔
⚠️ Disclaimer: This is not financial advice. Always do your own research and manage risk properly.
📚 Stick to your trading plan regarding entries, risk, and management.
Good luck! 🍀
All Strategies Are Good; If Managed Properly!
~Richard Nasr

A case for silver.Silver is currently under significant regulatory constraints, and its prevailing market price does not incentivize the allocation of capital toward ventures focused on increasing its supply. This creates a supply constraint for the asset.
Beyond its role as an inflation hedge, a characteristic shared by most commodities, silver possesses unique properties that are particularly valuable for industrial applications. As we stand on the brink of a new wave of industrial expansion, silver's conductivity and reflectivity make it indispensable in various technologies, such as solar panels (where China leads in production), antifreeze formulations, and numerous other applications.
Recently, President Putin announced that Russia will include silver in its strategic reserves. Meanwhile, China has been engaging in confidential agreements with miners and refiners to secure prices over extended periods. Due to China's relatively loose regulatory framework, these transactions are not publicly disclosed, and as a result, they are not reflected in silver's market price. This can be said for African, Latin-American, or other Asian countries with loose regulation for these kinds of markets. Silver pricing predominantly occurs on the futures market, which underscores cases where a disconnect arises between market prices and underlying realities, leading to potential distortions in valuation.
Case 1: JP Morgan commodities trading desk scandal.
" A federal jury in the Northern District of Illinois convicted a former trader at JPMorgan Chase and Credit Suisse today of fraud in connection with a spoofing scheme in the gold and silver futures markets.
According to court documents and evidence presented at trial, Christopher Jordan, 51, of Mountainside, New Jersey, was an executive director and trader on JPMorgan’s precious metals desk in New York from 2006 to 2009, and on Credit Suisse’s precious metals desk in New York in 2010. Between 2008 and 2010, Jordan placed thousands of spoof orders, i.e., orders that he intended to cancel before execution, to drive prices in a direction more favorable to orders he intended to execute on the opposite side of the market. Jordan engaged in this deceptive spoofing strategy while trading gold and silver futures contracts on the Commodity Exchange (COMEX), which is a commodities exchange operated by the CME Group. These deceptive orders were intended to inject false and misleading information about the genuine supply and demand for gold and silver futures contracts into the markets... Four other former JPMorgan precious metals traders were previously convicted in related cases. In August 2022, Gregg Smith and Michael Nowak... spoofing... In October 2018, John Edmonds pleaded guilty in the District of Connecticut... wire fraud, commodities fraud, price manipulation, and spoofing... In August 2019, Christian Trunz pleaded guilty in the Eastern District of New York to one count of conspiracy to engage in spoofing and one count of spoofing... "
This is the article if you'd like to read more: www.justice.gov
My thoughts; This type of practice is an example of how there always a disconnect with real life and markets. One must also remember how information travels and the infrastructure and systems in place that runs our financial system. I believe JP Morgan's swift settlement shows to me there was not much accountability addressed.
Case 2: Silver Thursday, Hunts Brothers, 1970s
" Nelson Bunker Hunt and William Herbert Hunt — oil company executives, investors and brothers — first began purchasing silver in the early 1970s at a price of less than $2 per ounce. The Hunt brothers’ fervor for silver accelerated dramatically following the death of their father in 1974, a Texas oil tycoon known as H.L. Hunt. His passing released a $5 billion fortune to members of the Hunt family.
Fueled by an enormous amount of capital, the Hunt brothers continued stockpiling silver and purchasing silver futures contracts. By early 1979, the price of silver had risen to about $6 per ounce. The Hunt brothers acquired roughly 195 million ounces of silver, about a third of the world’s total supply. They facilitated their silver purchases in part by investing in futures contracts through several brokers, including Bache Halsey Stuart Shields, Prudential-Bache Securities, and Prudential Securities. By December 1979, the market price for silver fluctuated between $20 and $25 per ounce.
Silver had become exorbitantly expensive even for practical uses. Doctors struggled to afford X-ray film for patients, families melted down their heirloom silver flatware, silver burglaries skyrocketed, and Tiffany’s & Co. was forced to drastically raise its jewelry prices. Tiffany’s even took out a full-page ad in the New York Times criticizing the Hunt brothers, writing, “We think it is unconscionable for anyone to hoard several billion, yes billion, dollars’ worth of silver and thus drive the price up so high that others must pay artificially high prices for articles made of silver.”
Silver reached a record high of $48.70 per ounce on Jan. 18, 1980. By some estimates, the Hunt brothers’ entire silver fortune peaked at a value of $10 billion.
Thursday, March 27, 1980
Facing out-of-control silver prices, COMEX (Commodity Exchange, Inc.), a division of the New York Mercantile Exchange (NYMEX), acted against the Hunt brothers. On Jan. 7, 1980, COMEX introduced Silver Rule 7, which placed heavy restrictions on the purchase of commodities on the margin.
Following its peak price of $48.70 per ounce, silver began its decline and the Hunt family’s silver fortune began to shrink.
On March 27, 1980, known as Silver Thursday, the price of silver dropped 50% in a single day, from $21.62 to $10.80 per ounce. The Hunt brothers failed to meet several margin calls and about $7 billion in paper assets suddenly turned into a $1.7 billion debt.
The sudden price drop threatened to collapse several investment firms and banks. To prevent widespread financial chaos, multiple banks joined together to issue the Hunt brothers a $1.1 billion line of credit..."
The original article: learn.apmex.com
My thoughts: Now you see that one entity can have huge influence on the market. Your once dusty silver mirror can become valuable enough for you to go and find it and clean it and sell it.
One actionable step you can take today is to capitalize on silver's current low valuation. There's clearly a lag between what's happening in the physical market and how that information gets reflected in exchange prices. Interestingly, we've seen noticeable price increases and premiums when buying physical silver, but there hasn’t been much movement in the more liquid instruments like the GLD or SLV ETFs—which, by the way, JPM vaults silver for. This disconnect exists because the market takes time to catch up to reality. What’s your take on this?
More articles:
marketsanity.com
www.justice.gov
www.reuters.com
www.investing.com
seekingalpha.com
investingnews.com
metalsedge.com
www.moneymetals.com

SILVER Will Go Lower From Resistance! Sell!
Please, check our technical outlook for SILVER.
Time Frame: 4h
Current Trend: Bearish
Sentiment: Overbought (based on 7-period RSI)
Forecast: Bearish
The market is testing a major horizontal structure 5,852.3.
Taking into consideration the structure & trend analysis, I believe that the market will reach 5,592.7 level soon.
P.S
Overbought describes a period of time where there has been a significant and consistent upward move in price over a period of time without much pullback.
Like and subscribe and comment my ideas if you enjoy them!

Silver = to the moon??? September 03, 2025Who’s Loading Up:
A top dog at Pan American Silver Corp., a heavyweight in North American silver digs, just scooped up a hefty chunk of shares.
Deal Size: This exec grabbed 50,000 shares at $22.50 a pop on August 28, 2025, dropping $1.125 million—talk about putting skin in the game!
Company Lowdown
Pan American Silver Corp. runs 10 mines across the Americas, packing 468 million ounces of silver and 6.7 million ounces of gold. Based out of Vancouver, they’ve got cash flowing like a river, fueling big bets like La Colorada Skarn and Escobal.
Sector Vibes:
• The Silver Institute’s calling for a fifth straight supply crunch in 2025, with photovoltaics and AI tech demand hitting all-time highs.
• Tariff threats, green energy boom, and a possible Fed rate cut in September 2025 could send silver soaring.
Big Funds Jumping In
Last quarter (June–August 2025), heavy hitters like Sprott Asset Management (+8% in Pan American), BlackRock Inc. (+5% in iShares Silver Trust), and Invesco Ltd. (+6% in VanEck Silver Miners ETF) piled into silver.
Buzz on X says Saudi Central Bank’s dipping its toes into silver via iShares Silver Trust (SLV), ditching its gold-only playbook.
London Vaults Drying Up
The LBMA’s silver stash is under siege from a supply deficit. With 150 million ounces short in 2024, the Silver Institute hints reserves might shrink 5–10% yearly if demand keeps raging, setting the stage for a price explosion.
1979 Boom & 2025–2026 Wild Cards
1979 Flashback: The Hunt Brothers’ silver grab, plus inflation and oil chaos, rocketed silver from $6 to $50/oz (+700%). Gold jumped from $300 to $850/oz on similar vibes.
2025–2026 Triggers:
Inflation’s sticky above 3%, the USD’s wobbling from tariffs, and a Fed cut looms in September 2025. Watch for U.S.-China trade wars, Middle East flare-ups, or a BRICS metals exchange—any could ignite a 1979-style silver rocket if deficits worsen.
Price Targets:
Short-Term (3 months): $60.00 (+46.9%)
Mid-Term (6–12 months): $120.00 (+193.7%)
Long-Term (18–24 months): $240.00 (+487.5%)
🤔🤔🤔🤔🤔🤔🤔🤔

While Gold Stalls, Silver Eyes The 60-Record Silver has broken above a 45-year resistance, turning the 54-barrier into a potential support level moving forward. If silver continues to hold above this multi-decade structure, a new era for the metal could unfold in alignment with triple-digit long-term forecasts supported by the expansion of technology and green-energy industries — including solar panels, electric batteries, and industrial tech use cases.
From a weekly perspective, silver’s price action is aligned with the upper bound of a duplicated up-trending channel respected between August 2022 and September 2025. The 60 zone remains a key psychological resistance level — and a potential retracement trigger. Beyond that, Fibonacci extension measurements from the July 2025 low and the October 2025 high-and-low sequence outline the next upside zones near 64 and 69.
On the downside, if a reversal emerges below the daily low of 56.20 and the previous 2025 record at 54.30, retracement risks may extend toward the mid-zone of the new channel between 51.80 and 50.80. A confirmed hold below this area could pave the way for deeper declines toward 45 and 43.90 — aligning with a historical resistance zone connecting consecutive higher highs between January 2023 and October 2024, before silver possibly resumes its bullish course.
Written by Razan Hilal, CMT

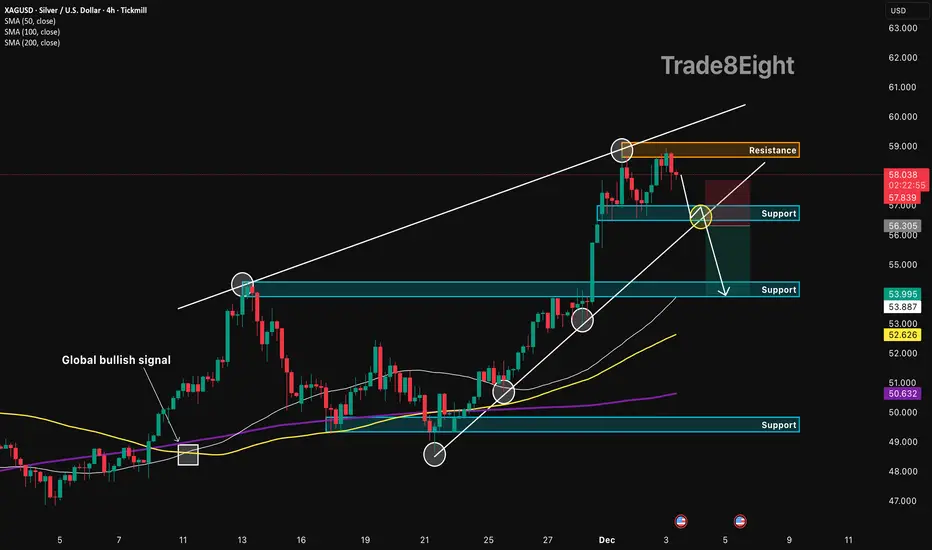
XAGUSD: reversal from resistance🛠 Technical Analysis: On the 4-hour timeframe, silver (XAGUSD) rebounded from the important resistance level of 59.00, signaling a potential bearish reversal. Currently, the price is likely to test the nearest support at 56.30, a confirmed break of which would provide a potential sell entry. The trading setup suggests a correction toward the demand zone at 54.00, which coincides with the support area marked on the chart.
❗️ Trade Parameters (SELL) ❗️
➡️ Entry Point: Sell on breakdown of support (approx. 56.30)
🎯 Take Profit: 53.90 – 54.00 (Support Zone)
🔴 Stop Loss: Above local resistance structure (approx. 57.85)
⚠️ Disclaimer: This is a potential trade idea based on current analysis; market conditions and price direction are subject to change based on news factors and volatility.
XAGUSD: countertrend setup🛠 Technical Analysis: On the 1-hour timeframe, Silver (XAGUSD) is forming a classic "Head and Shoulders" reversal pattern, signaling a potential shift from the recent uptrend to a bearish correction. Price is currently testing the critical neckline support around 56.600; a confirmed breakdown below this level would validate the pattern. The projected trade aims for a decline toward the confluence of the ascending trendline and the 100 SMA near the 54.750 support zone.
🌍 Fundamental Analysis: The metal is facing selling pressure as traders book profits ahead of crucial US economic data due this week, specifically the ISM Services PMI and the Non-Farm Payrolls (NFP). Market sentiment suggests that any signs of resilience in the US labor market could bolster the Dollar and bond yields, thereby weighing on non-interest-bearing assets like Silver. Additionally, year-end portfolio rebalancing in December often triggers volatility and corrective moves in commodities.
❗️ Trade Parameters (SELL) ❗️
➡️ Entry Point: Sell on breakdown of the neckline support (approx. 56.300 – 56.600)
🎯 Take Profit: 54.059
🔴 Stop Loss: Above the right shoulder resistance (approx. 57.903)
⚠️ Disclaimer: This is a potential trade idea based on current analysis; market conditions and price direction are subject to change based on news factors and volatility.
