BRIEFING Week #48 : Monthly Hanging ManHere's your weekly update ! Brought to you each weekend with years of track-record history..
Don't forget to hit the like/follow button if you feel like this post deserves it ;)
That's the best way to support me and help pushing this content to other users.
Kindly,
Phil
Silver

Silver’s Cup & Handle Breakout – Road to $60+ Silver has completed a textbook cup and handle formation and is breaking above the key resistance level at $54. The pattern shows a rounded bottom (cup) formed between $46-$54, followed by a consolidation handle, with price now surging toward new highs at $56.5
Technical Setup:
• Cup depth: Approximately $8 (from $46 low to $54 resistance)
• Breakout level: $54.00
• Price target calculation: $54 + $8 = $62.00+
With momentum like this, the technical target comes in around $62
As long as silver stays above old resistance ($54–$55), bulls are in the driver’s seat.
Risk Management: Consider stops below the handle low around $50 to protect against false breakouts.
This setup aligns with broader precious metals strength and represents a continuation pattern following silver's major 2025 rally.

GOLD (XAU-GC) BUY PLAN📊 Market Sentiment
Market sentiment for GOLD remains strongly bullish. One of the key drivers is the aggressive accumulation by global central banks. Recession concerns and persistent inflation fears continue to position gold as one of the most attractive safe-haven assets.
📈 Technical Analysis
Price has completed the expected accumulation phase and broke out strongly from the accumulation range. This former range has now turned into a clear demand zone. Price has pulled back into this zone again and is currently testing the $4060 level.
📌 Game Plan
The $4060–$3900 zone is my primary buy zone. I will continue accumulating within this range.
My first target is $4250, followed by $4400, which aligns with new all-time-high expectations.
If price closes below $3900 on the daily, this idea becomes invalid. Therefore, my stop is a daily close under $3900.
💬 If this breakdown aligns with your outlook, like and comment below.
For deeper sentiment and strategy insights, subscribe to my Substack free access available.
⚠️ This analysis is for educational purposes only and does not constitute financial advice. Always conduct your own research before trading or investing.

SILVER Massive Short! SELL!
My dear friends,
Please, find my technical outlook for SILVER below:
The price is coiling around a solid key level - 56.402
Bias - Bearish
Technical Indicators: Pivot Points High anticipates a potential price reversal.
Super trend shows a clear sell, giving a perfect indicators' convergence.
Goal - 54.067
About Used Indicators:
The pivot point itself is simply the average of the high, low and closing prices from the previous trading day.
Disclosure: I am part of Trade Nation's Influencer program and receive a monthly fee for using their TradingView charts in my analysis.
———————————
WISH YOU ALL LUCK

Silver is in the Bullish directionHello Traders
In This Chart XAGUSD HOURLY Forex Forecast By FOREX PLANET
today XAGUSD analysis 👆
🟢This Chart includes_ (XAGUSD market update)
🟢What is The Next Opportunity on XAGUSD Market
🟢how to Enter to the Valid Entry With Assurance Profit
This CHART is For Trader's that Want to Improve Their Technical Analysis Skills and Their Trading By Understanding How To Analyze The Market Using Multiple Timeframes and Understanding The Bigger Picture on the Charts

XAGUSD: Bullish Wave 5 Setting a Path Toward 56.000?Hey Realistic Traders!
"Silver Riding Gold’s Momentum, New ATH in the horizon?"
Let’s dive into the technical analysis to answer the question and see what the chart is really telling us.
Technical Analysis
On the daily chart, OANDA:XAGUSD has once again rebounded around the EMA200, with repeated bounces reinforcing the strength of its broader bullish trend. During Wave 4, Silver consolidated within a falling wedge pattern, a corrective formation that typically appears as downside momentum weakens within a larger uptrend. A breakout from this pattern signals renewed bullish pressure and often marks the beginning of Wave 5 in Elliott Wave theory.
Following the breakout, price action supports the case for a developing impulsive Wave 5. The bullish Marubozu candlestick indicates stronger buying interest, while the MACD golden cross adds confirmation to the bullish bias. Together, these signals strengthen the view that momentum is shifting back in favor of the bulls.
Based on Fibonacci projections, Wave 5 may extend toward the 1.0 Fibonacci ratio, aligning with the second upside target near 56.000. Before reaching that level, price may encounter the historical resistance zone around the first target at 54.082, where a temporary pullback could occur.
This bullish wave count remains valid as long as price stays above 49.216. A move below this level would invalidate the potential formation of Wave 5 and shift the outlook back to neutral.
Support the channel by engaging with the content, using the rocket button, and sharing your opinions in the comments below.
Disclaimer: "Please note that this analysis is solely for educational purposes and should not be considered a recommendation to take a long or short position on Silver

SILVER Will Move Higher! Long!
Please, check our technical outlook for SILVER.
Time Frame: 1D
Current Trend: Bullish
Sentiment: Oversold (based on 7-period RSI)
Forecast: Bullish
The market is trading around a solid horizontal structure 5,642.3.
The above observations make me that the market will inevitably achieve 6,175.7 level.
P.S
Overbought describes a period of time where there has been a significant and consistent upward move in price over a period of time without much pullback.
Like and subscribe and comment my ideas if you enjoy them!

Gold or Silver?Right now: SILVER!
I know, I know! Crazy schitt! Don't look at me!
The chart’s telling the story — Silver hasn’t even really started its move yet. Don’t blame me, I’m just reading the data.
Silver is up 87% year-over-year and outperforming gold by 11%, which is still on the low end historically.
That suggests Silver either has room to run from here, or it’s simply the safer relative play versus gold on a risk-adjusted basis.
If you’ve got space in your portfolio, it’s a reasonable addition.
If it hits nose-bleed levels, we reassess.
THANK YOU for getting me to 5,000 followers! 🙏🔥
Let’s keep climbing.
If you enjoy the work:
👉 Drop a solid comment
Let’s push it to 6,000 and keep building a community grounded in truth, not hype.

Perfect Cup and handle Pretty self explanatory here perfect cup and handle on Silver. Very Bullish
Happy Hunting - ND

SILVER: Forecast & Trading Plan
Remember that we can not, and should not impose our will on the market but rather listen to its whims and make profit by following it. And thus shall be done today on the SILVER pair which is likely to be pushed down by the bears so we will sell!
Disclosure: I am part of Trade Nation's Influencer program and receive a monthly fee for using their TradingView charts in my analysis.
❤️ Please, support our work with like & comment! ❤️

SPX/PA - SPX/Palladium ratio flashing a buy$SP:SPX/NYMEX:PA1!
Palladium is looking very good relative to equities currently, currently sitting at a ratio of over 4.50 : 1
I would be expecting to see this normalize around the 2.50-1.5 level, this would imply a significant period of outperformance of palladium relative to the SP500.
This coupled with the continued breakout of Silver and the strong performance of gold, comes together to form a very bullish outlook for palladium.

'Cinderella Gold' Episode 2 — Silver is Not Waiting Anymore 'Cinderella Gold' Episode 2 — Silver is Not Waiting Anymore 👑
Once upon a breakout… 📈
Back in March 2023, I dropped “Cinderella Gold Ready to Shine” — a bold claim that silver would rise from the shadows while the world watched only gold.
Fast forward to today — Silver (XAGUSD) is above $53 , and this chart doesn’t lie.
The forgotten sister of gold is no longer waiting for a dance…
She’s leading the entire ballroom now.
💥 Key Technical Levels
• $50.03 — now confirmed as new support
• $60.58 — next resistance / golden ratio (.618 fib)
• $73.24 — the “New Target” zone
• Ultimate fib expansion? $80+ is not fiction if momentum continues 🔭
This isn’t some one-day wonder. This is the result of 10+ years of structural consolidation breaking wide open.
And if you still think silver is a sidekick, you’re not reading the right story.
🧪 Why Now? The Tech-Silver Symbiosis
Most forget this:
Silver outperforms gold when technology is booming.
Why? Because unlike gold, silver isn’t just money — it’s semiconductors, solar panels, EV batteries, AI chips and the future of industry itself.
• 💻 Tech bull cycle → industrial demand skyrockets
• 🔋 Green energy transition → silver becomes critical infrastructure
• 🛠️ The macro tailwind + physical scarcity = explosive upside
🧠 Food for Thought 🍃
When tech runs hot, silver runs hotter.
It’s the metal that reflects not just fear — but progress.
Gold is the vault.
Silver is the spark.
One Love,
The FXPROFESSOR 💙
⚠️ Disclaimer
Disclaimer: These are my personal thoughts on the market. They are not financial advice. Every trade is your responsibility. Manage your risk and protect your capital.

Silver trend continuation breakout supported at 5213 The Silver remains in a bullish trend, with recent price action showing signs of a corrective pullback within the broader uptrend.
Support Zone: 5213 – a key level from previous consolidation. Price is currently testing or approaching this level.
A bullish rebound from 5213 would confirm ongoing upside momentum, with potential targets at:
5437 – initial resistance
5514 – psychological and structural level
5600 – extended resistance on the longer-term chart
Bearish Scenario:
A confirmed break and daily close below 5213 would weaken the bullish outlook and suggest deeper downside risk toward:
5155 – minor support
5100 – stronger support and potential demand zone
Outlook:
Bullish bias remains intact while the Silver holds above 5213. A sustained break below this level could shift momentum to the downside in the short term.
This communication is for informational purposes only and should not be viewed as any form of recommendation as to a particular course of action or as investment advice. It is not intended as an offer or solicitation for the purchase or sale of any financial instrument or as an official confirmation of any transaction. Opinions, estimates and assumptions expressed herein are made as of the date of this communication and are subject to change without notice. This communication has been prepared based upon information, including market prices, data and other information, believed to be reliable; however, Trade Nation does not warrant its completeness or accuracy. All market prices and market data contained in or attached to this communication are indicative and subject to change without notice.

MarketBreakdown | USDJPY, EURCHF, Dollar Index, Silver XAGUSD
Here are the updates & outlook for multiple instruments in my watch list.
1️⃣ #USDJPY 4H time frame 🇺🇸🇯🇵
USDJPY is trading in a strong uptrend on a daily.
After the market updated the last high, it started a correctional movement.
We see an intraday downtrend now.
I think that the pair found a bottom and is going to rise soon.
Look for a bullish breakout of 156.75 level as your signal.
It will confirm a violation of a bearish trend and a highly probable start of a new bullish wave.
2️⃣ #EURCHF daily time frame 🇪🇺🇨🇭
I see a confirmed bullish change of character and a violation
of a bearish trend.
I think that the market will continue recovering and will grow more soon.
3️⃣ Dollar Index #DXY daily time frame $
The market reached a strong rising trend line and formed
a doji candle on that.
Because the trend is bullish, I will expect a bullish wave.
4️⃣ Silver #XAGUSD daily time frame 🪙
The market is very close to a current all time high.
With the tendency to set higher lows after retracing from that
there is a high chance to see a breakout and a formation of a new higher high soon.
A daily candle close above the levels of the ATH will confirm the violation.
Do you agree with my market breakdown?
❤️Please, support my work with like, thank you!❤️
I am part of Trade Nation's Influencer program and receive a monthly fee for using their TradingView charts in my analysis.

Silver Cup and Handle Pattern: Bullish SetupThis 4-hour chart on silver displays a textbook cup and handle formation.
The cup forms as silver rounds off a previous high and builds a base, signaling accumulation and renewed buying interest. The handle’s consolidation, often a descending channel, typically retraces less than half of the cup’s advance. Breakout confirmation comes when price closes above the handle’s downward resistance line
Statistically, the measured move upon breakout is often the depth of the cup added to the breakout level, indicating strong upside potential if the pattern completes successfully.
A conservative target is $54 - $57.
A silver rally can reflect broad risk-on sentiment. Historically, decisive moves in precious metals have sometimes coincided with bullish developments in the crypto market, triggered by macro events like Federal Reserve rate cuts or rising monetary inflation.

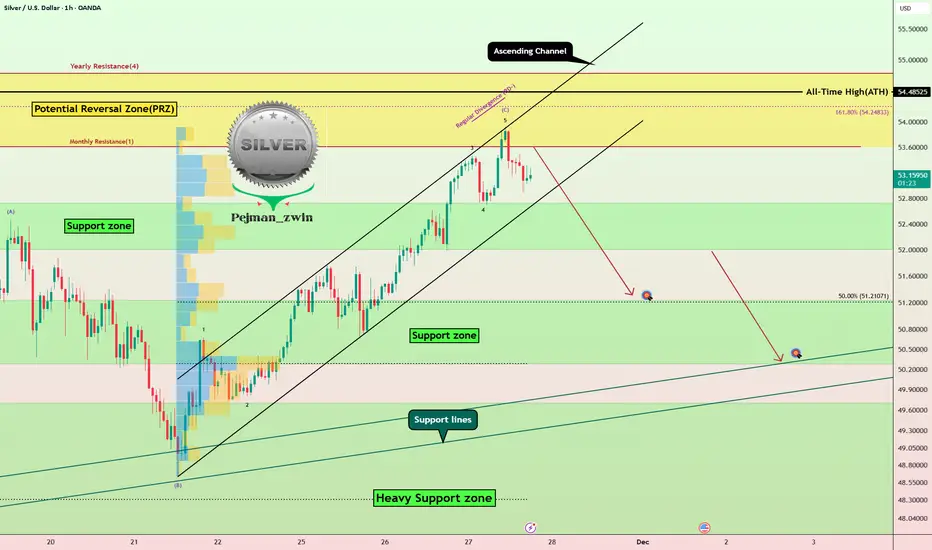
Silver Warning: RD- + PRZ = Short Opportunity?Today, we're diving into Silver ( OANDA:XAGUSD ), and it seems that there’s a potential short opportunity on the horizon.
Currently, silver is approaching a Potential Reversal Zone(PRZ) and an ascending channel.
From an Elliott Wave perspective, it appears that silver has completed wave C of an Expanding Flat Pattern(3-3-5/ABC).
Additionally, we’re noticing a Regular bearish Divergence (RD-) between the price peaks, which adds to the bearish sentiment.
I expect that, following a break below the lower line of the ascending channel, silver could also break through its Support zone($52.73-$52.00) and potentially decline to around the $51.33 level.
First Target: $51.33
Second Target: Support lines
Stop Loss(SL): $54.63
💡 Please respect each other's opinions and express agreement or disagreement politely.
📌 Silver/ U.S. Dollar Analyze (XAGUSD), 1-hour time frame.
🛑 Always set a Stop Loss(SL) for every position you open.
✅ This is just my idea; I’d love to see your thoughts too!
🔥 If you find it helpful, please BOOST this post and share it with your friends.
AG | Silver Miners Will Rise | LONGFirst Majestic Silver Corp. engages in the production, development, exploration and acquisition of mineral properties. It owns and operates producing mines in Mexico including the La Encantada Silver Mine, La Parrilla Silver Mine, San Martin Silver Mine, La Guitarra Silver Mine, Del Toro Silver Mine, Santa Elena Silver & Gold Mine, and San Dimas Silver & Gold Mine. The company was founded by Keith Neumeyer on September 26, 1979 and is headquartered in Vancouver, Canada.

SLV | Next Leg Higher Is Here | LONGiShares Silver Trust seeks to reflect generally the performance of the price of silver. The Trust seeks to reflect such performance before payment of the Trust's expenses and liabilities. It is not actively managed. The Trust does not engage in any activities designed to obtain a profit from, or to ameliorate losses caused by, changes in the price of silver.

Silver - Parking capital somewhere 'safe'One of the cleaner chart patterns that I can see, which has been playing out for the last 5 years. Over several years the target zone sits at twice the current value.
ETF's like SLV look appealing with general exposure through miners.
Follow the lines.

XAUUSD: symmetrical triangle breakdown🛠 Technical Analysis: On the 4-hour timeframe, Gold (XAUUSD) is consolidating within a large symmetrical triangle, indicating a massive volatility squeeze. The price is currently testing the upper boundary but shows signs of rejection, with the projected path pointing to a bearish breakout below the ascending support line. A confirmed close below the triangle structure would validate the bearish momentum, targeting the immediate support zone at 3,913 and potentially extending to the medium-term target of 3,700.
🌍 Fundamental Analysis: Market activity is heavily influenced by the upcoming US Thanksgiving holiday (Thursday, Nov 27), leading to thinning liquidity and potential erratic moves. Traders are bracing for the "pre-holiday data dump" this Wednesday, including Initial Jobless Claims and Durable Goods Orders. Strong US economic data could reinforce the Dollar's strength, further pressuring Gold to break downside before the market close.
❗️ Trade Parameters (SELL) ❗️
➡️ Entry Point: Sell on confirmed breakdown of triangle support (approx. 4,140 – 4,150)
🎯 Take Profit: 3,913, medium-term target at 3,700
🔴 Stop Loss: Above the recent resistance structure (approx. 4,255)
⚠️ Disclaimer: This is a potential trade idea based on current analysis; market conditions and price direction are subject to change based on news factors and volatility.

Stop!Loss|Market View: EURUSD🙌 Stop!Loss team welcomes you❗️
In this post, we're going to talk about the near-term outlook for the EURUSD currency pair☝️
Potential trade setup:
🔔Entry level: 1.16465
💰TP: 1.15347
⛔️SL: 1.16985
"Market View" - a brief analysis of trading instruments, covering the most important aspects of the FOREX market.
👇 In the comments 👇 you can type the trading instrument you'd like to analyze, and we'll talk about it in our next posts.
💬 Description: The euro price failed to breakout 1.15000, nor even approach it as we expected at the beginning of the week. Today, we're likely to see further short-term growth toward 1.16600, from where selling could again be considered. However, if we're accumulating a short position over the medium term, we could consider conservative selling from current levels. A more global target near 1.14000 remains.
Thanks for your support 🚀
Profits for all ✅

GOLD/ SILVER RATIO - Quarterly FlagBeautiful looking quarterly flag present on the gold silver ratio, should this break down, which would be likely to play out over the next 12-18 months (at most) then expect much higher silver prices.
I would expect to see the ratio hit between 50-30 should this flag pattern materialize.

XAGUSD H1 | Bullish Bounce Off Key SupportMomentum: Bullish
Price is currently above the ichimoku cloud.
Buy entry: 50,608
- Strong pullback support
- 50% Fib retracement
- 100% Fib projection
- Fair Value Gap
Stop Loss: 49.634
- Swing low support
Take Profit: 51.631
- Multi-swing high resistance
High Risk Investment Warning
Stratos Markets Limited (tradu.com/uk ), Stratos Europe Ltd (tradu.com/eu ):
CFDs are complex instruments and come with a high risk of losing money rapidly due to leverage. 70% of retail investor accounts lose money when trading CFDs with this provider. You should consider whether you understand how CFDs work and whether you can afford to take the high risk of losing your money.
Stratos Global LLC (tradu.com/en ): Losses can exceed deposits.
Please be advised that the information presented on TradingView is provided to Tradu (‘Company’, ‘we’) by a third-party provider (‘TFA Global Pte Ltd’). Please be reminded that you are solely responsible for the trading decisions on your account. Any information and/or content is intended entirely for research, educational and informational purposes only and does not constitute investment or consultation advice or investment strategy. The information is not tailored to the investment needs of any specific person and therefore does not involve a consideration of any of the investment objectives, financial situation or needs of any viewer that may receive it. Past performance is not a reliable indicator of future results. Actual results may differ materially from those anticipated in forward-looking or past performance statements. We assume no liability as to the accuracy or completeness of any of the information and/or content provided herein and the Company cannot be held responsible for any omission, mistake nor for any loss or damage including without limitation to any loss of profit which may arise from reliance on any information supplied by TFA Global Pte Ltd.
