USDCAD: Massive Pullback Incoming or Final Trap?USDCAD is reacting from a major demand area at 1.3720–1.3770, which aligns with:
• the lower boundary of the yearly ascending channel;
• an institutional zone that has been defended multiple times (Q3 and early Q4);
• a daily RSI showing relative oversold conditions;
• a liquidity cluster below the October lows that has now been swept.
The rebound is technically justified, but its sustainability will largely depend on CAD structure (strong in the latest COT data) and on December seasonality, which is historically unfavorable for USDCAD.
The base case is a bullish pullback toward 1.3890–1.3930, followed by renewed downside pressure if macro sentiment continues to support the CAD.
The daily chart highlights:
• Primary trend: still bullish, but undergoing a deep corrective phase.
• Midline channel break → bearish acceleration into the demand area.
• Current price action: sharp rejection with increased relative volume at the lows (typical structural “spring”).
• The 1.3880–1.3930 zone is the first major supply: confluence between previous structure, the last breakdown area, and a psychological pre-pivot region.
Key technical levels:
Support: 1.3720 (demand), 1.3660 (extreme), 1.3570 (macro support).
Resistance: 1.3880, 1.3930, 1.4050.
Technical outlook:
As long as the price remains above 1.3720, the market favors a corrective rebound.
Below 1.3660, price opens the path toward 1.3570.
Seasonality – December
December is historically a bearish month for USDCAD, with negative readings across 20-, 15-, 10-, and 5-year datasets:
• 20-year avg: -0.0014
• 10-year avg: -0.0091
• 5-year avg: -0.0195 (significantly negative)
• Only the 2-year pattern shows a more neutral/volatile structure.
Seasonality takeaway: bearish bias, suggesting the current rebound is more likely a technical pullback rather than the start of a new trend.
COT Analysis (CAD + USD Index)
CAD – COT data (Nov 4, 2025)
• Non-Commercials increased CAD shorts aggressively (+8,288) while reducing longs (-1,180).
→ Indicates speculative CAD weakness in recent weeks.
• Commercials significantly increased CAD longs (+13,164).
→ Typical of institutions accumulating CAD at discounted prices.
Interpretation:
CAD displays a clear divergence: speculators are bearish, while commercials are increasingly bullish. This suggests a potential macro turning point where institutions anticipate medium-term CAD strength.
USD Index – COT data (Nov 4, 2025)
• Non-Commercials increased both longs (+6,038) and shorts (+5,474).
→ Polarized market.
• Commercials increased longs (+1,188).
→ Marginal support for the USD.
Macro COT conclusion:
• CAD: institutional buying pressure.
• USD: indecision and polarization.
Overall COT bias → medium-term bearish USDCAD, although consistent with a short-term corrective bounce.
Retail Sentiment
• Short: 37%
• Long: 63%
Retail positioning is clearly long.
Contrarian interpretation: downside risk remains elevated after the pullback.
Macro Context
• Oil remains volatile but structurally firm → historically CAD-supportive.
• The Fed maintains a cautious stance with potential rate cuts in 2026 → structural pressure on the USD.
• The BoC, although dovish, may delay cuts relative to the Fed → supportive for CAD in the medium term.
Probability 60% – Base Scenario
Pullback toward 1.3880–1.3930 before renewed bearish pressure.
Confirmations:
• Daily close above 1.3820
• Bullish H4 structural shift
Target: 1.3890
Extension: 1.3930
Failure level: below 1.3720.
Alternative Bearish Scenario – Probability 40%
A direct break below 1.3720 → continuation toward 1.3660 and then 1.3570 (macro level).
Confirmations:
• Pullback failure / squeeze
• H4 bullish breakout in oil
• Daily rejection on the USD Index.
USDCAD is currently rebounding within a broader corrective structure.
COT and seasonality do not support a strong bullish reversal, but short-term price action allows room for a move toward 1.39, where institutional interest will likely re-emerge to resume the broader macro bearish narrative.
Barring macro shocks, the preferred structure remains:
corrective rally → short setup at 1.3880–1.3930 → target 1.3720 and potentially 1.3660.
Smartmoney

AUDNZD: Forecast & Technical Analysis
The analysis of the AUDNZD chart clearly shows us that the pair is finally about to go up due to the rising pressure from the buyers.
❤️ Please, support our work with like & comment! ❤️

EURGBP: Short Signal Explained
EURGBP
- Classic bearish formation
- Our team expects fall
SUGGESTED TRADE:
Swing Trade
Sell EURGBP
Entry Level - 0.8750
Sl - 0.8754
Tp - 0.8744
Our Risk - 1%
Start protection of your profits from lower levels
Disclosure: I am part of Trade Nation's Influencer program and receive a monthly fee for using their TradingView charts in my analysis.
❤️ Please, support our work with like & comment! ❤️

GBPCHF: Market of Buyers
Looking at the chart of GBPCHF right now we are seeing some interesting price action on the lower timeframes. Thus a local move up seems to be quite likely.
Disclosure: I am part of Trade Nation's Influencer program and receive a monthly fee for using their TradingView charts in my analysis.
❤️ Please, support our work with like & comment! ❤️

GOLD: Short Trade with Entry/SL/TP
GOLD
- Classic bearish formation
- Our team expects pullback
SUGGESTED TRADE:
Swing Trade
Short GOLD
Entry - 4218.4
Sl - 4224.0
Tp - 4207.6
Our Risk - 1%
Start protection of your profits from lower levels
Disclosure: I am part of Trade Nation's Influencer program and receive a monthly fee for using their TradingView charts in my analysis.
❤️ Please, support our work with like & comment! ❤️

EURJPY: Bearish Continuation is Highly Probable! Here is Why:
Our strategy, polished by years of trial and error has helped us identify what seems to be a great trading opportunity and we are here to share it with you as the time is ripe for us to sell EURJPY.
Disclosure: I am part of Trade Nation's Influencer program and receive a monthly fee for using their TradingView charts in my analysis.
❤️ Please, support our work with like & comment! ❤️

EURAUD: Bearish Continuation & Short Signal
EURAUD
- Classic bearish pattern
- Our team expects retracement
SUGGESTED TRADE:
Swing Trade
Sell EURAUD
Entry - 1.7550
Stop - 1.7566
Take - 1.7523
Our Risk - 1%
Start protection of your profits from lower levels
Disclosure: I am part of Trade Nation's Influencer program and receive a monthly fee for using their TradingView charts in my analysis.
❤️ Please, support our work with like & comment! ❤️

GBP/USD: Institutions Accumulate, USD Weakens – Key PullbackMacro Context and USD Index (DXY) – Neutral/Weak USD Bias
The COT report on the Dollar Index shows a configuration that suggests sustained bearish pressure on the USD:
Non-commercial traders are adding both long positions (+6,038) and short positions (+5,474), but the overall structure remains clearly short-dominant (32,207 shorts vs. 16,645 longs).
Commercials significantly increase their USD long exposure (+1,188), though their activity typically reflects hedging rather than a directional view.
Open interest rises sharply, signaling renewed institutional participation on the sell side of USD.
In summary, net pressure remains bearish on the USD, a condition that favors upside continuation in GBP/USD.
COT on the British Pound (GBP) – Clear Improvement in Institutional Sentiment
The GBP report is far more revealing:
Non-commercials aggressively cut long exposure (–19,354) while sharply increasing shorts (+15,403).
However, commercials substantially increase their GBP long exposure (+40,231) while reducing short exposure (+504).
This dynamic is typical of market turning points:
When non-commercials rapidly reduce longs and add shorts, it often represents short-term emotional selling.
Commercials, meanwhile, accumulate heavily, suggesting that current price levels are perceived as attractive value zones.
Interpretation:
GBP is likely entering a structural accumulation phase.
Combined with USD weakness → this supports a moderately bullish medium-term bias on GBP/USD.
Retail Sentiment – Contrarian Confirmation of Potential Upside
Retail short: 56%
Retail long: 44%
Retail positioning is predominantly short → classic contrarian signal → reinforces a bullish scenario for GBP/USD.
Seasonality – December Historically Bullish
December typically shows positive seasonal behavior, especially across the 5-year and 2-year curves.
The 10-year curve is slightly bullish as well; only the 20-year curve is mostly neutral.
Interpretation: December tends to favor accumulation and upward extensions, particularly in the second half of the month.
Price Action & Key Levels
Price recently bounced from the ascending channel highlighted in green.
A strong bullish impulse candle broke previous micro-structure, and the pair is now undergoing a technical pullback.
The blue zone (1.3160–1.3230) represents the major daily demand area that initiated the latest rally.
Primary Scenario (Bullish – Higher Probability):
A retracement toward 1.3240–1.3260 is expected, aligning with a retest of the ascending trendline.
From this region, a bullish continuation toward:
• 1.3420 (first supply zone)
• 1.3550 (intermediate liquidity pocket)
• 1.3600–1.3650 (macro supply and seasonal target)
The daily RSI remains neutral, with no signs of exhaustion, leaving ample room for further upside.

EURCHF: Forecast & Trading Plan
Remember that we can not, and should not impose our will on the market but rather listen to its whims and make profit by following it. And thus shall be done today on the EURCHF pair which is likely to be pushed up by the bulls so we will buy!
Disclosure: I am part of Trade Nation's Influencer program and receive a monthly fee for using their TradingView charts in my analysis.
❤️ Please, support our work with like & comment! ❤️

EURUSD: Short Trading Opportunity
EURUSD
- Classic bearish setup
- Our team expects bearish continuation
SUGGESTED TRADE:
Swing Trade
Short EURUSD
Entry Point - 1.1637
Stop Loss - 1.1643
Take Profit - 1.1629
Our Risk - 1%
Start protection of your profits from lower levels
Disclosure: I am part of Trade Nation's Influencer program and receive a monthly fee for using their TradingView charts in my analysis.
❤️ Please, support our work with like & comment! ❤️

EURCHF 1D EURCHF shows a clean technical structure that rarely deceives a focused trader. After a strong impulse price reacted precisely at the 0.786 Fibonacci level at 0.93884 confirming strong demand near the upper boundary of the range. The current setup suggests a pullback toward the 0.5 Fibonacci level at 0.93123 which forms the optimal continuation zone. As long as price maintains this area the trend remains bullish and limits the risk of a deeper correction. Once the market stabilises above the Fibonacci cluster the first target stands at 0.94419. The second target at 0.96107 reflects the natural extension of the current impulse. Volume supports buyers and creates favourable conditions for a sustained move higher. The logic here is simple the market pauses only to regain strength for the next leg.

GBPNZD: Bullish Forecast & Bullish Scenario
Balance of buyers and sellers on the GBPNZD pair, that is best felt when all the timeframes are analyzed properly is shifting in favor of the buyers, therefore is it only natural that we go long on the pair.
Disclosure: I am part of Trade Nation's Influencer program and receive a monthly fee for using their TradingView charts in my analysis.
❤️ Please, support our work with like & comment! ❤️

CHFJPY: Market Sentiment & Forecast
The recent price action on the CHFJPY pair was keeping me on the fence, however, my bias is slowly but surely changing into the bearish one and I think we will see the price go down.
Disclosure: I am part of Trade Nation's Influencer program and receive a monthly fee for using their TradingView charts in my analysis.
❤️ Please, support our work with like & comment! ❤️

GOLD: Short Trading Opportunity
GOLD
- Classic bearish formation
- Our team expects fall
SUGGESTED TRADE:
Swing Trade
Sell GOLD
Entry Level - 4203.5
Sl - 4211.4
Tp - 4191.2
Our Risk - 1%
Start protection of your profits from lower levels
Disclosure: I am part of Trade Nation's Influencer program and receive a monthly fee for using their TradingView charts in my analysis.
❤️ Please, support our work with like & comment! ❤️

USDCHF: Bears Will Push Lower
It is essential that we apply multitimeframe technical analysis and there is no better example of why that is the case than the current USDCHF chart which, if analyzed properly, clearly points in the downward direction.
Disclosure: I am part of Trade Nation's Influencer program and receive a monthly fee for using their TradingView charts in my analysis.
❤️ Please, support our work with like & comment! ❤️

NZDCAD: Long Signal with Entry/SL/TP
NZDCAD
- Classic bullish formation
- Our team expects pullback
SUGGESTED TRADE:
Swing Trade
Long NZDCAD
Entry - 0.7976
Sl - 0.7963
Tp - 0.8000
Our Risk - 1%
Start protection of your profits from lower levels
Disclosure: I am part of Trade Nation's Influencer program and receive a monthly fee for using their TradingView charts in my analysis.
❤️ Please, support our work with like & comment! ❤️

AUDCAD: Bullish Continuation is Expected! Here is Why:
Balance of buyers and sellers on the AUDCAD pair, that is best felt when all the timeframes are analyzed properly is shifting in favor of the buyers, therefore is it only natural that we go long on the pair.
Disclosure: I am part of Trade Nation's Influencer program and receive a monthly fee for using their TradingView charts in my analysis.
❤️ Please, support our work with like & comment! ❤️

USDJPY: Short Trade Explained
USDJPY
- Classic bearish formation
- Our team expects pullback
SUGGESTED TRADE:
Swing Trade
Short USDJPY
Entry - 155.39
Sl - 155.54
Tp - 155.15
Our Risk - 1%
Start protection of your profits from lower levels
Disclosure: I am part of Trade Nation's Influencer program and receive a monthly fee for using their TradingView charts in my analysis.
❤️ Please, support our work with like & comment! ❤️

EUR/USD Is Walking Into a Trap: Liquidity Sweep is coming!Price Action & Structure
The current structure shows a corrective rally unfolding within an ascending channel (green dashed lines).
Price action is printing higher highs without fresh momentum, a typical sign of “distribution during a pullback.”
The market is now trading in the upper half of the channel, approaching a daily premium zone just below 1.1700–1.1750.
Daily RSI sits around 60–65, which aligns with an extended pullback, not the beginning of a true bullish trend.
COT Analysis
EUR Futures (CME)
Large speculators are increasing shorts more aggressively than longs → bearish reading on the euro.
Commercials
Commercial traders are adding longs while reducing shorts.
→ This is classic hedging behavior during extended bullish corrections.
USD Index COT
Non-Commercial:
Positioning shows speculators are covering USD longs, but not turning bullish on the euro.
This suggests a temporary squeeze, not a structural trend reversal.
Retail Sentiment
70% SHORT EUR/USD
30% LONG
Retail traders are heavily short and consistently squeezed during upside moves.
This is a classic setup for a fake bullish rally into premium zones, after which larger players typically reverse price.
EUR/USD Seasonality (December)
December is statistically bullish, with average performance between +0.8% and +1.4%.
Seasonal curves show a rise into mid/late December, followed by:
→ a pullback near month-end
→ a bearish setup after January 3rd (typical early-year USD strength)
Thus, the current rally aligns perfectly with seasonality:
December rally → distribution → January drop.
Conclusion
EUR/USD is completing a structural bullish pullback, not forming a new bullish trend.
The move toward 1.1700–1.1750 looks like:
✔️ a liquidity grab
✔️ seasonal pump
✔️ exhaustion before reversal

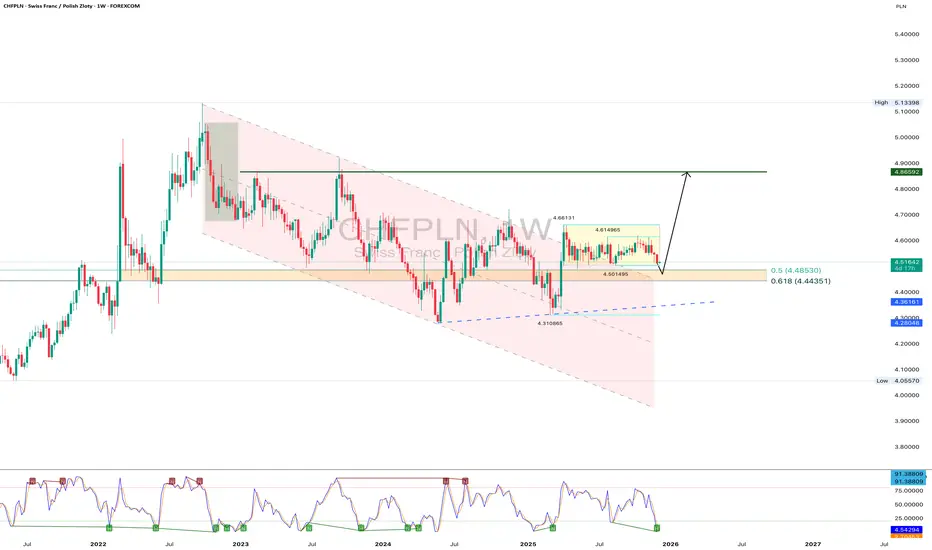
CHFPLN preparing a move or just testing everyone patienceCHFPLN continues to trade inside a developing upward structure after breaking out of a wide descending channel. The current pullback has brought the pair into the demand zone between 4.48 and 4.44 which aligns with the Fibonacci correction range at 0.5 and 0.618. Weekly oscillator divergence signals active buyers defending the lower boundary of the structure. The horizontal level at 4.50 also acts as support increasing the probability of a local reversal. As long as price holds above 4.44 the bullish continuation scenario remains valid. The main target is located near 4.86 which corresponds to the key resistance of the previous pivot. A breakdown of 4.44 may trigger a deeper correction however current price behavior and buyer reaction still favor a recovery.
The market may pretend nothing is happening yet demand zones rarely forget what they are designed to do.
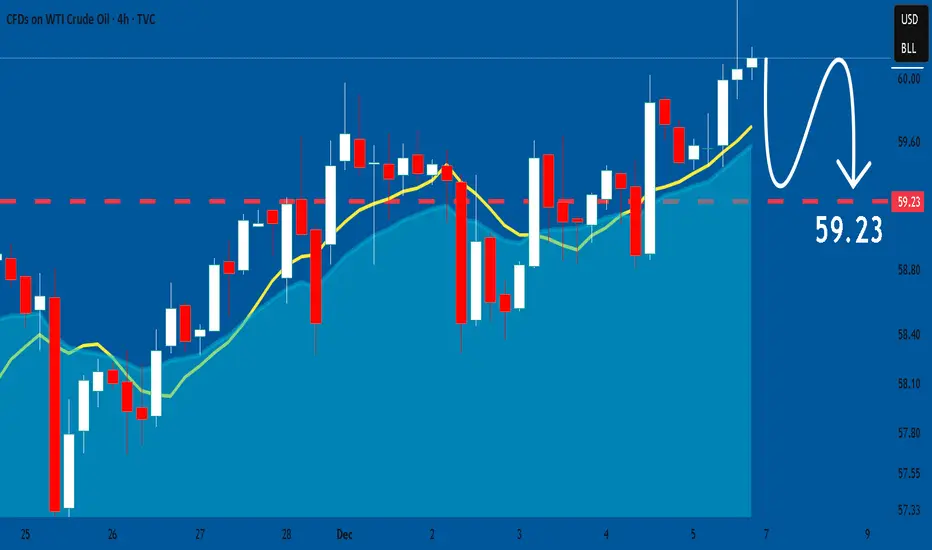
USOIL: Market Sentiment & Price Action
The analysis of the USOIL chart clearly shows us that the pair is finally about to tank due to the rising pressure from the sellers.
Disclosure: I am part of Trade Nation's Influencer program and receive a monthly fee for using their TradingView charts in my analysis.
❤️ Please, support our work with like & comment! ❤️
SILVER: Bearish Continuation & Short Trade
SILVER
- Classic bearish pattern
- Our team expects retracement
SUGGESTED TRADE:
Swing Trade
Sell SILVER
Entry - 58.349
Stop - 58.743
Take - 57.644
Our Risk - 1%
Start protection of your profits from lower levels
Disclosure: I am part of Trade Nation's Influencer program and receive a monthly fee for using their TradingView charts in my analysis.
❤️ Please, support our work with like & comment! ❤️

SPY: Bearish Forecast & Bearish Scenario
Looking at the chart of SPY right now we are seeing some interesting price action on the lower timeframes. Thus a local move down seems to be quite likely.
Disclosure: I am part of Trade Nation's Influencer program and receive a monthly fee for using their TradingView charts in my analysis.
❤️ Please, support our work with like & comment! ❤️
