NATGAS Local Bearish Pullback Expected! Sell!
Hello,Traders!
NATGAS is about to hit
A strong horizontal resistance
Level of 3.880$ after a sharp
Push upwards by the bulls
So a local correction is needed
From the resistance with the
Expected target being the
Local level below at 3.655$
Sell!
Comment and subscribe to help us grow!
Check out other forecasts below too!
Disclosure: I am part of Trade Nation's Influencer program and receive a monthly fee for using their TradingView charts in my analysis.
SMC-ICT

GBP-USD Strong Breakout! Sell!
Hello,Traders!
GBP-USD made a bearish
Breakout of the key wide horizontal
Level of 1.2851 then made a
Pullback so we are bearish
Biased and a further bearish
Continuation is to be expected
Sell!
Comment and subscribe to help us grow!
Check out other forecasts below too!
Disclosure: I am part of Trade Nation's Influencer program and receive a monthly fee for using their TradingView charts in my analysis.

ETHEREUM BEARISH BREAKOUT|SHORT|
✅ETHEREUM keeps falling
Down and the price made a
Bearish breakout of the
Key horizontal level of 1600$
And the breakout is confirmed
So we are bearish biased
And we will be expecting a
Further bearish move down
SHORT🔥
✅Like and subscribe to never miss a new idea!✅
Disclosure: I am part of Trade Nation's Influencer program and receive a monthly fee for using their TradingView charts in my analysis.

NATGAS Bearish Breakout! Sell!
Hello,Traders!
NATGAS made a bearish
Breakout of the key horizontal
Resistance of 3.626$ and the
Breakout is confirmed so we
Are bearish biased and we will
Be expecting a further
Bearish move down
Sell!
Comment and subscribe to help us grow!
Check out other forecasts below too!
Disclosure: I am part of Trade Nation's Influencer program and receive a monthly fee for using their TradingView charts in my analysis.

USOIL CATCHING THE FALLING KNIFE|LONG|
✅CRUDE OIL lost 18% of it's
Value in the last 5 days on the
Trade war news, which makes
The market to expect a recession
And a sharp drop in the oil demand
However, I still think that Oil
Is locally oversold, therefore
A local bullish correction is
To be expected from the
Horizontal support below
Around 57.34$ and the
Target being the resistance
Above around 61.81$
LONG🚀
✅Like and subscribe to never miss a new idea!✅
Disclosure: I am part of Trade Nation's Influencer program and receive a monthly fee for using their TradingView charts in my analysis.

EURUSD - Short Trade Confirmation :
1. Bearish Order-Flow
2. Market retraced to the supply zone with the help of previous demand, which is liquidity now
3. Tapped into the premium supply zone
4. M5 CHoCH to the downside
5. Previous high reacted as an Inducement
6. Entered in the supply tap
The only thing that is concerning the trade is market tapped into the 15m support trend-line. Once the trend-line is taken out with the strong bearish candle closure, that can add an confluence to the trade.
Thanks for the time..

NATGAS BEARISH BREAKOUT|SHORT|
✅NATGAS formed a head
And shoulders pattern then
Made a bearish breakout of
The neckline which is now
A resistance of 3.850$
And the breakout is confirmed
So we are bearish biased and
We will be expecting a
Further bearish move down
SHORT🔥
✅Like and subscribe to never miss a new idea!✅
Disclosure: I am part of Trade Nation's Influencer program and receive a monthly fee for using their TradingView charts in my analysis.

NZD-USD Strong Support Ahead! Buy!
Hello,Traders!
NZD-NZD is approaching a
Horizontal support level
Of 0.5521 so when the
Market opens we will be
Expecting the pair to retest
The support first and then
Make a nice bullish rebound
Buy!
Comment and subscribe to help us grow!
Check out other forecasts below too!
Disclosure: I am part of Trade Nation's Influencer program and receive a monthly fee for using their TradingView charts in my analysis.

GBP_USD LONG SIGNAL|
✅GBP_USD made some crazy
Moves last week and was eventually pushed
Back down to the horizontal support of 1.2874
From where we will be expecting a local
Rebound, therefore we can go long on
The pair with the TP of 1.2946
And the SL of 1.2849
LONG🚀
✅Like and subscribe to never miss a new idea!✅
Disclosure: I am part of Trade Nation's Influencer program and receive a monthly fee for using their TradingView charts in my analysis.

EUR-USD Free Signal! Buy!
Hello,Traders!
EUR-USD made a nice
Bearish correction from the
Resistance above and hit
A horizontal support level
Of 1.0934 from where
We can go long on Monday
With the Take Profit of 1.0996
And the Stop Loss of 1.0906
Buy!
Comment and subscribe to help us grow!
Check out other forecasts below too!
Disclosure: I am part of Trade Nation's Influencer program and receive a monthly fee for using their TradingView charts in my analysis.

AUD-NZD Massive Long! Buy!
Hello,Traders!
AUD-NZD has also fallen
Down by a lot last week
And we think that the
Initial panic move is over
So as the pair is oversold
And is about to retest a
Horizontal support of 1.0740
A strong bullish correction
Is to be expected on Monday
Buy!
Comment and subscribe to help us grow!
Check out other forecasts below too!
Disclosure: I am part of Trade Nation's Influencer program and receive a monthly fee for using their TradingView charts in my analysis.

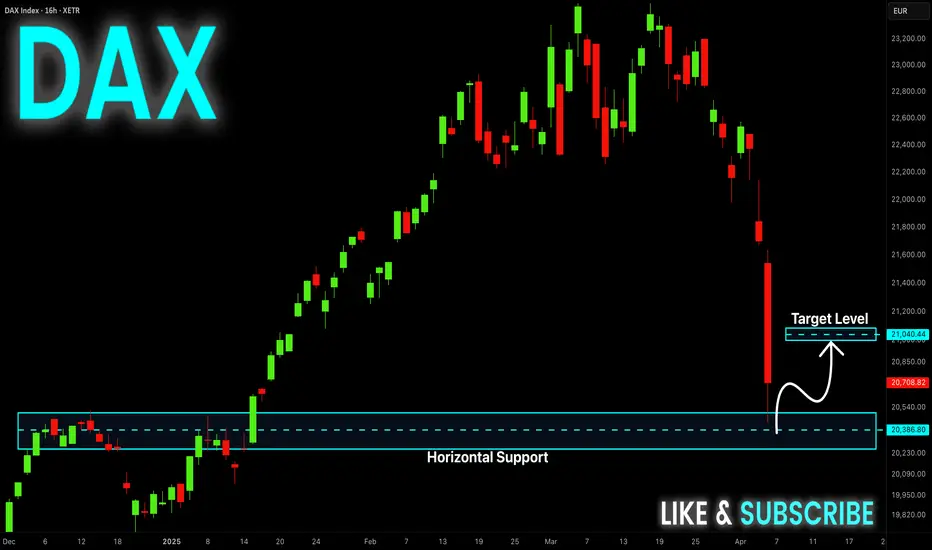
DAX Is Oversold! Buy!
Hello,Traders!
DAX fell down sharply
But will soon hit a
Horizontal support level
Of 20,230 and after the
Retest we will be expecting
A strong bullish rebound
Buy!
Comment and subscribe to help us grow!
Check out other forecasts below too!
Disclosure: I am part of Trade Nation's Influencer program and receive a monthly fee for using their TradingView charts in my analysis.
Market Review: Gold bullish imbalance & continuationWe are seeing the 4H bullish imbalance range give another rally. We will seek TP inside of the bearish inefficiencies above. Maybe seek height upon healthy retracement.
Share with those who need help 🙏🏾

Monday NasDaqMorning Buddy, Today I hope to see 2 things that I have put on my Journal, 1 : Nas is within a daily FVG which seems weak to hold, but enough to create a manipulative retracement, either into the highlighted zone, which is a weekly bullish candle. 2 : The gap gets slowly taken, increasing FOMO trading and then retraces leaving $ lows, should this happen I expect to see the market retrace in a way that makes 15 minutes charts going down to 5, seem completely bullish.
I will drop a video later today to keep up with the charts. Stay tuned. Happy Trading

Realtime markups: Indices tailspin to the weekly range lowsAfter rejecting the weekly highs aggressively on Wednesday, we had a clear run toward the low of the same weekly range candle's low. I believe this low will be hit before anything else.
We will see what the Monday open sequence looks like. See you then 🫡

Gold realtime adjustments and analysis: ATH consolidation rangeGold is sitting within a consolidation near the ATH. We are expecting a range break to give us a great opportunity next week.
Share with someone looking to learn 🧠

eurusd chart: trade idea 1 - go towards breaker blockeurusd chart: trade idea 1 - go towards breaker blockeurusd chart: trade idea 1 - go towards breaker blockeurusd chart: trade idea 1 - go towards breaker blockeurusd chart: trade idea 1 - go towards breaker blockeurusd chart: trade idea 1 - go towards breaker blockeurusd chart: trade idea 1 - go towards breaker blockeurusd chart: trade idea 1 - go towards breaker blockeurusd chart: trade idea 1 - go towards breaker blockeurusd chart: trade idea 1 - go towards breaker blockeurusd chart: trade idea 1 - go towards breaker blockeurusd chart: trade idea 1 - go towards breaker blockeurusd chart: trade idea 1 - go towards breaker blockeurusd chart: trade idea 1 - go towards breaker blockeurusd chart: trade idea 1 - go towards breaker blockeurusd chart: trade idea 1 - go towards breaker blockeurusd chart: trade idea 1 - go towards breaker blockeurusd chart: trade idea 1 - go towards breaker blockeurusd chart: trade idea 1 - go towards breaker blockeurusd chart: trade idea 1 - go towards breaker blockeurusd chart: trade idea 1 - go towards breaker blockeurusd chart: trade idea 1 - go towards breaker blockeurusd chart: trade idea 1 - go towards breaker blockeurusd chart: trade idea 1 - go towards breaker blockeurusd chart: trade idea 1 - go towards breaker blockeurusd chart: trade idea 1 - go towards breaker blockeurusd chart: trade idea 1 - go towards breaker blockeurusd chart: trade idea 1 - go towards breaker blockeurusd chart: trade idea 1 - go towards breaker block

NAS still charging for bullish targets but currently retracingWe are looking at a retest of break points on the session. Going into this session we will monitor what happens at the previously broken levels.
We do have bearish imbalances in LTFs that have yielded neat entry on shorts. Stay sharp in this range.
Share with someone in need on true levels 🔑

GBP_CHF WILL GROW|LONG|
✅GBP_CHF is trading along the rising support line
And as the pair is going up now
After the retest of the line
I am expecting the price to keep growing
To retest the supply levels above at 1.1409
LONG🚀
✅Like and subscribe to never miss a new idea!✅

EUR/USD Long Setup – Institutional & Retail Flows Align This EUR/USD long trade was executed based on a confluence of technical levels, institutional positioning, and macroeconomic factors. Here’s the breakdown of the trade execution, market influences, and the Prime Market Terminal insights that supported the decision.
📊 Trade Execution & Technicals
Entry: The trade setup was based on price retracing into a key Fibonacci retracement zone, aligning with a demand area before a bullish continuation.
Confluence: A combination of trendline support, 50%–79% Fibonacci levels, and liquidity sweeps confirmed the setup.
Target Zones: Price moved towards key Fibonacci extensions (-0.27 & -0.62 levels), which aligned with previous liquidity zones.
Market Structure: Higher timeframes indicated a bullish trend, reinforcing the long bias.
🎯 Trade Outcome
The trade executed as planned, with price bouncing off the retracement levels and moving towards the projected take-profit zones. Bullish continuation confirmed the validity of the setup, as institutional order flow aligned with the technicals.
⚡ High-Impact News That Influenced EUR/USD
📌 Economic data from the Prime Market Terminal showed major USD events:
ISM Manufacturing PMI (53.5) exceeded expectations (52.8) – initially strengthening USD.
Durable Goods Orders rose by 3.2%, reinforcing economic resilience.
EIA Weekly Crude Stocks & Fed's Beige Book impacted liquidity and volatility in the market.
🛑 Impact on the Trade:
Positive USD data initially caused short-term retracements, offering a discounted entry for longs.
Market reaction confirmed a USD exhaustion, leading to EUR/USD bullish momentum.
📈 Volatility & Liquidity Insights
📌 Volatility data from the Prime Market Terminal indicated:
EUR/USD ATR increased, signaling higher liquidity grabs and expansion.
Liquidity Pools: Visible range analysis showed high-volume nodes near the Fibonacci retracement area, acting as liquidity traps before the bullish push.
Institutional Order Flow: Increased volume and liquidity injection around key price levels confirmed smart money accumulation.
🏦 Institutional Positioning & Market Flow
📌 COT (Commitment of Traders) Report Insights:
Institutional Traders: Increased long positions on EUR/USD, signaling confidence in the bullish move.
Retail Sentiment: Majority of retail traders were short, fueling a short squeeze that propelled price higher.
Market Depth Data: Prime Market Terminal showed institutional buy orders stacking near the key demand zone, reinforcing the long setup’s strength.
🔥 Conclusion
✅ The confluence of technicals, fundamental news, volatility data, and institutional flows provided a high-probability long setup on EUR/USD.
✅ Key Takeaway: Combining macro analysis with technicals and liquidity insights can increase the accuracy of trade setups.
📌 Did you catch this move? Let me know your thoughts in the comments! 🚀💬

Gold Futures - Potential Springtime ReversalGold futures have been on a rally, but recent price action suggests a potential shift. Could we be witnessing a Wyckoff distribution forming?
Understanding Wyckoff Distribution
The Wyckoff distribution pattern occurs when large institutions begin selling off their positions to retail traders before a downtrend begins. This phase is often characterized by sideways price movement, false breakouts, and key "Signs of Weakness" (SOW) that hint at an impending sell-off.
A Recent Sign of Weakness in Gold Futures
A possible sign of weakness in gold futures was observed recently when prices gave a false break out at what retail traders would label "key levels".
Historical Seasonal Trends: Spring Reversals
Looking at historical data, Moore Research Center, Inc. (MRCI.com) has tracked seasonal gold price patterns for over 40 years. Their findings indicate that gold often experiences price reversals during the spring months. This aligns with the idea that we could be heading into a seasonally weak period, increasing the likelihood of a distribution phase playing out.
What Traders Should Watch For
As Gold rallies back towards a new all time high we should be aware that it may be just a false break to form the final phases of a distribution schematic. This would form an upthrust, and upthrust after distribution, followed by a sharp retracement back into the range and ultimately leading to a sell off and market reversal.
Final Thoughts
While nothing is certain, the combination of the financial institutions footprint and historical seasonal data suggests gold traders should proceed with caution. Whether you’re trading futures or investing in physical gold, staying aware of these patterns can help you make informed decisions.
Do you think a Wyckoff distribution is playing out in gold? Share your thoughts in the comments!

BTC hitting key demand zone as forecast weeks agoIf you've been following the narrative here, you know what we are looking at. This dip is to establish the yearly low in BTC as forecast before the new year's candle started.
Let me know what you're seeing and we'll discuss it in the next video. Be sure to sub & like. Thanks for watching.

XRP price at a crucial decision point – massive breakout coming?XRP is currently trading at a critical support level, sitting within a 4-hour Fair Value Gap (FVG) around the $2.50 mark. This zone has proven to be a strong demand area, with price reacting and bouncing from it multiple times. However, XRP is now approaching a major trendline resistance, meaning a huge move is coming whether bullish or bearish depends on what happens next!
🔥 The Key Levels You Need to Watch Right Now
🟢 Bullish Scenario – A Breakout Could Send XRP Soaring!
The black descending trendline has been a strong resistance for XRP, capping price movement to the upside.
If price breaks above this trendline and successfully retests it as support, this would confirm a bullish breakout, likely leading to a surge in price.
A successful breakout could see XRP rally towards $2.70, $2.80, and possibly even higher, as there is less resistance above these levels.
🔴 Bearish Scenario – FVG Breakdown Could Spell Trouble!
The 4-hour Fair Value Gap (FVG) around $2.50 is a major support level, and price has already shown significant reactions here.
However, if XRP fails to break above the trendline and instead falls below the FVG zone, this could lead to further downside pressure.
A clean break below $2.50 could send XRP tumbling toward lower support levels, potentially $2.40 or even lower.
🚀 What’s Next for XRP? A Big Move is Coming!
With price consolidating between these key levels, a breakout is inevitable. The bullish momentum will be confirmed if price breaks and retests the descending trendline as support. However, if XRP loses the FVG zone, then we could be looking at a shift in trend toward bearish continuation.
Final Thoughts – Get Ready for Volatility!
Right now, XRP is at a make-or-break moment. The next move will likely set the tone for the coming days. Keep an eye on how price interacts with these levels—whichever side breaks first will determine XRP’s next big move!
__________________________________________
Thanks for your support!
If you found this idea helpful or learned something new, drop a like 👍 and leave a comment—I’d love to hear your thoughts! 🚀
Make sure to follow me for more price action insights, free indicators, and trading strategies. Let’s grow and trade smarter together! 📈✨
