EURUSD potential Forecast for today | 31st October 2022Hi there guys!
I will be using SMC + ICT Concepts for my analysis.
I'm looking for a potential sell entry on EURUSD on the H1 Chart towards the 0.98755 level where the H4 POI is located.
Do give this post a boost if you guys enjoyed it!
Any questions feel free to ask me I will try my best to answer them.
SMC-ICT

NZDUSDlooking to short off this supply early next week, will bare in mind the USD high impact news on Monday for this but will be looking to get in on refined anyway.


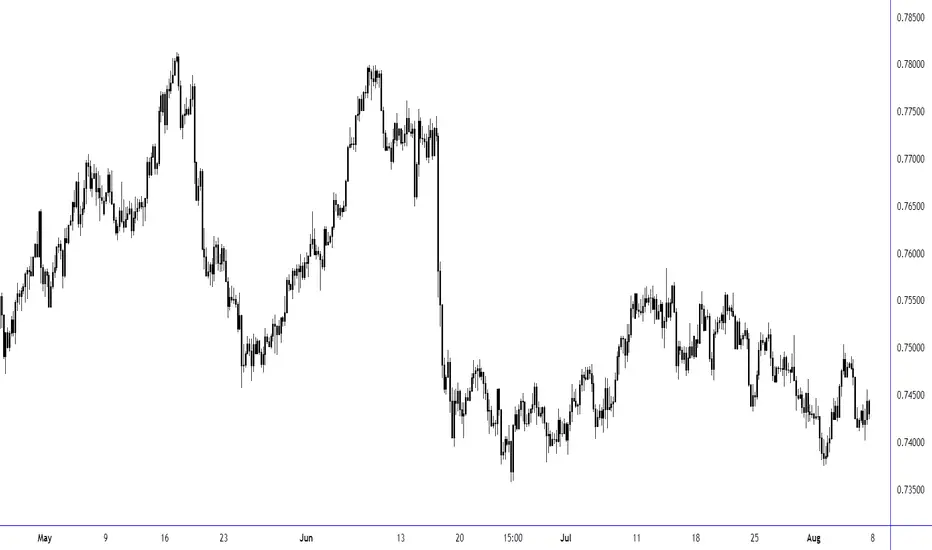
USDCHF Bullish Wave Triangle CorrectionUSDCHF will most likely continue to rise meaning that the main objective is the Bullish direction, I wouldn't consider taking the countertrend move even though it's optimum but not worth it. It's safe to wait for a Triangle correction pattern completion before buying still keeping in mind the fact that waves 1 and 4 never overlap.

BTC still expecting more upsidelittle more upside before capitulation dump in mid october. 20117 is my short target


RELEIF RALLY INBOUND BTCwhyckoff accumulation is finishing up here getting ready for a big pump. bigger dump won't come until mid-end October

EUR / USD IdeaPotential moves on EUR / USD. Potential short to long scenario. Very similar to NASDAQ. Let's see if we can get a trade opportunity

NAS Intraday/Scalp ShortNasdaq, potential setup to go short, targeting the zones below where price could reverse and go long

EURUSD Weekly TF (9/18/22)Price is bearish. We have a protected high and targeted low. More recently we see price failed to close past the low, signaling the internal high as weak. Price pulled back to supply of that internal high and gave a reaction back down.

Long position idea on $TRB [risky!]Quite a simple straightforward trade which could prove to be a big fail considering the FUD going around the project and how it is being called the next $LUNA but from a pure TA point of view this is a very valid trade.
Using adequate risk percentage / position sizing is vital and I can't stress enough on that.
Crazy funding rates on exchanges right now as well; -1.5% on ByBit right now for an example and that on its own is worthy of a shot at a long imo.
Entry and target zones marked.
LFG 🚀


EU weekly Fair Value Gap Entry Price traded up into a weekly sale side imbalance last week so my bias for this week will be bearish and I believe that we will have a down close weekly candle.
When the market open price gapped up leaving a volume imbalance. I also believe that interbank sellers push price up into a premium fair value price in order to sell short. That's my buyers for the week I am an intraday trader so I will be looking for shorts in between London open and London close specifically looking for entries at New York open between 8:30 a.m. to 9:30 a.m. I hope you find this insightful trade safely.

EURGBP and XAUUSD ForecastXAUUSD Analysis
The possibility of GOLD to buy are slightly high, but we do have to look at the old low which can be used as an invalidation level as waves 1 and 2 are never equal. We could potentially see price rally we reached the 78.6 Fibonacci golden zone. And the recent down wave looks to be corrective than impulsive.
EURGBP Analysis
The upside is potentially over as the impulse move pattern looks complete wave 1 and 4 are equal, waves 1 and 4 not overlapped. Chances are we will soon see price unfold as correction pattern( corrective phase).

Us30 Crucial PoiI personally believe that Us30 has retraced enough and there are valid reasons why I'm thinking price will push down and make lower lows. Price has delievered and liquidity has been taken. If you followed my previous analysis you might have even profited.
Good Luck!

ETHUSD / NAS100 Bullish ForecastNAS100
We are trading in a bullish trend overall but on a smaller scale we will see fractals which in this case is an impulse move. We are trading at a 4th wave phase soon we sill see wave 5 completes soon before seeing the bigger pullback. Whether the 4th wave will move from the 38,2% Fibonacci level or the 50% its hard to tell but either way that doesn't dismiss the bullish idea we know that waves 1 and 4 never overlaps therefore we know where the invalidation is.
ETHUSD
Crypto currencies are all at discounted prices its more likely we will see then rise in value. From a technical view ETHUSD is trading in an impulse move similarly to NAS100 we are expecting a 5th wave completion.

XAUUSD / GBPUSD ForecastGBPUSD
Price is trading sideways as a corrective pattern which is a contractive bearish Triangle. On the bigger degree we are in a wave 4 phase and looking to complete the wave 5 phase. We have to see the wave E complete before seeing the next drop.
XAUUSD
We have an impulse sequence unfolding on the bearish direction. Waves 1 and 4 not overlapped and we are looking for a wave 5 completion. The wave 4 could be potentially be completed and we can soon see a drop.

NZDUSD Alternative Count Wave C/3 ?Recently we saw a Diagonal pattern structure, which in this case its double sided based on what the market is showing us now. The push up could be in a Zig-Zag correction pattern form suggesting we will see a sell-off to make a new low, then the second count suggest that the bullishness will still continue. From a Wednesday the USD will gain strength what this means for AUDUSD is that we will sell-off the question is how long will it decline?
Whats your views?
we will make a new low.
we have to continue moving up.

Weekly Market Forecast Ep.47The JPY is still strong for next week expecting XXXJPY to sell off, the USD will weaken for the first two days and gain strength from Wednesday with the FOMC. From a Technical aspect, XXXJPY is correcting and USDXXX is completing the correcting and getting ready for a rally, and the opposite for USDXXX we have to see a drop maybe not massive.

XAUUSD Short-term Sell-side Direction / Wave 5 Ending DiagonalXAUUSD is in a bullish sequence (impulse pattern) the pattern is valid as wave 3 is not the shortest wave and waves 1 and 4 not overlapped. Wave 5 is an Ending Contracting Diagonal pattern most likely we see a sell-off soon. Its gonna be hard to tell how deep the downside will last when considering trading the 1 and 4 hour but lower timeframe can offer good trading setup.
Waves 2 are not reliable like a flat correction a better way would obviously waiting for a the pullback then look for the 3rd wave on the bullish side the downside do has some opportunities on the lower timeframes.

CADJPY Wave 5 Completion / Elliott Wave AnalysisTechnical analysis is a useful tool to help us pre-determine market direction before hand. We are in a wave 5 phase of Elliott Wave Theory impulse move. Impulse moves are very easy to understand and are very basic if you talk about Elliott Wave people think of impulses, waves 1 and 4 never overlaps wave 3 never the shortest.
To confirm this is an impulse move we have to see price complete the fifth wave, note there are cases where we have a wave 5 truncation ( wave 5 failure) not often but possible. We have to be watching the fifth wave structure we 1-2-3-4-5 sequence either impulse or diagonals.

S&P500 Bullish Impulse Pattern | Wave 4 PullbackSPX is trading in an impulse move similarly to the Nas100 on the 4 Hour timeframe. Things we know about an impulse move is that wave 1 and 4 never overlaps therefore we can use that idea as an invalidation level for the pattern. Trading the pullback can be tricky considering the timeframe we are at and also the phase but on a lower timeframe like 5 to 15 minutes can be decent personally I don't prefer trading the A wave waiting for a C wave is better, but note the main bias is bullish in general.

CADCHF Bullish Direction BiasCADCHF has been in a Bearish sequence for a while now which is a corrective phase. As we know no trend lasts forever there is always an end to everything. Most likely we will trade in a bullish trend very soon considering the CAD strength from a fundamental-based analysis. By using correlation with related pairs the USDCHF can be a great case study as in unfolding in a Bullish impulse sequence. Considering the previous outlook we will make a new high.