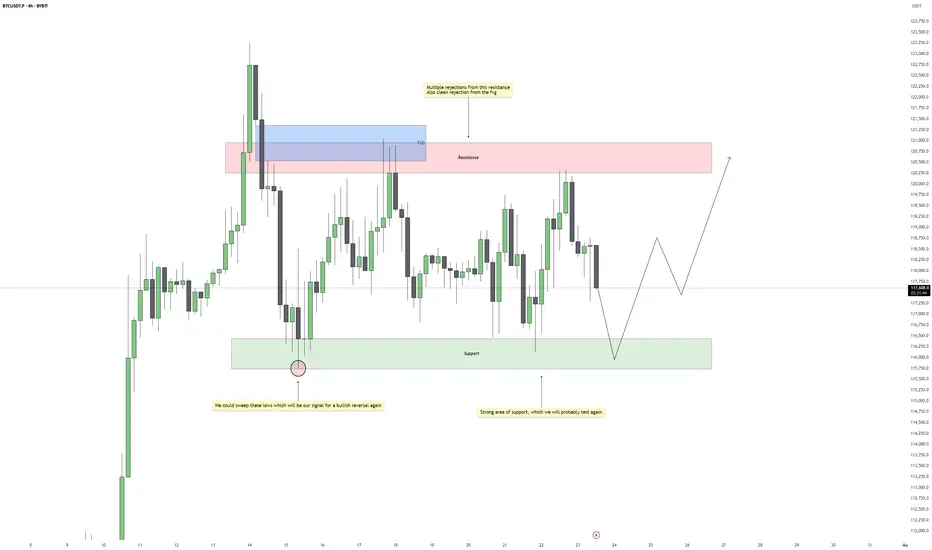
Bitcoin - Bullish Reversal PotentialBitcoin is currently consolidating within a well-defined range, with repeated rejections from the upper resistance zone and strong reactions from the support below. Price continues to respect both ends of the structure, suggesting that liquidity is being built up on both sides. Until a clear breakout occurs, we should expect more range-bound movement with sharp rejections near the boundaries.
Support Zone and Liquidity Engineering
The support zone beneath current price action has already held several times, showing clear buying interest. However, the lows around this area remain relatively clean. A sweep of those lows would not only engineer sell-side liquidity but also set the stage for a reversal if buyers step back in. This would align well with typical accumulation behavior seen during consolidation phases.
Rejections from Resistance and FVG Influence
Price has shown multiple rejections from the resistance zone, particularly inside the fair value gap that sits just above it. This confirms that the area is actively defended and will likely be the next upside target if price manages to bounce from support. The FVG itself acts as a magnet once price begins to trend again, especially if a strong displacement follows a sweep.
Expected Flow and Trade Opportunity
The anticipated scenario involves price dipping back into support, possibly sweeping the lows for inducement, and then bouncing with a shift in short-term structure. If that happens, we can expect a move back toward resistance, completing another rotation within the range. The sweep would offer an added layer of confirmation, giving a stronger reason to look for long setups.
Invalidation and Risk Perspective
If support fails to hold and price breaks beneath the range without immediate recovery, that would invalidate the bullish view and point to a potential shift in directional bias. As long as price stays inside the current consolidation, however, this remains a waiting game for either a clean reaction from support or a sweep followed by structure shift.
Conclusion
Bitcoin remains locked in a clear range, and until the breakout happens, the edges of that range offer the best trading opportunities. A sweep of the lows would act as a high-probability signal for a reversal back to the highs. Patience is key, wait for the sweep and confirmation before committing to the upside.
___________________________________
Thanks for your support!
If you found this idea helpful or learned something new, drop a like 👍 and leave a comment, I’d love to hear your thoughts! 🚀
SMC
EUR-CAD Bullish Wedge! Buy!
Hello,Traders!
EUR-CAD is trading in an
Uptrend and the pair formed
A bullish wedge pattern and
Now we are seeing a bullish
Breakout from the wedge so
We are bullish biased and we
Will be expecting a further
Bullish move up
Buy!
Comment and subscribe to help us grow!
Check out other forecasts below too!
Disclosure: I am part of Trade Nation's Influencer program and receive a monthly fee for using their TradingView charts in my analysis.

GBPUSD buy setupsimply
this is 6 deals after 5 CONSECUTIVE WINNING traders
we have demand
uptrend
the price can't make lower low
and make more candle in the area with more rejection
so the price will go up
be careful on your risk money management
BEST WISHES
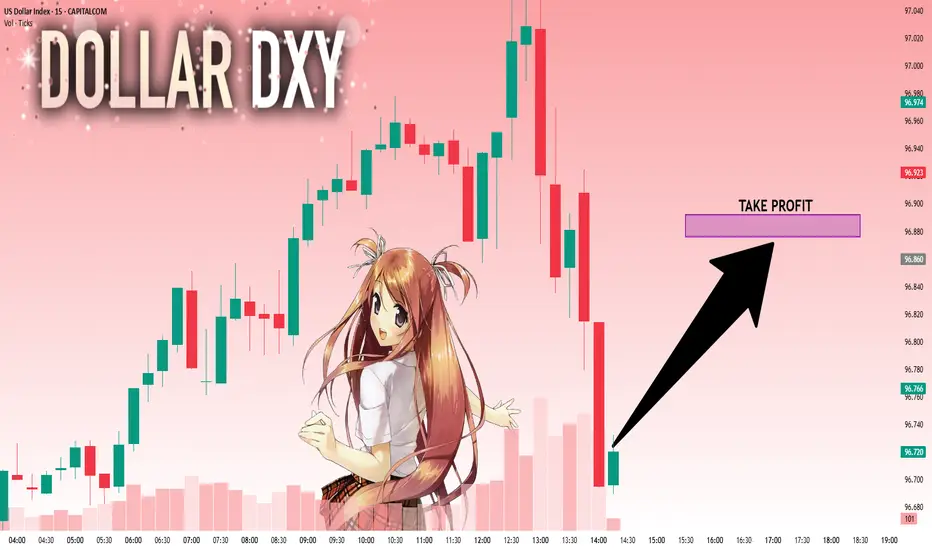
DXY: Strong Bullish Sentiment! Long!
My dear friends,
Today we will analyse DXY together☺️
The in-trend continuation seems likely as the current long-term trend appears to be strong, and price is holding above a key level of 96.722 So a bullish continuation seems plausible, targeting the next high. We should enter on confirmation, and place a stop-loss beyond the recent swing level.
❤️Sending you lots of Love and Hugs❤️
SILVER: Bulls Are Winning! Long!
My dear friends,
Today we will analyse SILVER together☺️
The market is at an inflection zone and price has now reached an area around 39.025 where previous reversals or breakouts have occurred.And a price reaction that we are seeing on multiple timeframes here could signal the next move up so we can enter on confirmation, and target the next key level of 39.148.Stop-loss is recommended beyond the inflection zone.
❤️Sending you lots of Love and Hugs❤️

EURUSD: Next Move Is Down! Short!
My dear friends,
Today we will analyse EURUSD together☺️
The price is near a wide key level
and the pair is approaching a significant decision level of 1.17658 Therefore, a strong bearish reaction here could determine the next move down.We will watch for a confirmation candle, and then target the next key level of 1.17506..Recommend Stop-loss is beyond the current level.
❤️Sending you lots of Love and Hugs❤️

GOLD: Target Is Down! Short!
My dear friends,
Today we will analyse GOLD together☺️
The recent price action suggests a shift in mid-term momentum. A break below the current local range around 3,359.59 will confirm the new direction downwards with the target being the next key level of 3,350.22.and a reconvened placement of a stop-loss beyond the range.
❤️Sending you lots of Love and Hugs❤️

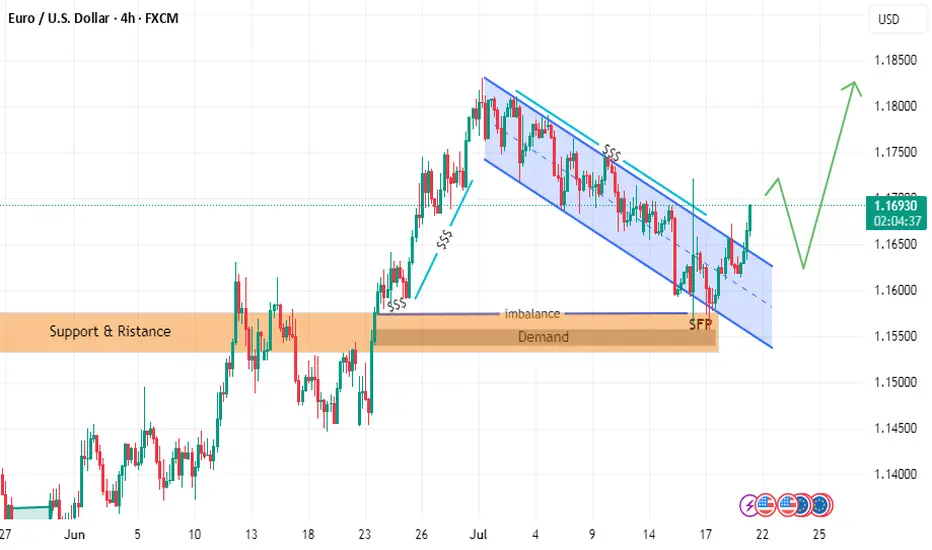
follow EURUSD LION & PLANE BUY SETUPTHE PRICE has moved as I explained in the last two posts
but we have some update to go along the way
the price could break failing channel
and withdrawal liquidity and filled imbalance
hence reflect from demand zone with zero reflection as i explained in last post with rock and plane
and it will go up to take liquidity in failing channel or downtrend
Bullish Leg on Gold? Good morning traders,
Here is my forecast on the 4h chart for Gold.
We could potentially see a bullish leg if this 4h breaker block price area holds as support. And could see a retracement towards buyside imbalance in the form of a 4h FVG (Fair Value Gap) at around equilibrium (50%) towards $3,400.
Regards,
Aman
DXY 1D – Tipping Point: News or Price Action?Hey Guys,
The DXY index is currently moving within a downtrend. This trend is unlikely to reverse unless it breaks above the 98.950 level.
Sure, key fundamental data could shift the trend, but without those news catalysts, a reversal at this point doesn’t seem realistic.
Don’t forget—98.950 is a critical threshold for the DXY.
I meticulously prepare these analyses for you, and I sincerely appreciate your support through likes. Every like from you is my biggest motivation to continue sharing my analyses.
I’m truly grateful for each of you—love to all my followers💙💙💙

GBPUSD - Next buy from demandLooking here for potential further buying momentum to the upside.
Will see how this plays out tomorrow

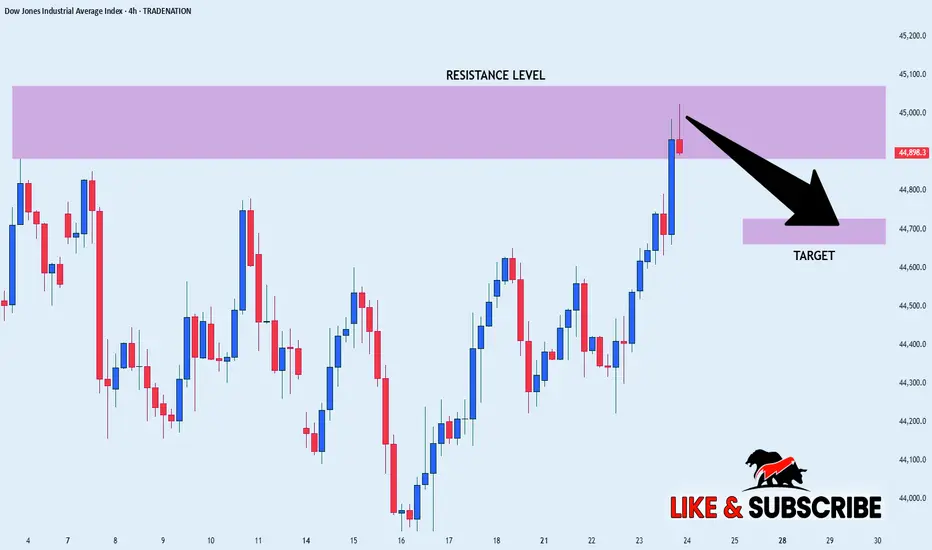
US30 SHORT FORM RESISTANCE|
✅DOW JONES index keeps
Growing in a strong uptrend
And we are bullish biased long-term
However the price has hit an all-time-high
Resistance level of 45,072(which can be seen
Further left you zoom out on higher TF)
So as we are already seeing a local
Bearish reaction we will be
Expecting a local bearish correction
SHORT🔥
✅Like and subscribe to never miss a new idea!✅
Disclosure: I am part of Trade Nation's Influencer program and receive a monthly fee for using their TradingView charts in my analysis.
GOLD Rebound Ahead! Buy!
Hello,Traders!
GOLD is falling down now
But will soon hit a horizontal
Support level of 3375$
And as we are bullish biased
We will be expecting a rebound
And a local bullish correction
Buy!
Comment and subscribe to help us grow!
Check out other forecasts below too!
Disclosure: I am part of Trade Nation's Influencer program and receive a monthly fee for using their TradingView charts in my analysis.

AUD_USD BULLISH BREAKOUT|LONG|
✅AUD_USD is going up
Now and the pair made a bullish
Breakout of the key horizontal
Level of 0.6590 and the breakout
Is confirmed so we are bullish
Biased and we will be expecting
A further bullish move up
LONG🚀
✅Like and subscribe to never miss a new idea!✅
Disclosure: I am part of Trade Nation's Influencer program and receive a monthly fee for using their TradingView charts in my analysis.

NATGAS Support Ahead! Buy!
Hello,Traders!
NATGAS keeps falling but
A strong horizontal support
Level is ahead at 3.00$ so
After Gas retests the support
We will be expecting a local
Bullish rebound
Buy!
Comment and subscribe to help us grow!
Check out other forecasts below too!
Disclosure: I am part of Trade Nation's Influencer program and receive a monthly fee for using their TradingView charts in my analysis.

SILVER WILL KEEP GROWING|LONG|
✅SILVER is trading in an
Uptrend and the price made
A retest of the horizontal support
Level of 39.10$ and we are already
Seeing a bullish reaction so we
Are bullish biased and we will be
Expecting a further bullish move up
LONG🚀
✅Like and subscribe to never miss a new idea!✅
Disclosure: I am part of Trade Nation's Influencer program and receive a monthly fee for using their TradingView charts in my analysis.

GOLD LOCAL LONG|
✅GOLD went down from
The resistance just as I predicted
But a strong support level is ahead at 3380$
Thus I am expecting a rebound
And a move up towards the target of 3400$
LONG🚀
✅Like and subscribe to never miss a new idea!✅
Disclosure: I am part of Trade Nation's Influencer program and receive a monthly fee for using their TradingView charts in my analysis.

NZD-JPY Resistance Ahead! Sell!
Hello,Traders!
NZD-JPY is trading in an
Uptrend but the pair is locally
Overbought so after the pair
Hits the horizontal resistance
Level of 88.900 we will be
Expecting a local bearish
Move down
Sell!
Comment and subscribe to help us grow!
Check out other forecasts below too!
Disclosure: I am part of Trade Nation's Influencer program and receive a monthly fee for using their TradingView charts in my analysis.

CAD-JPY Local Long! Buy!
Hello,Traders!
CAD-JPY made a retest
Of the horizontal support
Level of 107.400 and we
Are already seeing a bullish
Rebound and we will be
Expecting a further local
Bullish move up
Buy!
Comment and subscribe to help us grow!
Check out other forecasts below too!
Disclosure: I am part of Trade Nation's Influencer program and receive a monthly fee for using their TradingView charts in my analysis.

XAUUSD LIVE OUTLOOK – JULY 23, 2025Good evening, traders—let’s get this right, no mistakes. Gold hit 3,438, then pulled back and found support exactly in the 3,380–3,390 zone. Here’s your precise update:
🔸 HTF OVERVIEW (H4 → H1)
New High & Liquidity Sweep: A clean breakout to 3,438 invalidated every old supply.
Primary Demand: Price settled into the 3,380–3,390 H4 order block (untested FVG beneath). H1 confirms this blue zone as the critical buy area.
Invalidated Supply: No valid sell zones until we carve fresh structure above 3,438.
🔹 LTF PRECISION (M30 → M15)
M30 Flow: Spike to 3,438, then instant drop into 3,380–3,390. Volume spiked on the decline, then eased as price held.
M15 Structure: Inside 3,380–3,390, watch for a clean BOS above 3,395—that’s your bull‑bear pivot. Until then, this zone is the edge of the knife.
🎯 KEY ZONES & TRIGGERS
Buy Zone #1 (Live): 3,380–3,390
Confluence: H4 order block + unfilled FVG + H1 swing low
Trigger: M15 BOS above 3,395 and retest.
Buy Zone #2 (Backup): 3,350–3,360
For a deeper pullback—untested H4 demand.
Sell Zone: 3,420–3,438
Confluence: unfilled H4 FVG + premium supply
Fade only on clear M15 rejection (pin‑bar/engulf).
Decision Pivot: 3,395
Above = bullish continuation; below = stand aside.
➡️ ACTION PLAN
Longs: Enter on M15 close above 3,395 and retest; targets at 3,420 then 3,438.
Shorts: Only on rally into 3,420–3,438 with a decisive rejection candle.
Invalidation: A sustained break below 3,380 warns of a deeper flush toward 3,350–3,360.
🚀 CALL TO ACTION
If this nailed your edge, smash that Like, Follow @GoldFxMinds for daily sniper updates, and Boost this post so your fellow traders don’t miss these live levels! Drop a 🔥 if you’re ready to strike the next move.
Disclosure: I’m part of TradeNation’s Influencer program and receive a monthly fee for using their chart feed.
— GoldFxMinds

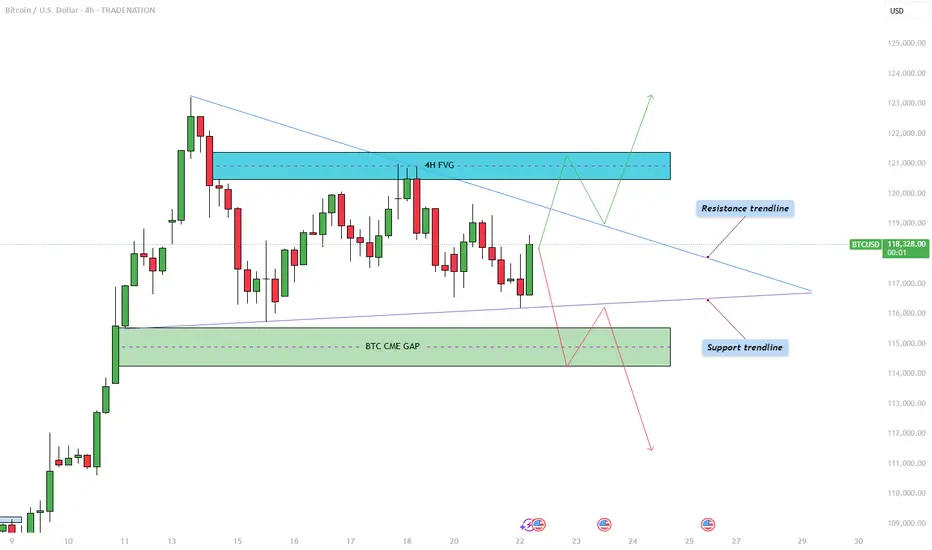
Bitcoin - Triangle pattern consolidation!The Bitcoin price action is currently coiling within a symmetrical triangle pattern on the 4-hour chart, as illustrated in the chart provided. After a significant bullish move earlier this month, BTC has now entered a phase of consolidation, marked by a series of lower highs and higher lows. This has formed a triangle pattern, suggesting an imminent breakout as price nears the apex. The upper boundary of the triangle acts as dynamic resistance, while the rising lower trendline provides firm support. Given the preceding upward momentum leading into this consolidation, the bias slightly favors a breakout to the upside, though the market can always surprise.
Bullish Scenario
In the bullish case, Bitcoin would need to break convincingly above the descending resistance trendline. Should that occur, the next key level to watch lies within the 4-hour bearish Fair Value Gap (FVG) between $120,500 and $121,400. This region represents an area of inefficiency where price moved rapidly in the past, and it is likely to attract selling pressure again. Bulls would ideally aim to reclaim this zone with strong momentum and potentially use it as support in a retest scenario. A successful retest of the triangle’s upper boundary could also trigger a liquidity grab above recent highs, particularly above the all-time high levels.
Bearish Scenario
On the flip side, a bearish breakout would involve BTC breaking below the ascending support trendline. If this happens, the most probable downside target would be the CME gap left behind from two weekends ago, located between $114,300 and $115,500. This price gap occurred due to the discrepancy between Friday’s closing price and Sunday’s opening price on the Chicago Mercantile Exchange, often a magnet for price reversion. After this gap is filled, it is possible that BTC sees a short-term bounce to retest the triangle from below, before potentially continuing lower to address further imbalances in price action.
How to Confirm a Valid Breakout
Trading triangle patterns can be deceptive, as BTC often exhibits false breakouts designed to trap traders on the wrong side. To confirm a valid breakout, it's crucial to observe at least a few 4-hour candles closing decisively above or below the triangle boundaries. Additionally, breakout strength should be accompanied by a noticeable increase in volume. A breakout without volume confirmation is often a sign of a fake move, and entering trades under such conditions can be highly risky.
Final Thoughts
BTC is currently consolidating within this symmetrical triangle formation, signaling a period of indecision and potential volatility ahead. While both bullish and bearish scenarios are plausible, it is essential to wait for clear confirmation before committing to a position. Patience and discipline are key, especially when navigating patterns prone to fake-outs. For now, remaining on the sidelines until a confirmed breakout occurs may be the most prudent strategy.
--------------------------
Disclosure: I am part of Trade Nation's Influencer program and receive a monthly fee for using their TradingView charts in my analysis.
Thanks for your support. If you enjoyed this analysis, make sure to follow me so you don't miss the next one. And if you found it helpful, feel free to drop a like and leave a comment, I’d love to hear your thoughts!
EURUSD: Strong Growth Ahead! Long!
My dear friends,
Today we will analyse EURUSD together☺️
The market is at an inflection zone and price has now reached an area around 1.17463 where previous reversals or breakouts have occurred.And a price reaction that we are seeing on multiple timeframes here could signal the next move up so we can enter on confirmation, and target the next key level of 1.17589.Stop-loss is recommended beyond the inflection zone.
❤️Sending you lots of Love and Hugs❤️

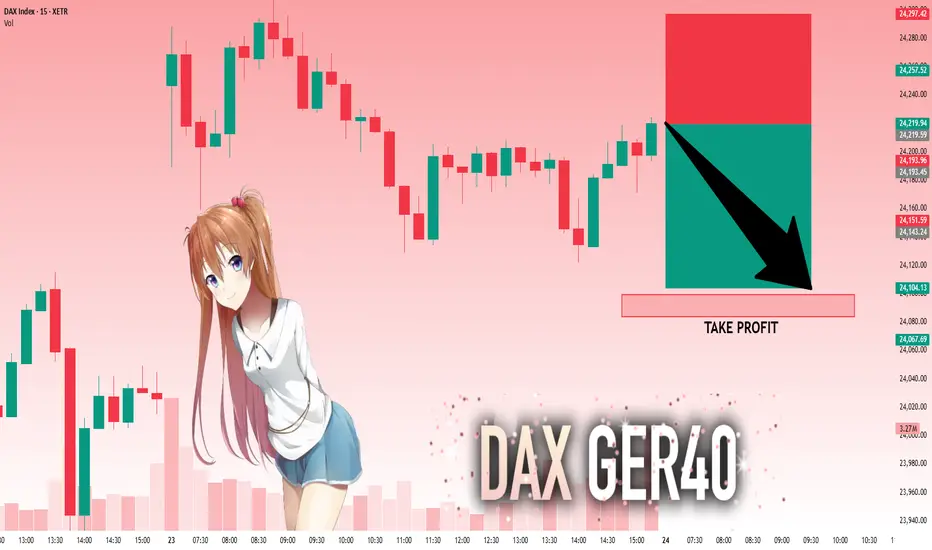
DAX: Target Is Down! Short!
My dear friends,
Today we will analyse DAX together☺️
The recent price action suggests a shift in mid-term momentum. A break below the current local range around 24,219.59 will confirm the new direction downwards with the target being the next key level of 24,099.27.and a reconvened placement of a stop-loss beyond the range.
❤️Sending you lots of Love and Hugs❤️