USDCAD's Opportunity Bell Is Ringing — Don’t Miss Out!Hey there, my valued friends!
I’ve prepared a fresh USDCAD analysis just for you.
📌 If the 1.37245 level breaks, the next target will be 1.38000.
Every single like you send my way is the biggest motivation behind sharing these analyses.
🙌 Huge thanks to each and every one of you who supports me!
Would you like to add a visual or a catchy headline to boost engagement even more? I can help with that too.
SMC

CAD_JPY STRONG UPTREND|LONG|
✅CAD_JPY is trading in an uptrend
Along the rising support line
Which makes me bullish biased
And the pair is already making
A bullish rebound from the support
So a further move up is expected
With the target of retesting the
Level above at 107.705
LONG🚀
✅Like and subscribe to never miss a new idea!✅

BITCOIN Swing Long! Buy!
Hello,Traders!
BITCOIN went down from
The highs but a strong support
Level is below around 112k$
So after the retest we will be
Expecting a local bullish rebound
Buy!
Comment and subscribe to help us grow!
Check out other forecasts below too!
Disclosure: I am part of Trade Nation's Influencer program and receive a monthly fee for using their TradingView charts in my analysis.

CRUDE OIL Bullish Bias! Buy!
Hello,Traders!
CRUDE OIL keeps falling down
And the price will soon hit
A horizontal support of 64.00$
From where we will be
Expecting a local bullish rebound
Buy!
Comment and subscribe to help us grow!
Check out other forecasts below too!
Disclosure: I am part of Trade Nation's Influencer program and receive a monthly fee for using their TradingView charts in my analysis.

USOIL FREE LONG SIGNAL|
✅CRUDE OIL retested the strong support level of 65.14$
After trading in a local downtrend from some time
Which makes a bullish rebound a likely scenario
With the Take Profit of 65.93 and SL of 64.69$
LONG🚀
✅Like and subscribe to never miss a new idea!✅

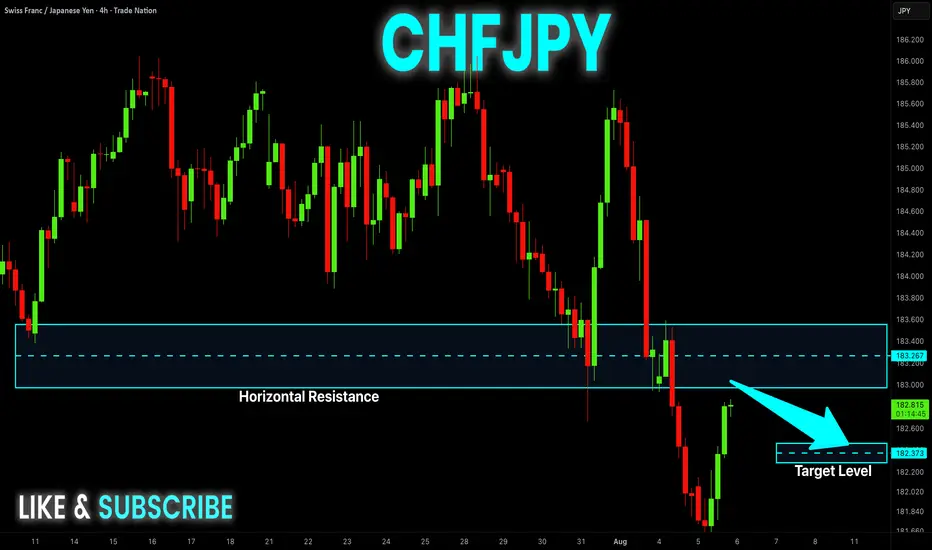
CHF-JPY Potential Short! Sell!
Hello,Traders!
CHF-JPY is making a rebound
But we are bearish biased
And after the pair hits the
Horizontal resistance of 183.400
We will be expecting a
Local bearish correction
Sell!
Comment and subscribe to help us grow!
Check out other forecasts below too!
Disclosure: I am part of Trade Nation's Influencer program and receive a monthly fee for using their TradingView charts in my analysis.
NZD_JPY LOCAL SHORT|
✅NZD_JPY went up sharply
But a strong resistance level was hit at 87.100
Thus I am expecting a pullback
And a move down towards the target of 86.937
SHORT🔥
✅Like and subscribe to never miss a new idea!✅

EUR-NZD Short From Resistance! Sell!
Hello,Traders!
EUR-NZD keeps growing
But the pair is locally overbought
So after the pair hits a horizontal
Resistance of 1.9680 we will
Be expecting a local correction
Sell!
Comment and subscribe to help us grow!
Check out other forecasts below too!
Disclosure: I am part of Trade Nation's Influencer program and receive a monthly fee for using their TradingView charts in my analysis.

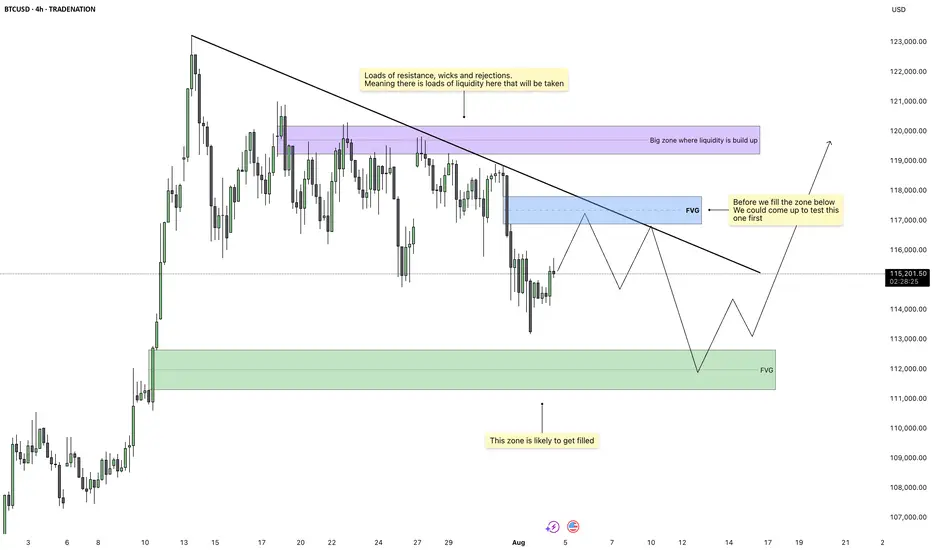
Bitcoin - Imbalance Fill Before Liquidity ExpansionBitcoin is trading inside a compressing structure beneath a clean descending trendline. Price action has been choppy but controlled, creating multiple zones of inefficiency that remain unfilled. We’re currently positioned between two major Fair Value Gaps, one above and one below, which gives us a clear roadmap. The broader market context suggests accumulation beneath key resistance, and the chart structure points toward a two-legged play before any breakout.
First Target: Upper Imbalance and Liquidity Trap
The first objective for price is to reach into the Fair Value Gap sitting just above current levels. This zone overlaps with the trendline and is backed by several wicks and failed breakouts, which likely means liquidity is built up there. Price may push through this area to trigger stop losses and induce breakout buying, only to reverse shortly after. The imbalance makes it an attractive magnet for price and a likely turning point once filled.
Retracement Move: Clean-Up Below
After sweeping the highs and filling the upper imbalance, price is expected to rotate back down. The area below holds an untouched Fair Value Gap from a previous bullish impulse, now acting as a demand zone. Once the upper inefficiency is filled, the market should drop into this zone to rebalance. This move will also help clear internal liquidity from the structure formed during the short-term rise.
Trendline, Inducement, and Execution Layers
The descending trendline plays a critical role here. With many traders watching it for a breakout or rejection, it acts as inducement. A false break or a touch just above the trendline may trigger entries in the wrong direction. The optimal move would be for price to react from the upper imbalance, reject at or just above the trendline, then fall into the lower zone, where we look for confirmation of reversal or continuation.
Final Expansion: Breakout After Cleanup
Once both Fair Value Gaps are filled and internal liquidity is cleared, Bitcoin will be in a clean position to rally. The area above the prior wicks and rejections is likely to hold significant liquidity, and the final move would aim to sweep that. This would complete the full cycle of imbalance fill, liquidity grab, and directional expansion. Price is unlikely to sustain a move higher until both zones have been addressed.
Conclusion
This setup focuses on efficient price delivery between key imbalances. Expect a short-term push up into the upper FVG and liquidity cluster, followed by a clean rejection into the lower demand zone. Once both sides are filled, Bitcoin should be ready for a real move higher, targeting liquidity above the current range. Let the market complete the cycle before looking for continuation.
Disclosure: I am part of Trade Nation's Influencer program and receive a monthly fee for using their TradingView charts in my analysis.
___________________________________
Thanks for your support!
If you found this idea helpful or learned something new, drop a like 👍 and leave a comment, I’d love to hear your thoughts! 🚀
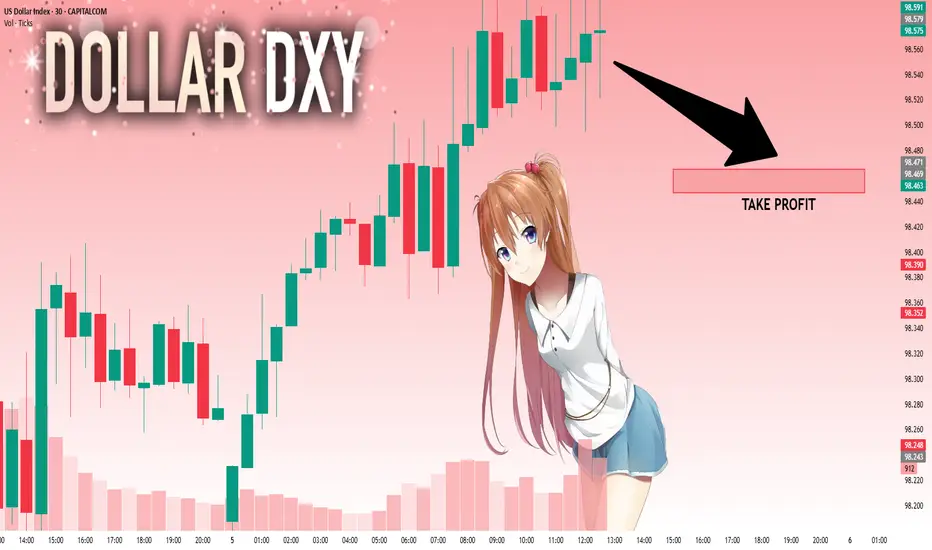
DXY: Absolute Price Collapse Ahead! Short!
My dear friends,
Today we will analyse DXY together☺️
The market is at an inflection zone and price has now reached an area around 98.553 where previous reversals or breakouts have occurred.And a price reaction that we are seeing on multiple timeframes here could signal the next move up so we can enter on confirmation, and target the next key level of 98.471.Stop-loss is recommended beyond the inflection zone.
❤️Sending you lots of Love and Hugs❤️
GOLD: Will Go Up! Long!
My dear friends,
Today we will analyse GOLD together☺️
The price is near a wide key level
and the pair is approaching a significant decision level of 3,361.98 Therefore, a strong bullish reaction here could determine the next move up.We will watch for a confirmation candle, and then target the next key level of 3,372.43.Recommend Stop-loss is beyond the current level.
❤️Sending you lots of Love and Hugs❤️

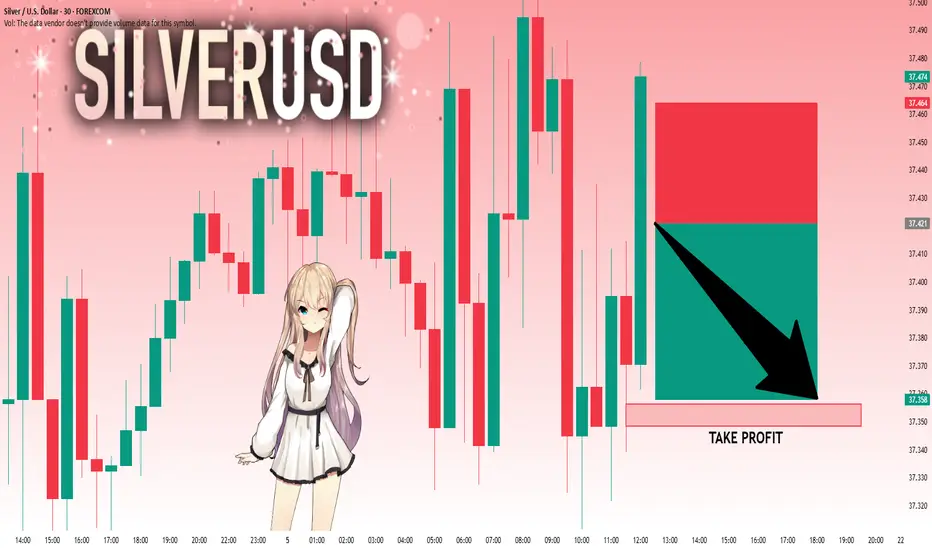
SILVER: The Market Is Looking Down! Short!
My dear friends,
Today we will analyse SILVER together☺️
The recent price action suggests a shift in mid-term momentum. A break below the current local range around 37.421 will confirm the new direction downwards with the target being the next key level of 37.356.and a reconvened placement of a stop-loss beyond the range.
❤️Sending you lots of Love and Hugs❤️
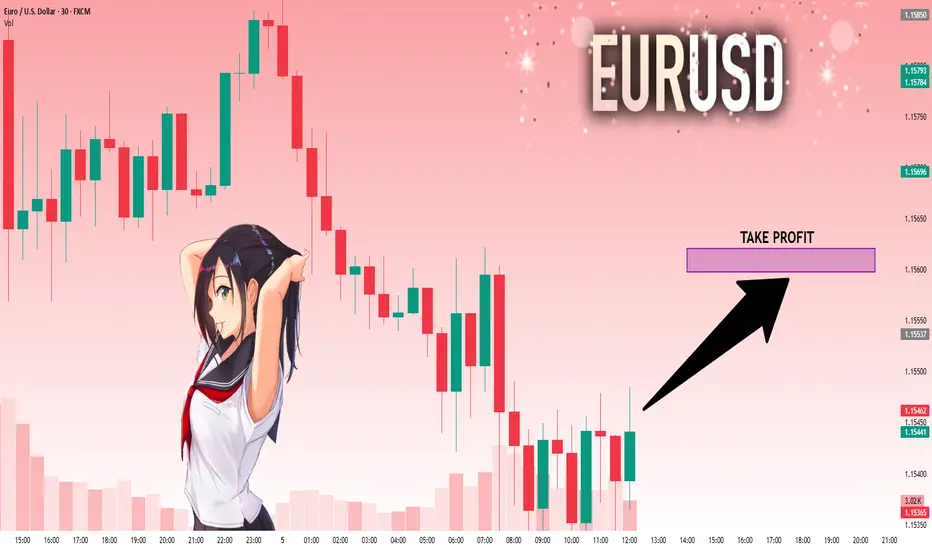
EURUSD: Strong Bullish Sentiment! Long!
My dear friends,
Today we will analyse EURUSD together☺️
The in-trend continuation seems likely as the current long-term trend appears to be strong, and price is holding above a key level of 1.15455 So a bullish continuation seems plausible, targeting the next high. We should enter on confirmation, and place a stop-loss beyond the recent swing level.
❤️Sending you lots of Love and Hugs❤️
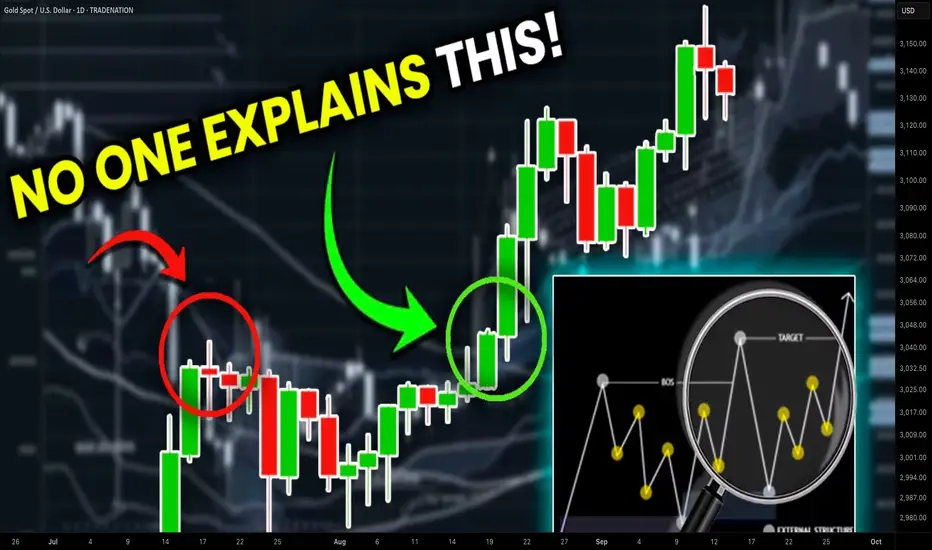
Accurate Price Model for Trading Smart Money Concepts SMC (=
If you trade Smart Money Concepts SMC, there is one single pattern that you should learn to identify.
In this article, you will learn an accurate price model that you can use to predict a strong bullish or bearish movement way before it happens.
Read carefully and discover how to track the silent actions of smart money on any market.
The only thing that you need to learn to easily find this pattern is basic Structure Mapping . After you map significant highs and lows, you will quickly recognize it.
This SMC pattern has 2 models: bullish and bearish ones.
Let's start with a bearish setup first.
Examine a structure of this pattern
it should be based on 2 important elements.
The price should set a sequence of equal lows.
These equal lows will compose a demand zone.
The area where a buying interest will concentrate.
The minimum number of equal lows and lowers highs should be 2 to make a model valid.
Exhausting of bullish moves will signify a loss of confidence in a demand zone . Less and less market participants will open buy positions from that.
At some moment, a demand zone will stop holding. Its bearish breakout will provide a strong bearish signal , and a bearish continuation will most likely follow.
This price model will signify a market manipulation by Smart Money.
They will not intentionally let the price fall, not letting it break a demand zone. A buying interest that will arise consequently will be used as a source of liquidity.
Smart money will grab liquidity of the buyers, silently accumulating huge volumes of selling orders.
Once they get enough of that, a bearish rally will start, with a demand zone breakout as a trigger.
Though, the chart model that I shared above has a strong bullish impulse, preceding its formation, remember that it is not mandatory.
The price may also form a bearish impulse first and for a pattern then.
Each bullish movement that initiates after a formation of an equal low should be weaker than a previous one.
So that the price should set a lower high every time after a formation of an equal low.
Look at a price action on USDCHF forex pair. Way before the price dropped, you could easily identify a market manipulation of Smart Money and selling orders accumulation.
A breakout of a horizontal demand zone was a final bearish confirmation signal.
Let's study its bullish model.
It has a similar structure.
The price should set a sequence of equal highs, respecting a horizontal supply zone.
Each bearish move that follows after its test should have a shorter length, forming a higher low with its completion.
This model will be also valid if it forms after a completion of a bearish impulse.
Weakening bearish movements will signify a loss of confidence in a supply zone, with fewer and fewer market participants selling that.
Its bullish breakout will be an important even that will confirm a highly probable strong bullish continuation.
Smart Money will use this price model to manipulate the market and accumulate buying orders, not letting the price go through a supply zone. They will grab a liquidity of the sellers each time a bearish move follows from a supply zone.
When they finally get enough of a liquidity, a bullish rally will initiate and a supply zone will be broken , providing a strong confirmation signal.
That price model was spotted on GBPJPY forex pair.
Smart Money were manipulating the market, not letting it continue rallying by creating a significant horizontal supply zone.
Selling orders that were executed after its tests provided a liquidity for them.
A bullish breakout of the underlined zone provides a strong bullish confirmation signal.
A breakout and a future rise could be easily predicted once this price model appeared.
Why they do it?
But why do Smart Money manipulate the markets that way?
The answer is simple: in comparison to retail traders, they trade with huge trading orders . To hide their presence and to not impact market prices much, they split their positions into a set of tiny orders that they execute, grabbing the liquidity.
The price model that we discussed today is the example how they do it.
The important thing to note about this pattern is that it efficiently works on any market and any time frame. You can use that for scalping, day trading, swing trading. And it can help you find great investing opportunities.
❤️Please, support my work with like, thank you!❤️
I am part of Trade Nation's Influencer program and receive a monthly fee for using their TradingView charts in my analysis.
GBP_NZD BULLISH BREAKOUT|LONG|
✅GBP_NZD broke the key structure level of 2.2500
While trading in an local downtrend
Which makes me bearish
And I think that after the retest of the broken level is complete
A rebound and bearish continuation will follow
SHORT🔥
✅Like and subscribe to never miss a new idea!✅

GBP-JPY Bearish Bias! Sell!
Hello,Traders!
GBP-JPY is going down
And the pair made a breakout
Of the key horizontal level
Of 195.500 so we are
Bearish biased and we
Will be expecting a
Further bearish move down
Sell!
Comment and subscribe to help us grow!
Check out other forecasts below too!
Disclosure: I am part of Trade Nation's Influencer program and receive a monthly fee for using their TradingView charts in my analysis.

Gold's Next Move? Eyes on the Liquidity Trap Below!Gold has created internal liquidity during the New York session and is now moving downward. There is liquidity resting below the recent swing lows, and beneath that lie bullish Pending Demand (PD) arrays. If the market takes out this liquidity, we can then look for bullish confirmations from the PD arrays for potential buy opportunities.
Do Your Own Research (DYOR).

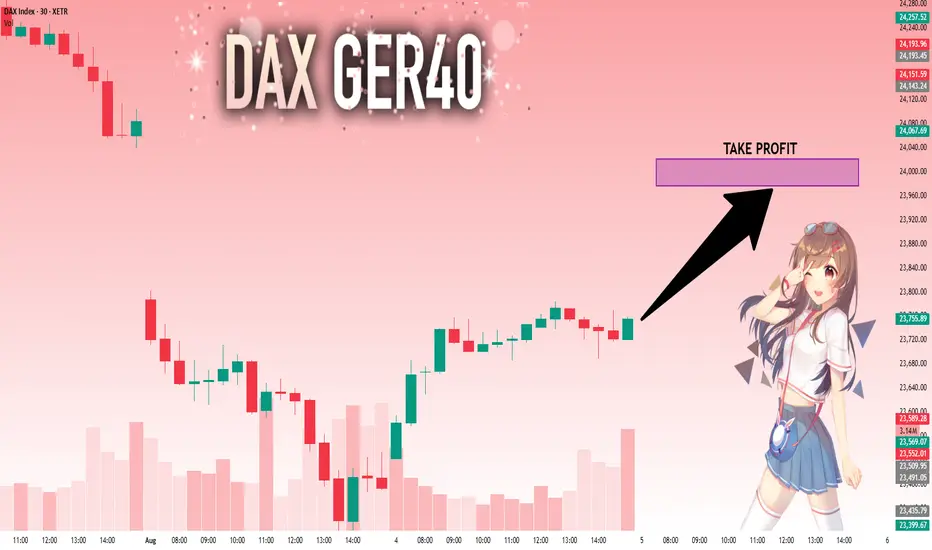
DAX: Bulls Are Winning! Long!
My dear friends,
Today we will analyse DAX together☺️
The market is at an inflection zone and price has now reached an area around 23,755.89 where previous reversals or breakouts have occurred.And a price reaction that we are seeing on multiple timeframes here could signal the next move up so we can enter on confirmation, and target the next key level of 23,976.72.Stop-loss is recommended beyond the inflection zone.
❤️Sending you lots of Love and Hugs❤️
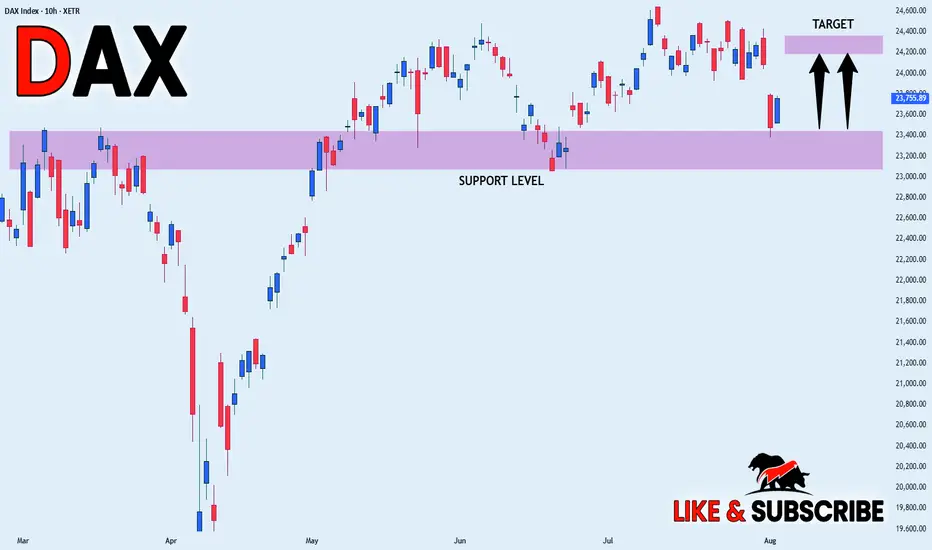
DAX WILL GROW|LONG|
✅DAX is trading in an
Uptrend and the index made
A bullish rebound from the
Horizontal support of 23,400
Which reinforces our bullish
Bias and we will be expecting
A further bullish move up
LONG🚀
✅Like and subscribe to never miss a new idea!✅
GOLD: Next Move Is Down! Short!
My dear friends,
Today we will analyse GOLD together☺️
The price is near a wide key level
and the pair is approaching a significant decision level of 3,372.04 Therefore, a strong bearish reaction here could determine the next move down.We will watch for a confirmation candle, and then target the next key level of 3,363.00..Recommend Stop-loss is beyond the current level.
❤️Sending you lots of Love and Hugs❤️
EURUSD: Target Is Down! Short!
My dear friends,
Today we will analyse EURUSD together☺️
The recent price action suggests a shift in mid-term momentum. A break below the current local range around 1.15671 will confirm the new direction downwards with the target being the next key level of 1.15480.and a reconvened placement of a stop-loss beyond the range.
❤️Sending you lots of Love and Hugs❤️
NATGAS Risky Long! Buy!
Hello,Traders!
NATGAS keeps falling down
In a strong downtrend
And Gas is locally oversold
So after the price hits the
Horizontal support of 2.860$
We will be expecting a
Local bullish correction
Buy!
Comment and subscribe to help us grow!
Check out other forecasts below too!
Disclosure: I am part of Trade Nation's Influencer program and receive a monthly fee for using their TradingView charts in my analysis.

SILVER: Move Up Expected! Long!
My dear friends,
Today we will analyse SILVER together☺️
The in-trend continuation seems likely as the current long-term trend appears to be strong, and price is holding below a key level of 37.330 So a bearish continuation seems plausible, targeting the next low. We should enter on confirmation, and place a stop-loss beyond the recent swing level.
❤️Sending you lots of Love and Hugs❤️