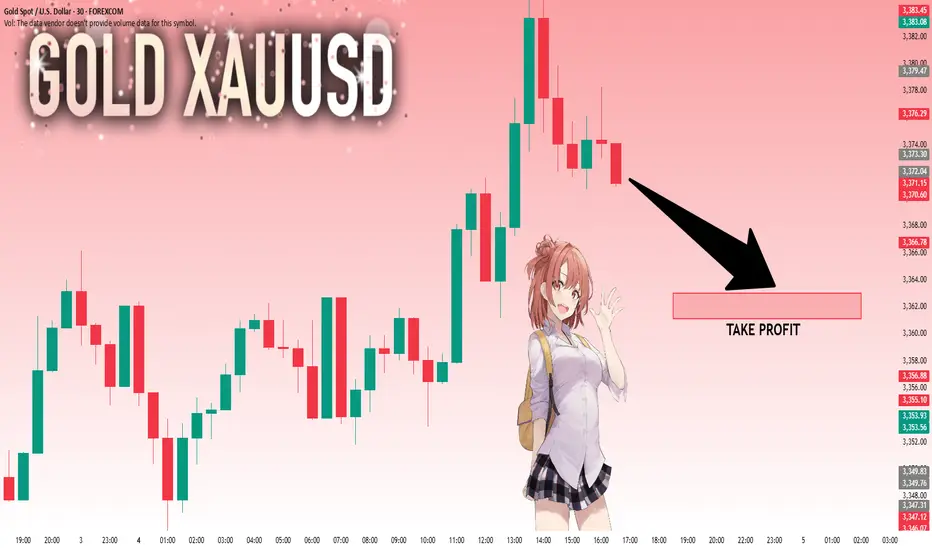
GOLD: Next Move Is Down! Short!
My dear friends,
Today we will analyse GOLD together☺️
The price is near a wide key level
and the pair is approaching a significant decision level of 3,372.04 Therefore, a strong bearish reaction here could determine the next move down.We will watch for a confirmation candle, and then target the next key level of 3,363.00..Recommend Stop-loss is beyond the current level.
❤️Sending you lots of Love and Hugs❤️
SMC
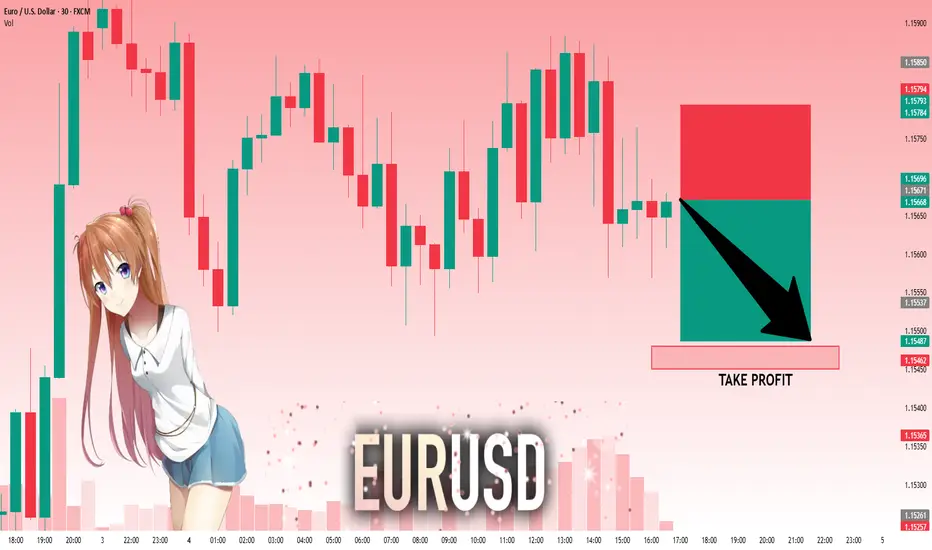
EURUSD: Target Is Down! Short!
My dear friends,
Today we will analyse EURUSD together☺️
The recent price action suggests a shift in mid-term momentum. A break below the current local range around 1.15671 will confirm the new direction downwards with the target being the next key level of 1.15480.and a reconvened placement of a stop-loss beyond the range.
❤️Sending you lots of Love and Hugs❤️
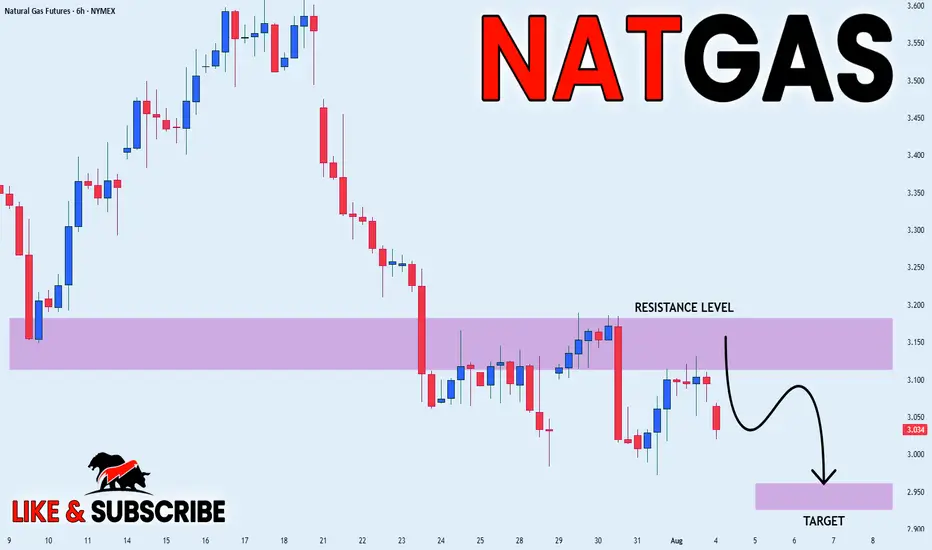
NATGAS Risky Long! Buy!
Hello,Traders!
NATGAS keeps falling down
In a strong downtrend
And Gas is locally oversold
So after the price hits the
Horizontal support of 2.860$
We will be expecting a
Local bullish correction
Buy!
Comment and subscribe to help us grow!
Check out other forecasts below too!
Disclosure: I am part of Trade Nation's Influencer program and receive a monthly fee for using their TradingView charts in my analysis.

SILVER: Move Up Expected! Long!
My dear friends,
Today we will analyse SILVER together☺️
The in-trend continuation seems likely as the current long-term trend appears to be strong, and price is holding below a key level of 37.330 So a bearish continuation seems plausible, targeting the next low. We should enter on confirmation, and place a stop-loss beyond the recent swing level.
❤️Sending you lots of Love and Hugs❤️

EUR_JPY SUPPORT AHEA|LONG|
✅EUR_JPY is going down now
But a strong support level is ahead at 169.757
Thus I am expecting a rebound
And a move up towards the target of 170.400
LONG🚀
✅Like and subscribe to never miss a new idea!✅
Disclosure: I am part of Trade Nation's Influencer program and receive a monthly fee for using their TradingView charts in my analysis.

EUR-CHF Resistance Ahead! Sell!
Hello,Traders!
EUR-CHF went up sharply
And the pair is locally
Overbought so after it
Hits the horizontal resistance
Above at 0.9367 we will be
Expecting a local bearish correction
Sell!
Comment and subscribe to help us grow!
Check out other forecasts below too!
Disclosure: I am part of Trade Nation's Influencer program and receive a monthly fee for using their TradingView charts in my analysis.

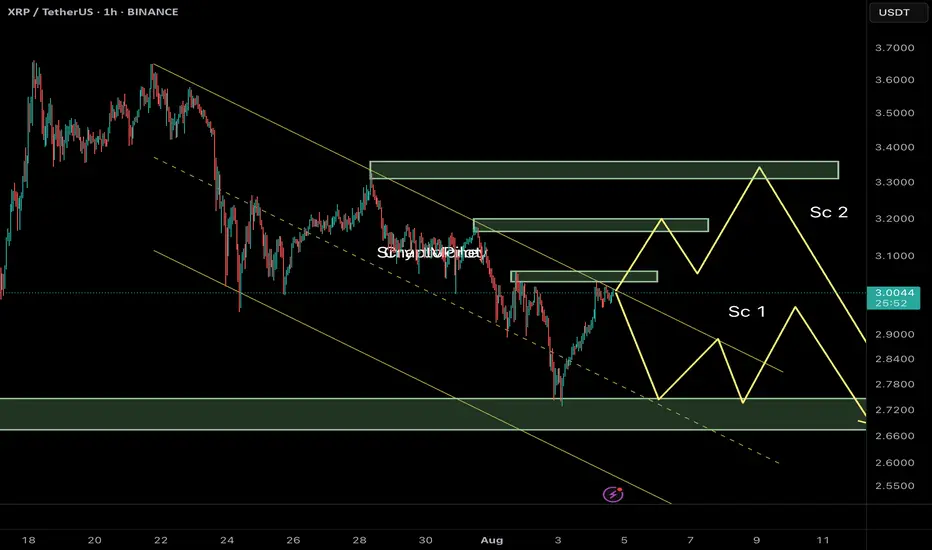
Ripple (XRP/USDT) Technical Analysis – 1H Timeframe🔰 Current Market Context:
After breaking below the ascending channel near $3.50, XRP has entered a corrective phase within a descending channel. Price is now hovering around a mid-range resistance zone, and we can outline two key potential scenarios from here:
⸻
📌 Scenario 1 (Sc1) – Immediate Rejection and Bearish Continuation
In this case:
• Price gets rejected from the current resistance zone ($3.05–$3.10).
• A quick corrective pattern (likely a Zigzag or Flat) plays out.
• XRP moves down to test the next demand zone near $2.70–$2.65, breaking below recent swing lows.
✅ This scenario aligns with the current weak structure and visible sell-side pressure. Liquidity above recent highs has likely been swept, creating a setup for continuation downward.
⸻
📌 Scenario 2 (Sc2) – Extended Correction with a Final Bull Trap
In this case:
• Price pushes higher toward a deeper resistance zone near $3.30–$3.40.
• A liquidity grab above the prior highs triggers a sharper reversal afterward.
• The overall structure could form a Diametric or Complex Correction, suggesting a deeper and more time-consuming wave before resuming the bearish trend.
⛔ This scenario requires strength and acceptance above $3.15, and should be treated as an alternative unless proven by price action.
⸻
🎯 Summary & Trade Strategy:
Scenario 1 is currently more probable unless we see a strong break and close above $3.10. Expectation: XRP may head toward the $2.70–$2.65 demand zone if resistance holds.
⚠️ Avoid entering early. Wait for confirmation via internal BOS (Break of Structure), bearish engulfing near OB zones, or signs of rejection with volume at resistance.
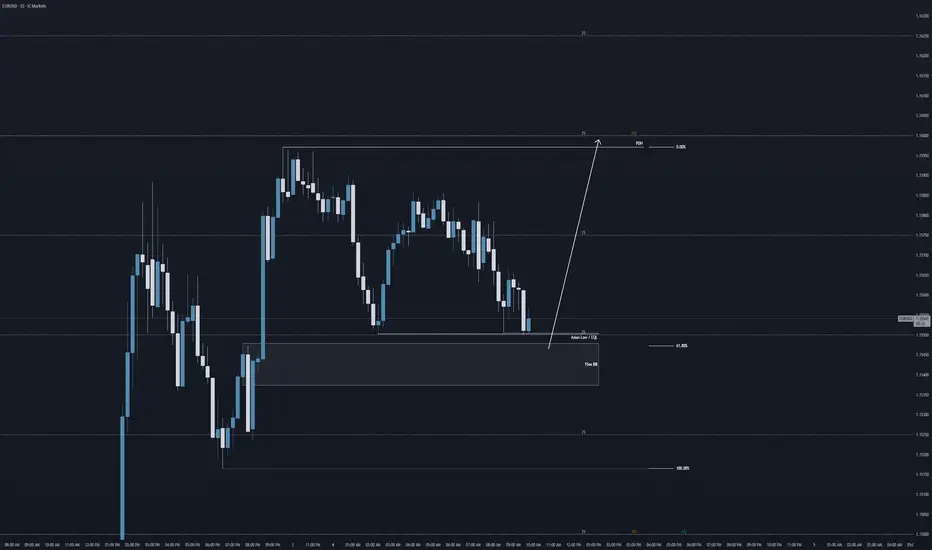
Bullish to sweep PDH (1.16)Good morning traders,
here is a bullish take on EURUSD for today.
I have my eyes set on the previous day high (PDH), and a sweep into key price level of 1.16.
Looking at an interim sell side liquidity sweep of the Asian lows into a 15m breaker block @ 61.8% FIB retracement.
Will of course wait for LTF structure confirmations before getting involved into the markets.
Kind regards,
Aman
SMC Wolf FX
NATGAS WILL FALL|SHORT|
✅NATGAS has retested a key resistance level of
And as the pair is already making a bearish pullback
A move down to retest the demand level below at 1.3434 is likely
SHORT🔥
✅Like and subscribe to never miss a new idea!✅
NZD-CAD Will Go UP! Buy!
Hello,Traders!
NZD-CAD made a retest
Of the horizontal support level
Of 0.8125 from where we
Are already seeing a nice
Bullish rebound so we will
Be expecting a further
Bullish move up
Buy!
Comment and subscribe to help us grow!
Check out other forecasts below too!
Disclosure: I am part of Trade Nation's Influencer program and receive a monthly fee for using their TradingView charts in my analysis.

Week of 8/3/25: EURUSD AnalysisPrice was bearish all of last week until NFP, resulting in a shift in 4h and 1h market structure to be bullish.
Focus this week is being bullish and following 1h order flow until it reaches the extreme of the daily bearish structure to then be cautious and seeing where price wants to go from there.
Major News:
Tuesday: PMI
Thursday: Unemployment Claims

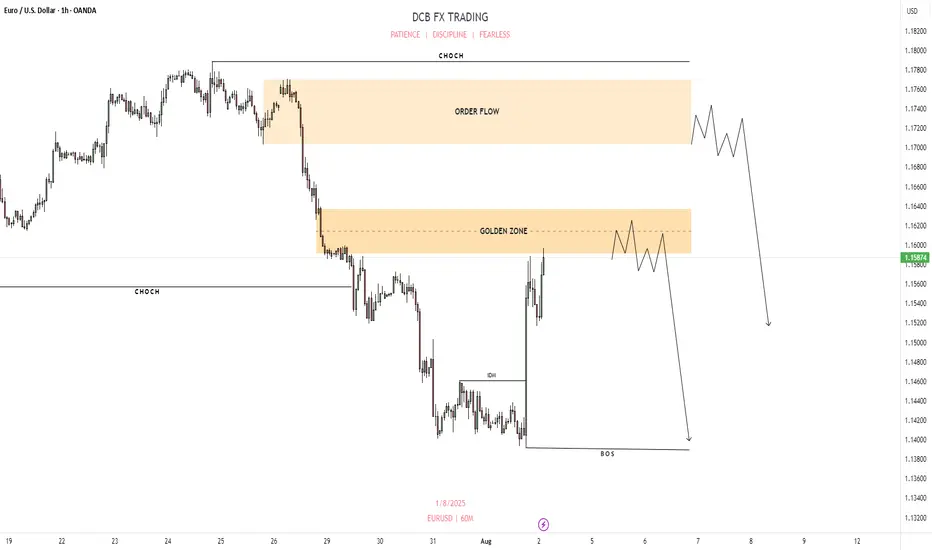
EURUSD SMC ANALYSIS H1 TIME FRAME📉 EURUSD 1H SMC CHART – SHORT BIAS ZONE ACTIVE!
🔶 GOLDEN ZONE REACHED
📍 Zone: 1.15912 – 1.16369
– Previous CHoCH + Clean OB + Premium zone
– Likely area for Smart Money to initiate sell positions
– Price reacting aggressively upon entry
📌 Trade Idea:
– Look for 15M / 5M CHoCH or bearish FVG inside the golden zone
– Ideal sniper entry setup forming soon
– SL above 1.17043 or OB high 1.17692
– TP: Break of structure low and imbalance fill near 1.1450–1.1400
🧠 Bias:
– Order Flow is Bearish
– Strong IDM structure already mitigated
– We anticipate price will grab liquidity and reverse from premium zone
⛔️ Avoid early entries – let Smart Money give the signal. Precision = Power 🎯
#EURUSD #SMC #SniperEntry #SmartMoneyConcept #OrderBlock #GoldenZone #DCBFXTRADING
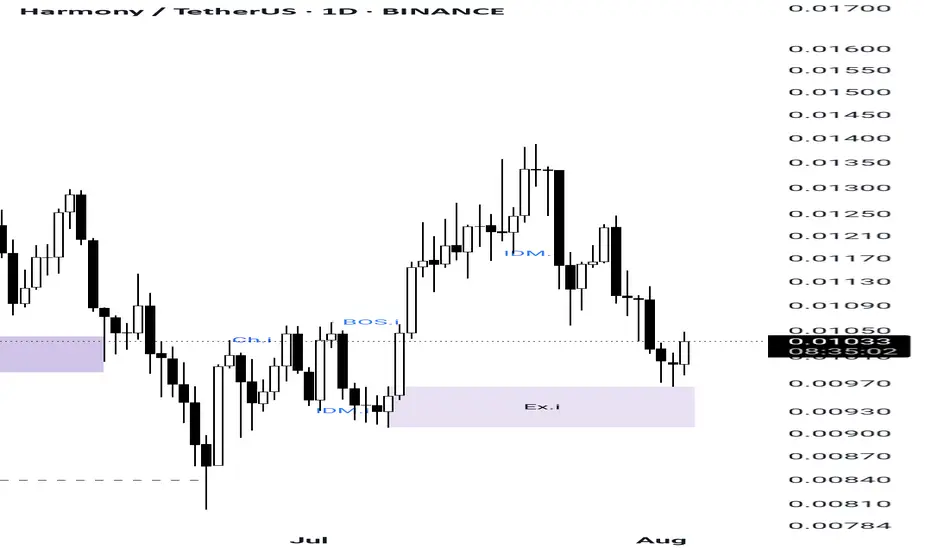
Harmony(ONE) is going to pump...As you can see in ONE Structure it made a minor structure and price touched its minor EX orderblock and for sure it made a SCOB confirmation
So now its ready to pump...
It's my own analysis and it's not investment advise , so DYOR
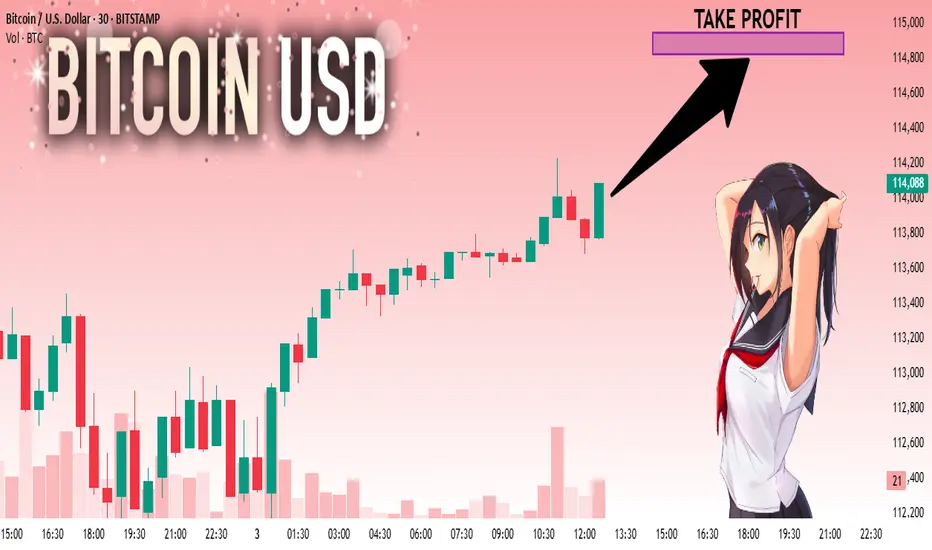
BTCUSD: Local Bullish Bias! Long!
My dear friends,
Today we will analyse BTCUSD together☺️
The market is at an inflection zone and price has now reached an area around 114,020 where previous reversals or breakouts have occurred.And a price reaction that we are seeing on multiple timeframes here could signal the next move up so we can enter on confirmation, and target the next key level of 114,821.Stop-loss is recommended beyond the inflection zone.
❤️Sending you lots of Love and Hugs❤️
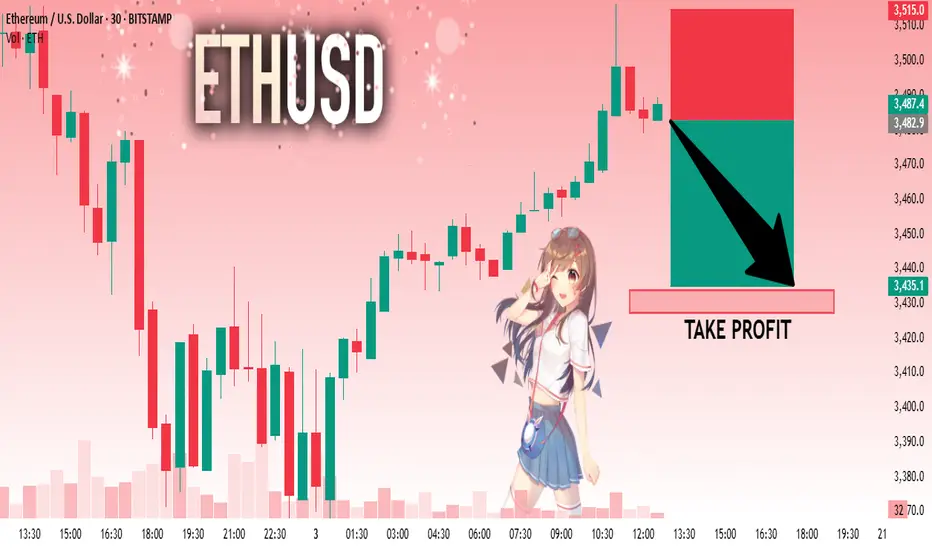
ETHUSD: Absolute Price Collapse Ahead! Short!
My dear friends,
Today we will analyse ETHUSD together☺️
The price is near a wide key level
and the pair is approaching a significant decision level of 3,482.9 Therefore, a strong bearish reaction here could determine the next move down.We will watch for a confirmation candle, and then target the next key level of 3,433.9..Recommend Stop-loss is beyond the current level.
❤️Sending you lots of Love and Hugs❤️
XAUUSD Weekly Outlook – August 4–8, 2025New Month. New Week. New Questions.
Will the market reward hesitation — or bold reaction?
Will POTUS pump price with policy noise, or will smart money fade the manipulation?
August is historically a quieter month for hedge funds — but don’t mistake silence for safety. It's also the time when the Fed retreats to Jackson Hole, reflecting and recalibrating. Will September bring another rate cut… or another twist?
Stay sharp. This isn’t a month to sleep on.
"Last week's game plan played out nearly to perfection — well, almost! Let’s dive in and break down where gold could be headed next week."
Gold kicks off August with a strong breakout above $3360, powered by a weakening U.S. dollar, rising global risk appetite, and persistent institutional demand. With Jackson Hole on the horizon and shifting Fed expectations, volatility is set to spike. The big question: will gold extend above premium, or retrace to rebalance?
After the last rejection near 3440, price broke cleanly below its ascending channel. Now, gold appears to be forming a potential lower high around the broken trendline — a rejection here could trigger a drop toward the key $3250 support zone.
🟡 XAUUSD – August Macro Outlook
💰 Price: $3362
📅 Date: August 3, 2025
📈 Bias: Bullish but extended — high in premium
🔸 Monthly Overview
📊 Trend: Bullish continuation (CHoCH April 2023)
🧱 Supply Zone: 3350–3439 → monthly wick trap
⚠️ RSI 80+, price nearing 100% Fib extension
🔮 Breakout above 3439 → 3505 / 3610 next
🔻 Rejection → pullback to 3270 / 3180
🔸 Weekly Outlook
💥 Structure: Strong bullish, EMA stack intact
🟥 Final HTF Supply: 3350–3439 (currently testing)
🟦 Demand Below: 3270 → 3215 → 3070
🎯 Targets if breakout: 3505 → 3560 → 3610
🔸 Daily Structure
⚔️ Now testing: 3355–3375 → last valid supply
🎭 Above that → internal trap at 3398–3412
🧨 Final ceiling at 3430–3439 — breakout or reversal?
🔸 H4 / H1 Key Zones
🟥 Supply: 3360–3375 / 3385–3398 / 3430–3439
🟫 Flip Long Zone: 3322–3310
🟦 Bullish Demand: 3285–3260 → 3222–3205
⚠️ RSI elevated, watch for reaction not breakout
🔹 Execution Plan
✅ Above 3439 → Expansion to 3505 / 3610
🔁 Pullback to 3325 / 3285 → Sniper long zones
🔻 Rejection from 3375 → Short scalp → Target 3320
📌 3439 = Key Monthly Pivot
🟢 Hold above → New expansion wave
🔴 Fail below → Retrace toward value
Extended:
🔸 Scenario 1: Breakout and Expansion
If bulls push through 3375 with conviction and break above 3439, gold enters a fresh leg of macro price discovery. This would activate a clean expansion path toward:
3405 (short-term extension)
3505 → 3560 → 3610 (Fibonacci projections)
3740 (full trend extension if momentum persists)
This scenario requires solid bullish confirmation, especially on H4 or D1 structure. Traders should look for LTF OB re-entries or bullish flags above 3350 to join the trend safely.
🔸 Scenario 2: Rejection and Retrace
If gold rejects from the 3360–3375 zone and fails to hold above it, a controlled retracement is likely. Key downside targets include:
3325 → first flip zone for re-entry
3285 → origin of the latest rally (strong buy zone)
3215–3180 → high-timeframe demand and imbalance fill
Only a breakdown below 3260 would threaten the bullish structure and shift bias toward neutral or bearish.
🔸 Conclusion
Gold is approaching its inflection point. The macro trend is intact, but momentum is stretched, and the market now demands clear validation.
📌 3439 remains the weekly pivot:
Above → Expansion toward 3500+
Below → Retracement to reclaim value
For next week, the most probable path is early consolidation inside 3360–3375, followed by a decisive reaction — either continuation toward 3405+, or a corrective drop toward 3325/3285 to reset structure.
Disclaimer: For educational context only.
#XAUUSD #Gold #SmartMoney #TradingAnalysis #SMC #USD #GoldOutlook

SILVER Move Down Ahead! Sell!
Hello,Traders!
SILVER is about to retest
A horizontal resistance level
Of 37.21$ and its a strong
Key level so after the retest
We will be expecting a
Local pullback
Sell!
Comment and subscribe to help us grow!
Check out other forecasts below too!
Disclosure: I am part of Trade Nation's Influencer program and receive a monthly fee for using their TradingView charts in my analysis.

NZD_CAD REBOUND AHEAD|LONG|
✅NZD_CAD has been falling recently
And the pair seems locally oversold
So as the pair retested a horizontal support of 0.8125
And made a rebound
Price growth is to be expected
LONG🚀
✅Like and subscribe to never miss a new idea!✅

GOLD CORRECTION AHEAD|SHORT|
✅GOLD is going up now
But a strong resistance level is ahead at 3377$
Thus I am expecting a pullback
And a move down towards the target of 3352$
SHORT🔥
✅Like and subscribe to never miss a new idea!✅
Disclosure: I am part of Trade Nation's Influencer program and receive a monthly fee for using their TradingView charts in my analysis.

EUR-USD Will Fall! Sell!
Hello,Traders!
EUR-USD will hit the
Horizontal resistance of 1.1620
On Monday after making a
Powerful move up on Friday
And as the pair is locally
Overbought a local bearish
Correction is to be expected
Sell!
Comment and subscribe to help us grow!
Check out other forecasts below too!
Disclosure: I am part of Trade Nation's Influencer program and receive a monthly fee for using their TradingView charts in my analysis.

BITCOIN LONG FROM SUPPORT|
✅BITCOIN has retested a key support level of 112k
And as the coin is already making a bullish rebound
A move up to retest the supply level above at 115k is likely
LONG🚀
✅Like and subscribe to never miss a new idea!✅
Disclosure: I am part of Trade Nation's Influencer program and receive a monthly fee for using their TradingView charts in my analysis.

NZD-CHF Risky Long! Buy!
Hello,Traders!
NZD-CHF keeps falling and
Will hit the horizontal support
Of 0.4738 on Monday from
Where we will be expecting
A local rebound and a
Bullish move up
Buy!
Comment and subscribe to help us grow!
Check out other forecasts below too!
Disclosure: I am part of Trade Nation's Influencer program and receive a monthly fee for using their TradingView charts in my analysis.

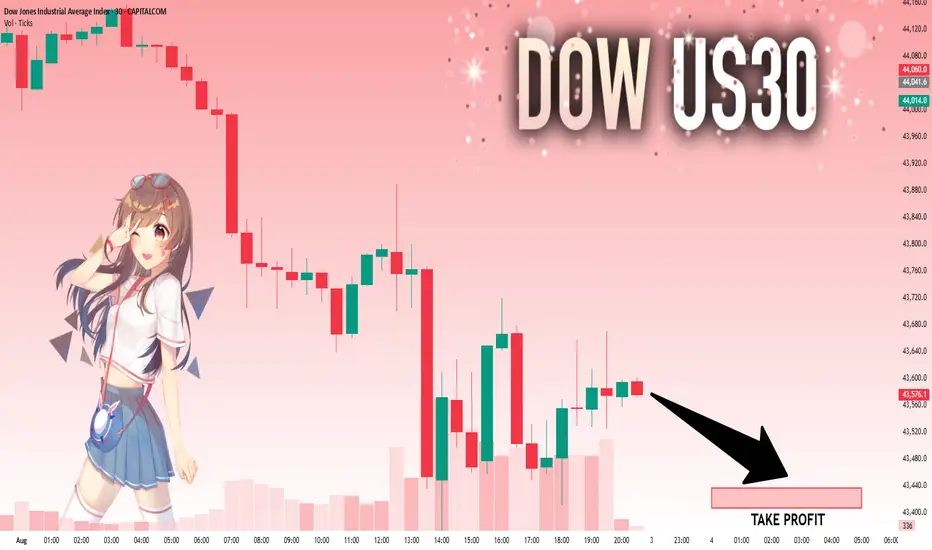
US30: Will Go Down! Short!
My dear friends,
Today we will analyse US30 together☺️
The recent price action suggests a shift in mid-term momentum. A break below the current local range around 47,577.1 will confirm the new direction downwards with the target being the next key level of 43,436.6 .and a reconvened placement of a stop-loss beyond the range.
❤️Sending you lots of Love and Hugs❤️