Week 11.03 - 11.07 Prep Last Week :
Last week we opened on a gap above Value and made a push over Edge top where we found our top and larger sellers for the week. Return to above VAL provided selling back into and eventually under the Edge. Holding under the Edge got us under MAs and changed the trend from uptrend to downtrend on 30m and 1h Time Frames, 2hr and 4hr frames only changed into correction without fully changing into downtrend. Holds under the Edge also provided good sells into lower VAH/Value for the gap fill towards end of the week when we got Month End profit taking but we were not able to fill the gap, instead we ran out of Supply Friday Midday and got end of the week short covering which drove price back out Value without filling the gap or staying in Value.
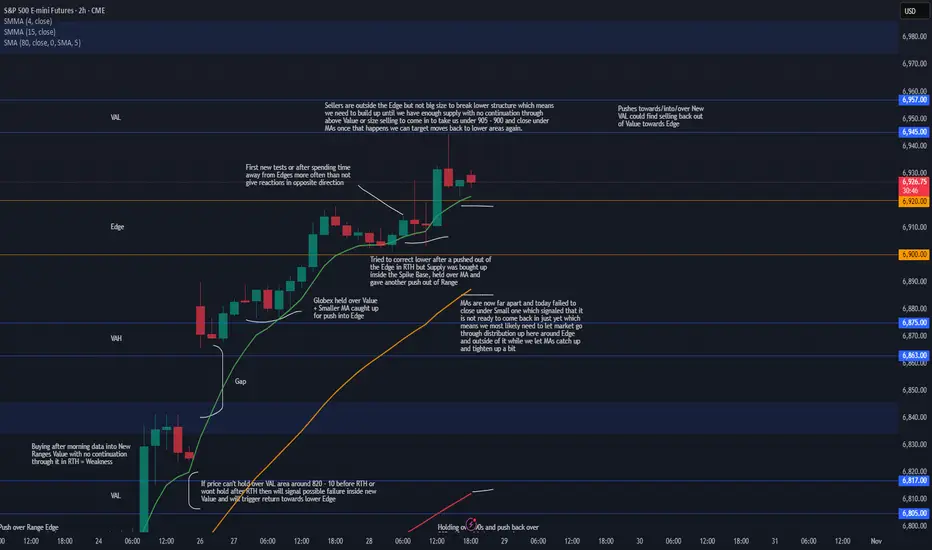
This Week :
So far this week we have again opened over Value and have been balancing between VAH and Edge in Globex, right now Edge again provided good sell back towards VAH and it may seem like it can continue selling but this will be the area to be careful at, at least to start the week as we are starting New Month, New week and it would be best to see what order flow we get, of course it is possible that we just continue lower right away but also this could be an area where we will see more covering above the Gap which can keep price over it and eventually once selling slows down could give another rotation towards/into and possible over the Edge.
As mentioned last week we are currently inside 915 - 875 +/- Intraday Range with 900 - 890 being its mean and price can stay within this range until it accepts under 870 - 65 areas without popping back over 75 then we know we have accepted in lower Intraday Range of 870 - 830 and can continue through its targets which would be 855 - 845 Mean area and down into/towards 830 - 20s. If we do hold this current range we are in then it is still possible that it will bring more buying as buyers like to start getting in once price holds which could still push us up towards/over the Edge and maybe even back towards above VAL, how far over Edge we get would be determined by order flow IF it happens but this will be the spots to be careful on the long side instead of getting excited for new ATH or continuation over previous one even if we take it out. Our bigger sellers will still be lurking over the Edge and closer to above VAL which means if we see a push out we could either see a quick or after consolidation return back under the Edge.
For price to change things back into stability or strength from here we would need a strong push over VAL with Medium/Larger MAs following behind us for support to be able to hold the price in/around new Value to show acceptance in New Hourly Range, unless this happens we have to keep thinking that top is in for now and look for return trips away from it which would make price want to return to previous Value.
If we do get strong selling continuation today/tomorrow through 70 - 65 and keep it under then of course we will go with that and keep targeting the Mean/Gap fill and push under the Mean but unless you see clear selling under 70 - 65 careful looking for too much continuation from here early on, it might take few days to decide what we will do and get ready for a good move into lower Value which maybe happen either from above the Edge or once we hold under it long enough and change trend on 2hr and 4hr Frames.
Snp500

Hellena | SPX500 (4H): LONG to resistance area of 7000.Colleagues, I believe that the upward movement is not over yet and at the moment the formation of wave “3” is taking place, but the chart shows a gap that should be closed.
Therefore, I believe that the price can go into correction of the small wave “4” to the area of 6823, but the priority is still the upward movement, as I believe to the resistance area of 7000.
Fundamental context
U.S. business activity strengthened in October: the S&P Global PMI rose to 54.8, indicating expansion in both manufacturing and services sectors.
However, uncertainty persists — business sentiment and export performance have weakened, while the partial government shutdown limits data visibility.
At the same time, the Federal Reserve is expected to continue rate cuts as the economy shows signs of slowing.
Manage your capital correctly and competently! Only enter trades based on reliable patterns!

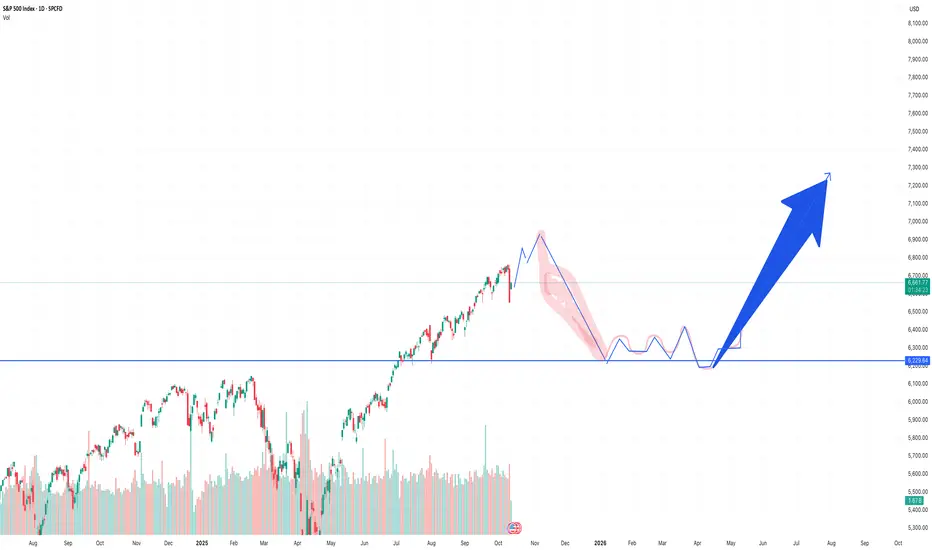
US Equities have this week left... only this week to be (divergently) bullish.
5 Nov or thereabouts should break down for three weeks.
26 Nov should expect a bounce, Santa rally into the 2026 New Year. 2026 looks terrible really...
Short sharp and sweet.
Take care!

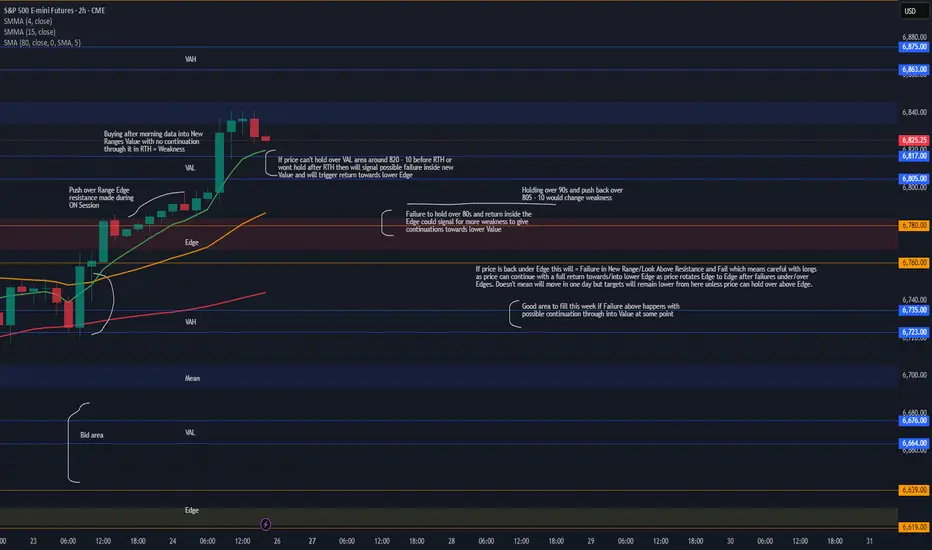
Week 10.26 - 10.31 Updated after GAPSunday Globex gapped up and held over Value which when MAs caught up gave us pushes into upper Edge. Edge areas often act as reversal spots on first tests or after we spend time away from them which it tried to do today but we had good enough buying inside the Spike Base and smaller MA which took in the supply and gave a rotation out of Edge, as we saw price got into VAL and reversed without holding.
There really is no reason for this gap over the weekend and pretty much everyone knows it will be filled but what market showed us today is that we are not ready to come in to start the process for gap fill yet, we have no size operating up here with it being Month End and FOMC tomorrow, FOMC may shake things up BUT we may need to let market balance some up here around Edge and out of it before we can build up the supply and at the same time let MAs catch up to tighten up some to give us a better correction back in.
For now we can see price hold in and out of Edge with pushes towards above VAL and maybe even pushes into/over it BUT careful looking for too much continuation into new Value as we have sellers over the Edge and MAs are far which means any pushes towards/into/over could find their way back out of Value towards lower Edge and eventually once we have enough supply or Volume we can see a push back into/under lower Edge that wont come back out and instead either continue or start holding under to start the process to move for lower targets. For that we would need to be under 905 - 900 area or be able to catch good entry above the Edge and ride it in once market is ready for that.
To see acceptance in this new Range and see more strength we would need to see Medium MA catch up and get over the Edge to provide better support when price pushes into new Value so that it can push in and hold around VAL, until then Small MA acts as Support but it is not something to build big positions on. For now I will be focusing on reversal shorts until market can hold under Hourly MAs and under Intraday VWAP to give better continuation trades lower, I will most likely avoid longs here as they are very choppy and by waiting for good short entries eventually one of them will be the one that will take us back under the Edge and maybe even continue into lower Value so want to be ready for it unless we see strength inside this new Range and good holds over around above VAL.
We have month end coming up and FOMC tomorrow, FOMC is always important but Month end might be more of a mover this time around, being at ATHs so far extended away from MAs on Daily and GAP below we could see profit taking last few days which could give us the pressure to head back under the Edge which would also take stops to add extra pressure for when everyone will be trying to get out so will be watching for that either after FOMC or Thursday/Friday.
Week 10.26 - 10.31 PrepLast Week :
Last week Sunday Globex opened up inside Value over all the hourly and daily MAs signaling trend change from Fridays ON Flush and RTH Return to Value. Price pushed outside of Value before RTH and we got a push into Edge Resistance area which then gave a two day consolidation that failed back into Value after build up instead of pushing higher.
Hourly/Daily MAs below provided support as we didn't have enough volume to change the trend, instead price again rotated over the MAs and grinded higher into Resistance. Thursday Globex price grinded over resistance on low Volume and held over key area which brought in more buyers with morning Data giving it a push into new Ranges Value where those buyers could sell the product. If we had strength in new range we would have continued with buying into RTH to push price at least over New Ranges Mean but instead we stalled and closed with a rejection away from the Mean to end the Day.
This Week :
Pushes which are made on low volume and in ON hours over/under KEY areas like range tops/bottoms especially if they proved to be good resistance/support areas previously are very likely to fail and return back at least to the initial scene of the crime which looks to be the area under 780s after Thursdays Close.
Of course anything can happen and price may hold/accept in new range and we can start building up inside it to then visit higher targets later but we have been seeing topping patterns in this areas at/under 800s for quite some time and this weak push over the resistance is something to be careful with as market may be ready for correction to our HTF trend to finally start after very long run up with this being sort of blow off top move.
We will have to see how the price will open/hold Sunday Globex but things are pretty straight forward from here, if we cannot hold over/around Smaller Hourly's MAs over 820 - 10 area into or after RTH then this will signal failure in New Value which can trigger next steps to show failure in New Range and from there step by step could trigger a move back for lower MAs, back into/under Edge and eventually we would target lower targets like VAL / Move Into Value, from there we have to be careful because IF we actually go through Trend Change on Hourlys up here this time around then what we could see is holds that may seem like support but with changed trend market could continue giving continuation/holds/continuations lower as Failure in New Range can trigger a return all the way back into Previous Ranges Lower Edge. Does not mean it will or will not happen in one week but will eventually get there as long as price holds under upper Edge.
IF this happens then I would also warn about trend changing for a bit longer than what everyone is used to already as we may target even lower correction areas but that is HTF trend change with HTF Targets I have recently posted Daily Outlook which shows those areas. Careful with slower down days as if trend changes we would still be getting buying/covering on the way down so it may not just sell off quick and instead have more of leak lower days unless there is high volume.
For us to continue with strength and show acceptance in this new range we either need to Open and continue holding/pushing through New Value or at least hold over 780 - 90s on pull back with any dips into it having strong reaction away which would take us back over 805 - 10 area if we don't get that then we need to expect weakness.
Hellena | SPX500 (4H): LONG to resistance area of 6777.Price made a sharp and strong move to the 6503 level, making wave “4” quite large, but this move did not break the structure.
I think that now the price is in the big wave "5" and middle wave "2".
I think that there will be an upward movement with the purpose to renew the maximum of the wave "3" of higher order.
Therefore, I expect the price in the resistance area of 6777.
Fundamental context
After the sharp drop, the market quickly recovered — investors are once again turning to risk assets amid growing expectations of upcoming Fed rate cuts.
Inflation data came out under control, and corporate earnings have been stronger than expected, boosting confidence in the U.S. economy.
With the dollar losing momentum and bond yields easing, the S&P 500 now has room to extend its move upward toward the resistance area near 6777.
Manage your capital correctly and competently! Only enter trades based on reliable patterns!

I could be wrong! Why stocks could go higher.Trading Fam,
It has been a whole year of testing my AI-crafted indicator, and I am learning to trust it more and more as I go. We recently reached my third and final target on the SPY. I sold. Did I sell too early. Possibly. If I was to wait for my indicator, I'd still be in long positions. Let's take a look at what my incredibly accurate indicator is telling us.
✌️Stew

SPY FREE SIGNAL|SHORT|
✅SPY is reacting from the all-time-high zone where institutional orders previously accumulated. A short-term retracement is likely as price sweeps liquidity above premium highs before rebalancing to the nearest fair-value gap. Time Frame 2H.
SHORT🔥
✅Like and subscribe to never miss a new idea!✅

SNP500 short uptick and quick downfallZeusExodus
As the marked upticks close to 7k levels it will drop about 10% that will mark the lowest point on July 11th.
Hellena | SPX500 (4H): SHORT to support area of 6646 .Colleagues, in the last forecast I was counting on price reaching the 6550 area, but that plan turned out to be a long term plan. I see the sense in making some shorter term targets.
The closest target I see is the 6646 support area, where wave “4” ends. This is a corrective movement, so it is necessary to realize that the price may continue to fall after reaching the target.
Fundamental context
U.S. inflation remains elevated — CPI rose to about 2.9 % YoY, with core inflation around 3.1 %. At the same time, the labor market continues to cool, and corporate earnings show mixed results. Combined with the Fed’s cautious stance and ongoing fiscal uncertainty, this creates pressure on the stock market.
Manage your capital correctly and competently! Only enter trades based on reliable patterns!

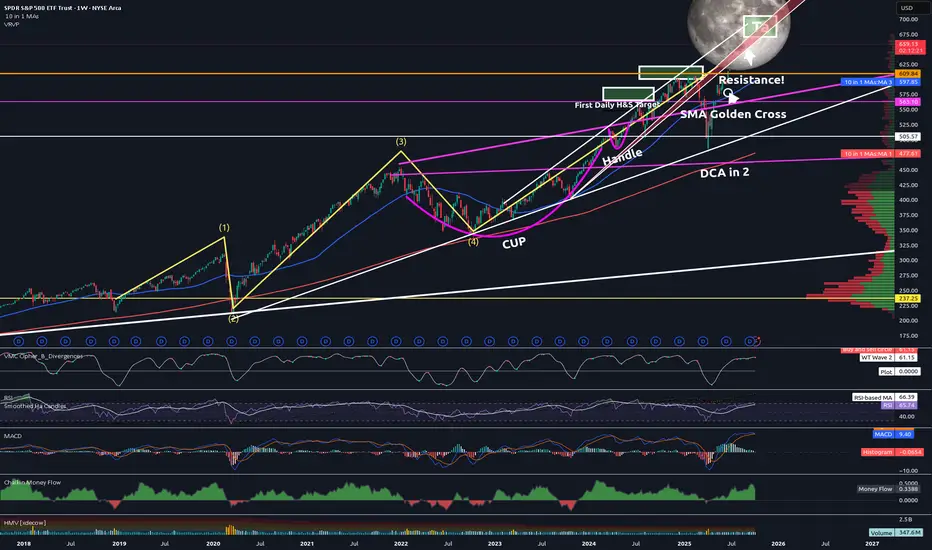
SPY Reaches 2-year Final Target #3 (670) and DropsTrading Fam,
I promised a video update this week. However, due to unforeseen issues with my streaming app, I have opted for a static post instead. Apologies but I'll go through updates on our chart, explaining where we are, and where we might be headed next.
We'll start here with the weekly. I want you to focus in on the yellow Elliot Wave pattern. All along I have stated that I am no Elliot Wave expert. However, I seem to have gotten it right this time ...at least so far.
The first wave starts around Dec. of 2018. We dipped harshly during COVID and that completed our wave (2). The third wave is often long and extended and we hit our top in Jan. 2022. Wave (4) then gave us our dip and the start of our Cup and Handle seen in pink. I don't know much but I do know wave (5) is often equal or greater than (3). I started looking for a final target for wave (5). My Cup and Handle soon offered that target to me.
So now let's zoom into the daily:
You can see Target #1 was nearly hit. You'll remember I sold here due to nearly touching that white uptrend. I waited for the dip back into support (RED) and re-entered focusing in on Target #2 which also coincided with price hitting that white trendline and being rejected. We bounced on that red support again and double-topped. This time we broke through our red support and came all the way down to another support which I expected to hold (white). It did. I then knew we were on our way to Target #3. But I've stated all along that I did not think we'd break back above that previous red support which now has become massive resistance. So far, I have been right. The Cup and Handle pattern also gave me that 670-700 target. Nailed that as well.
Could we go higher? Absolutely. That's what blow-off tops do. They often surprise the market with one final wild ride. Everyone piles in out of FOMO. And I have expected a final price of up to $700 SPY all along. Will this happen? Remains to be seen. But my experience has taught me that we are near the top. And since, I am satisfied with a price of $670 being that this is the beginning of my third and final target box, I pulled most of my personal money out a few days ago. My main goal now is to avoid greed and preserve capital. That is what I will do until the market tells me otherwise.
I want to take one final look at our monthly chart:
See that thick white trendline that starts in 2009? That is the beginning of our secular bull market. This next part is going to sound insane but that is often the case when you read what I write, we could technically drop all the way down to SPY 300, over 55% from where we are right now, and STILL be in a bull market! Can you imagine how many traders will start to scream that the world is ending? And yet, technically the market will remain bullish. Crazy to think about, but definitely worth noting.
✌️Stew
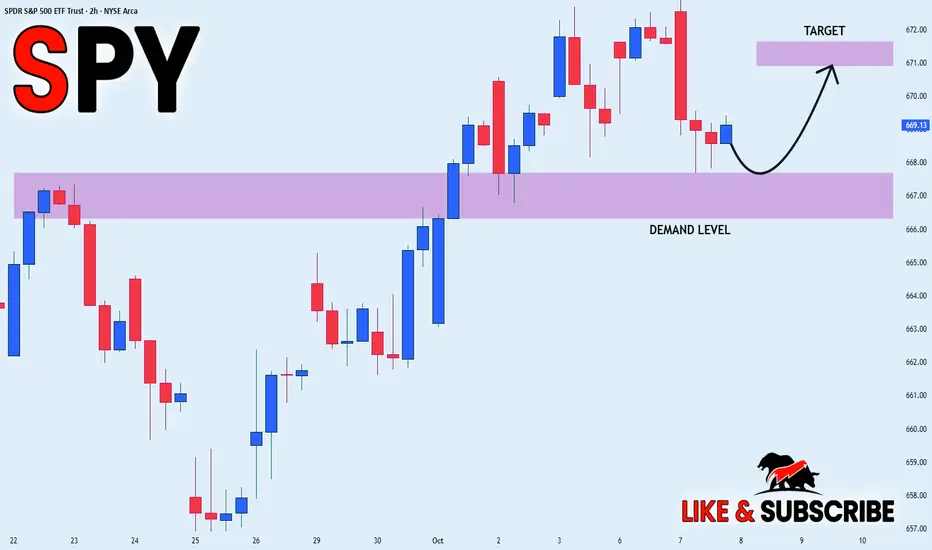
SPY STRONG UPTREND|LONG|
✅SPY showing a strong bullish structure with clear rejections from the demand level. Price continues to form higher lows, confirming institutional support and momentum toward the 671$ target zone. Time Frame 2H.
LONG🚀
✅Like and subscribe to never miss a new idea!✅
SPY MONEY PRINTER GO BRRR|LONG|
✅SPY with the FED lowering rates, liquidity injections perspective fuel risk assets. Price has broken out above the key level, signaling bullish order flow. SMC outlook suggests momentum could push into new all-time highs as money printer effects unfold. Time Frame 1H.
LONG🚀
✅Like and subscribe to never miss a new idea!✅

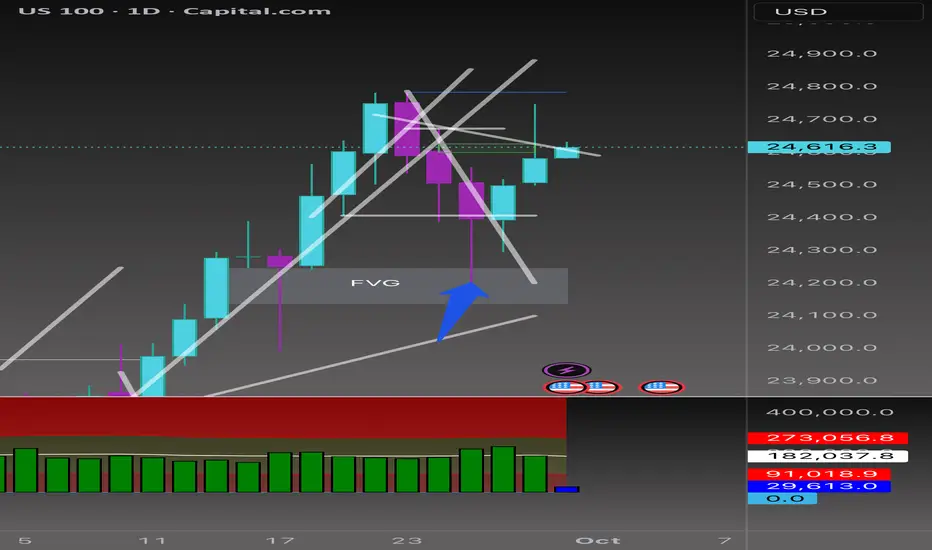
Beyond the Chart - NAS100 Through Technicals & FundamentalsCAPITALCOM:US100 The trendline I drew on the lower timeframe yesterday worked perfectly, and price is still respecting it. We did see a break, but right after that, a Bearish FVG and a Breaker Block formed. This trendline will remain my pilot line for analysis.
NASDAQ Daily Analysis 📊
On the daily chart, the FVG formed on Sep 15th has been revisited, but price couldn't hold in this zone and was quickly rejected. The trendline I've drawn is still active and guiding the move.
⚡️Volatility note: Daily volatility is starting to compress (blue print on my model), meaning the next breakout move could expand strongly. If price breaks above the trendline with momentum, buyers may look beyond 24,650 toward 24,720–24,800 before reevaluating. If rejection holds, compressed volatility could fuel an accelerated drop into the 24,520 → 24,440 FVG zone, and possibly 24,300.
🦖 If a bullish candle closes back above the trendline, I’ll be looking at 24,650 as a buy trigger. A confirmed break here could open the door toward 24,720 → 24,780 liquidity levels.
🐼 If sellers keep control below the trend, downside targets remain at the FVGs around 24,520 → 24,440, and potentially 24,300 (Discount PD Array).
⚡️ Bottom line:
Today’s US data (Chicago PMI, JOLTS, Consumer Confidence) + multiple FOMC speeches will likely decide direction.
📉 Hot data or hawkish tone → sellers push deeper.
📈 Softer numbers or dovish Fed comments → bulls may retest higher levels.
Hellena | SPX500 (4H): SHORT to support area of 6550.Colleagues, I am not much of a correction trader, but I have to share my opinion that the upward impulse has almost formed wave “5” and now it would still be logical to expect a correction.
I believe that first the price will update the local maximum in the resistance area of 6759, then we will see a correction in wave “4”, which I expect to see at least in the support area of 6550.
Manage your capital correctly and competently! Only enter trades based on reliable patterns!

Hellena | SPX500 (4H): LONG to resistance area of 6700.Colleagues, I think we should expect the upward movement to continue. The upward impulse is not over yet, but I think we may see a correction to the 6500 area, then I expect the upward movement to continue to the 6700 area, which is a pretty strong psychological level and is the area of 50% levels of Fibonacci extension.
Manage your capital correctly and competently! Only enter trades based on reliable patterns!

S&P 500 Index (SPX) Weekly TF – 2025
Chart Context:
Tools Used: 3 Fibonacci Tools:
1. One **Fibonacci retracement** (from ATH to bottom)
2. Two **Trend-Based Fibonacci Extensions**
* Key Levels and Zones:
* **Support Zone** (Fib Confluence): \~4,820–5,100
* **Support Area (shallow pullback)**: \~5,500–5,600
* **Resistance & TP Zones:**
* TP1: **6,450** (Fib confluence & -61.8%)
* TP2: **6,840** (-27%)
* TP3: **7,450–7,760** (Major Confluence)
Technical Observations:
* SPX is approaching a **critical resistance** near previous ATH (\~6,128) with projected upward trajectory.
* The **green dashed path** suggests a rally continuation from current \~6,000 levels to TP1 (\~6,450), TP2 (\~6,840), and eventually TP3 (\~7,450–7,760), IF no major macro shock hits.
* The **purple dotted path** suggests a potential retracement first to \~5,600 (shallow correction) or deeper into \~5,120 or even 4,820 zone before continuing the bullish rally.
* The major support zone around **4,820–5,120** includes key Fib retracement levels (38.2% and 61.8%) from both extensions and historical breakout levels.
Fundamental Context:
* US economy shows **resilience** amid soft-landing narrative, though inflation remains sticky.
* The **Federal Reserve** is expected to cut rates in **Q3–Q4 2025**, boosting equity valuations.
* Liquidity expansion and dovish outlook support risk assets, including **equities and crypto**.
* However, **AI-driven tech rally** may be overstretched; a correction could follow earnings disappointments or macro surprises (e.g., jobs or CPI shocks).
Narrative Bias & Scenarios:
**Scenario 1 – Correction Before Rally (Purple Path)**
* If SPX faces macro pushback (e.g., high CPI, hawkish Fed), expect retracement to:
* 5,600 = Fib -23.6% zone
* 5,120–4,820 = Major Fib Confluence Zone
* These would act as **accumulation zones**, setting up next leg up toward TP1 and beyond.
* **Effect on Gold**: May rise temporarily due to risk-off move.
* **Effect on Crypto**: Could stall or correct, especially altcoins.
**Scenario 2 – Straight Rally (Green Path)**
* If Fed confirms cuts and macro remains soft:
* SPX breaks ATH (\~6,128)
* Hits TP1 (\~6,450), TP2 (\~6,840)
* Eventually reaches confluence at **TP3 (7,450–7,760)**
* **Effect on Gold**: May struggle; investor preference for equities.
* **Effect on Crypto**: Strong risk-on appetite, altseason continuation.
Indicators Used:
* 3 Fibonacci levels (retracement + 2 extensions)
* Trendlines (macro and local)
* Confluence mapping
Philosophical/Narrative Layer:
This phase of the market resembles a test of collective confidence. Equity markets nearing ATHs while monetary easing begins reflect a fragile optimism. The Fibonacci levels act as narrative checkpoints — psychological as much as mathematical. Will we rally on faith or fall for rebalancing?
Bias & Strategy Implication:
Bias: Bullish with caution
* Strategy:
* Await **confirmation breakout >6,128** for fresh long entries
* Accumulate on dips in the **5,100–5,500** zone if correction unfolds
* Use **TP1, TP2, TP3** as staged exits
Related Reference Charts:
* BTC.D Analysis – Bearish Bias:
* TOTAL:Bullish Bias
*TOTAL3 – Bullish Bias:
* US10Y Yield – Falling Bias Impact:https://www.tradingview.com/chart/US10Y/45w6qkWl-US10Y-10-Year-Treasury-Yield-Weekly-TF-2025/

Hellena | SPX500 (4H): LONG to resistance area of 6600.Colleagues, the main idea is still the upward movement in the impulse of the middle wave “5”.
Wave “4” is likely to take place, because the bulls need to gain strength to update the local maximum of 6512.
The most important thing here is that the target of 6600 is a round number, which is quite attractive for buyers and limit sellers.
Manage your capital correctly and competently! Only enter trades based on reliable patterns!

XAUUSD BreakoutAfter a strong rally up since the beginning of the year, Spot Gold struggled to breakthrough $3,425 for the last 129 days. However, since the beginning of the week Gold broke through that level surging +4.3%.
Seeing Gold continue to rally alongside the stock market, both of which at all time highs despite typically having an inverse relationship.
With M2 money supply ever growing, rate cuts continuing and acceptance of higher levels of inflation there is plenty of fuel to keep this move going no matter how unnatural it feels. Gold typically thrives in risk-off environments but this year has seen huge progress.
Now Gold has entered price discovery it's about riding the wave of momentum caused by the breakout. Should Gold turn around and get back below $3,425 there is potential for worry, a SFP confirmation is bearish. A retest of $3,425 as support with bullish continuation is a more comfortable hold.

Us30 longU30 forms a spring on the 4hr.
The general market is bullish on the daily, so underlying conditions are on our side, I can't stress enough the value of that,
So far, setup looks A+

Hellena | SPX500 (4H): LONG to resistance area of 6596 .Dear colleagues, I haven't made a forecast for the SNP500 in a long time and was waiting for a correction, but it seems that a major correction is not yet close, and at the moment the price continues to be in an upward five-wave movement.
Therefore, I believe that we should expect to reach the 6596 area, which will mark the end of the medium-term wave “3.”
The corrections are not very deep at the moment, but the price may reach the 6317 area before continuing its upward movement.
Manage your capital correctly and competently! Only enter trades based on reliable patterns!

SNP500 ShortThis is against the H4 trend; however there is very good resistance at this level, as it is the all-time high and contesting the previous week's high.
There is a pattern on M15 to show a potential reversal zone.
Multiple tops on M15 to H1 with divergence and showing the trends flattening out.
This is against the trend so look to get out at M15 oversold

SPY Long From Rising Support! Buy!
Hello,Traders!
SPY is trading in an
Uptrend along the
Rising support and we
Are already seeing a
Bullish rebound from
The line so we will be
Expecting a further
Bullish move up
Buy!
Comment and subscribe to help us grow!
Check out other forecasts below too!
Disclosure: I am part of Trade Nation's Influencer program and receive a monthly fee for using their TradingView charts in my analysis.
