Combined US Equities - Critical Support Line BROKEN DOWNJust yesterday, the line was drawn and by the close of the day/week, it was done... the line broke with a close below.
So, zooming out into the weekly charts, and we see the TD Sequential starts for a Buy Setup (means bullish till end of Setup). Projecting a simple waterfall scenario brings US equities down to target at the TDST, and meeting a confluence of several support levels.
Noted MACD crossed down as is RoVD tapering down too.
This is the simplest straight line outcome.
Alternatively, might see a weak bounce for a lower high on the weekly charts and then the cliff fall in mid- to end-February.
Just need to know, then decide what to do.
On a seperate note.
The First 5 days of the trading week of January is part of the January Barometer where how January closes is how the year goes. and this ended DOWN.
Now, if January is ending DOWN as well, then you decide how 2025 is ending most likely.
Already obvious 2025 is challenging till September.
Watch for it and be wary.
All the best!
Snp500

SPY Next Move UP! Buy!
Hello,Traders!
SPY is trading in a long-
Term uptrend and the
ETF is now about to retest
A strong horizontal support
Level of 584$ from where
We will be expecting a
Local bullish rebound
Buy!
Comment and subscribe to help us grow!
Check out other forecasts below too!

Combined US Equities - Critical Support Line drawnAs expected, not a good finish, not a great start.
Now, a potential trend change pattern might be forming. This pattern has a series of two of each Lower Highs (LH) and Lower Lows (LL). With that criteria fulfilled (LL 926 and 925.75), the Critical Support Line can be drawn at 925.75.
A breach and breakdown to close below 925.75 is likely to send the US equities market reeling over and down the cliff. This is the trend change pattern that is very reliable.
Noted that the RoVD indicator has crossed below the zero line, bearish.
Watch the Critical Support Line, and the TDST lines now...

#ES_F Day Trading Prep Week 1.05 - 1.10.25Last Week :
Sunday Globex opened inside VAH of 6054 - 5933 HTF Range after a Friday failure over upper Edge. Failures over/under HTF Edges usually provide good reaction back to previous Value and Edges which is what we got to start the week as we got a move from VAH to VAL and pushed out to tag lower Edge but the whole move pretty much happened during pre market hours so when we opened up we didn't get continuation, instead we got balancing/covering with weakness since we had supply that was coming out from above, we balanced most of the week between the lower Edge and Value of the range until we built up enough supply to flush it through the Edge, the sell through was strong but we only had enough supply to tag lower VAH where buying came in to push us back inside the Edge. Since it was end of the week we expected more covering to be done, since the Edge held pre market without any more size selling that brought in more covering and momentum buying to push back into our current HTF Ranges Value to close the week.
This Week:
Last weeks close may seem strong but we have to keep in mind that currently our structure is going through a change on higher time frames, for now Daily is slowly transitioning into a possible longer correction after failing and building supply over the Daily Edge which was 640s - 70s area ( Remember Failures over Edges bring us back to Value AND could target previous Edges, since its daily it can take time to get there but Daily VAL is 846 - 28 and Daily lower Edge is 754 - 24)
We are holding under Smaller and Bigger MAs and they are getting closer for a cross which will be signaling a correction lower, seems like this time around we are in for a longer/slower correction that can take time to play out and time to end. Last few weeks with failures over the Daily Edge we have been getting moves back to Daily Value and going back and forth between it's VAH and Mean areas with dips under the Mean that were bought.
Daily VAH is around 987 - 67 Area and going into this week if we can't show stability over it by holding over/between 5993 - 6007 areas and get tests at/over above VAH then we would look for price to return under the VAH back inside 973 - 932 Intraday Range and possibly start holding under Daily VAH.
Lower Edge 993 - 913 may provide enough support for us to continue balancing over it but we have to keep in mind that holding under current HTF Ranges VAL and building more supply at/over the Edge can bring in more weakness and if we get through Intraday area of 932 - 27 with more supply above that can give us sells towards lower VAH again and possibly this time around we can try to get inside lower Value again, we have swing stops to watch out for under 850s which if taken could provide more selling towards lower VAL and possibly moves out of it IF we will have enough supply.
We do have that area of 800 - 750 and next Edge below us which was our distribution balance for some time at one point, so we have to watch out what we do that as we may hold above it or price may want to try and get inside it again as that is an area where it found balance before. Of course all of this we have to watch area by area for continuation as we may keep getting buying at and under current Edge but things are set up for these moves if we want to go at least for lower Value but we MUST take out key areas for any continuation as price may find balance around current Value and stay in this range if we are not ready to move yet.
For price to remain stable we would need to be able to hold inside current Value without getting back under VAL that could keep us stable enough to balance inside the Value in current intraday range of 6018 - 78 which so far we haven't showed acceptance in, and for any strength beyond that we would need a strong push over above VAH and hold over it to start building new cost basis, even if we get moves to or over current VAH it's a place to be careful as we can keep seeing sells from there back inside Value.

Weelky Leading Indicators are NOT BullishThe Weekly Leading Indicators have had broken into Bearish mode.
SG10Y have broken up of a trendline
TIPS and TLT have broken down support
JNK similarly broke down of support
The combined US Equities weekly chart are at an indecision range, but daily chart analyis tells of a more bearish story.
SOXL is holding up somewhat though.
So while all 4 Leading Indicators are red flagging.
The Indices have yet to respond.
Watch for it... and be careful.
Happy New Year 2025!

Combined US Equities - not nice end, not expecting a great startQuick analysis of the Combimed US Equities daily chart...
A significant rebound last week put the closing back into the decision box. Thing is, it went out the other end, as expected it would, BUT ended with a doji (indecision candlestick) and came back into the box... which suggest an exit to thru the lower end. This is abou to happen over the last days of the 2024.
And IF it exceeds the last low, then it is a tell all that 2025 is not going to be bullishly exciting.
In any case, a good retracement is overdue and likely comes in 1Q2025
Technicals here show weakening MACD and a decelerating rate of VolDiv.
Let's see how bullisht the first day of 2025 and the first week of 2025 can be... not terribly optimistic IMHO.
In any case... HAPPY NEW YEAR 2025 everyone!
Stay safe and stay happy!

#ES_F Day Trading Prep Week 12.22 - 12.27/24Last Week :
Last week we had contract roll and Fed week, for over 2 weeks price kept holding around/over 6074 - 54 HTF Edge which also happened to be Daily Edge as well which makes it a significant area. We kept holding at/above it but we would not get any pushes or acceptance inside new Value and instead we kept seeing sells from every push attempt into new VAL. Contract roll came again giving us a gap in prices which put new contract inside the Value of new HTF Range where we were able to balance while waiting for the Fed. After the Fed announcement we got a sell down towards the lower Edge and filled the Roll Gap we created, but we also took out the Edge fully which had over 2 weeks of Supply built up over it and it caused more aggressive selling which gave us a HTF Edge to Edge move to finish up that Day which put back in 6074 - 5913 HTF Range where we have previously found acceptance in. Thursday we didn't get continuation under the Edge, instead we had selling from Ranges Value which closed right into the Edge. Friday Pre-Market price got under the Edge and made a push for lower Value but we didn't quite make it to take the swing stops which were under 5860s and instead we ran out of supply, rotated back above accepted Ranges Edge and pretty much got short covering before the weekend/holidays to take us all the way back up to the upper Edge where we failed under with price settling back inside Ranges Mean.
This Week :
We have last week of the year pretty much, Holidays coming up and we had some crazy moves up and down last week that gave us big ranges after we spent quite a bit of days going back and forth inside smaller ranges, so what can we expect this week ?
It could definitely be a tricky week, as there are always chances for more continuation to the downside, chances to keep rotating higher so we have to be on the look out, but from what structure and price so far is telling us is that we have found acceptance back inside 6074 - 5913 HTF Range, we are back under Daily Edge with Supply still above us, with shorter Holiday weeks coming and end of year, will we get more crazy action or will things possibly slow down again as we will have much fomo from the flush down and from the rally up that was probably missed by many. Price is currently back inside 6023 - 5973 Intraday Range where it found some balance before, IF we don't get the volume selling or buying then we could see price to balance inside/around this Intraday Range and stay around this current HTF Ranges Value, after failing at VAH we could still target moves towards VAL and if there is enough Volume we could even see it try to push out of VAL but we have to be careful because if we don't find acceptance on pushes over VAH or under VAL then we could continue seeing price come back inside the Value and continue balancing around it. Careful for ranges to become smaller again which means its not time to be greedy and focus on good entries and smaller profit targets.
If we do get acceptance over or under the Value we would need to see good moves into or through the HTF Edges for us to see attempts to move into different Ranges Values.

SG10Y SG Govt Bond Yield UNCANNY heads up on US EquitiesHere is a rehash of the relationship between the Singapore 10Y Govt Bond Yields and US Equities ETF, SPY (Blue Line).
Noted that when the SG10Y technically breaks out, the SPY technically breaks down, and vice versa.
This is not 100% but happens an estimated 80% of the time, and recent occurences since September are marked out with bullish green or bearish red time lines, respective to SPY from the SG10Y leading indications.
Just middle of this past week, the SG10Y spiked strongly and broke out, the next day saw the SPY tank significantly. In fact, the MACD for the SG10Y had already pre-warned of the breakout two days earlier!
Given the current set up, as usual, I do my technical and charting projections. And in this case, it is clear that the Santa rally fizzled, year closign and next year opening should be weak until early February. Now, if this projection works as it should, then we would likely see a weak 2025 for the US equities... not only to take profit, but also offers opportunities to buy in at some point.
(side note: as far back as 2020, 2025 was marked as the year of some resurgence of affliction from the neck upwards. It is a little sketchy, but it would very well be the surprise to tank the markets enough... watch for it)

Weekly Indicator Panel WARNED last weekend...ALL Red Flags already, as warned by my panel of leading indicators.
You would see that all threshold have been triggered and are clearly red flags IF the week closes at current levels. The week has not ended, but it appears bad enough.
There should be an attempt tp recover somewhat, but overall appears that Santa Claus might crash this rally this year. Furthermore, the year end and year start are keen indicators of the year ahead as well... so watch closely.

Hellena | SPX500 (4H): Short to support area 5846.5.Colleagues, I assume that price is completing a five-wave upward movement. I believe that the price may reach the resistance area of 6181.6 then I will consider only downward movement in correction to the area of 5846.5.
It is possible that the price will immediately start moving towards this area, but this is a more risky plan.
Still, I would like to see the completion of all waves “5” in one place!
Manage your capital correctly and competently! Only enter trades based on reliable patterns!

Is the financial system entering a new era?This chart is one of the clearest and most striking indicators of the S&P 500 and Monetary Expansion around the world on a monthly basis.
Is history repeating itself or is the financial system entering a new era ?
Markets are rising again after the Mortgage Real Estate Crisis in 2008 and the Covid-19 Pandemic in 2020. But what is behind this rise? Could the fact that the S&P 500 has held its value while the money supply has skyrocketed be a harbinger of a new growth cycle?
What is remarkable;
In the 2008 Real Estate Crisis, this ratio, which had been steadily moving above the trend line, was pulled down sharply and trapped below the trend line. For many years, there was an invisible pressure to maintain the trend below this line.
Whenever the trend line started to be tested again, this rate was pushed down again by the Covid-19 pandemic in 2020 .
January 2024 is a historic turning point;
It managed to rise above the trend line after exactly 16 years and entered a steady uptrend. This development sends strong signals that a brand new economic order has been established in the world.
So what happens now?
After testing a new ATH level , what crisis or crises await us in the markets? Or is the financial system heading for a completely different course from the historical scenario this time?

Unity recapturing previous supportUnity is re testing its time tested support downside liquidity is captured its time to shoot up!
Dyor..

SPX Long in Long term to $5050, the up to $6060On the basis of previous cycles analysis.
S&P 500 index is now in the 1st wave of the new growth cycle. Technically and fundamentally now I expect the downside to $4200, but not for long.
After this SPX is going to reach the $5050 price level.
Then after 2nd wave correction (10%) 6 month before US President election SPX starts its 3rd wave up to $6060.

#ES_F Day Trading Prep Week 12.08 - 12.13.24Last Week :
Last week Sunday Globex opened with a sell from the Edge towards VAH of lower HTF Range but we didn't have enough selling to get back into Previous Value where we have seen acceptance in previous week, instead we held over 6030s and pushed inside the Edge, as noted from last weeks prep to see higher prices we needed to stay around the Edge and hold over 6050s, I was thinking that this 6074 - 54 Edge would keep the price in but instead we were able to hold the Edge, got a failed breakdown from it on Tuesday RTH and a Wednesday Globex push over the Edge which couldn't get back inside during RTH Open, this move put us in new HTF Range and inside 6065 - 6115 Intraday Range. We finished the week with some sells from above VAL area and price holding above the Edge around VAL.
This Week :
As noted last week price action has changed, Volume has died out and it is really time to tighten things up and lower expectations from moves until we see new change. Going into this week we are inside 6070s - 6200s +/- HTF Range, we have buying over the lower Intraday Range and over HTF Edge, we have selling at VAL and so far attempts to push into above Value are not strong enough to give us a good break and hold over instead they find profit taking on every push. Holding over lower Edge implies stability and price can continue balancing over those areas, we can't expect too much selling from here unless we can get back under lower Intraday Edge and find Volume to get under 6050s, but we also have to be careful on the long side as we are now in distribution at higher prices on lower volume which means buyers don't have to keep chasing price up too much higher just yet. We could see price to continue holding and grinding around this new VAL area with attempts to push into new Value, inside the Value we have to be careful as until we accept inside its Mean and start transacting over it then we could continue seeing the price hold under the Mean and come out of Value towards VAL/under. I would watch for possible balancing in these 6090s - 6120s areas until we show acceptance over/under that would want to continue over the Mean or stay under lower Intraday Edge.

#ES_F Day Trading Prep Week 12.01 - 12.06.24Last Week :
Last week market opened up inside the Value of this 930s - 650s HTF Range, beginning of the week we were able to stay around the Value and balance inside this 620 - 970s Intraday Range with pushes out of Value that got sold back in. Wednesday again opened over Value and sold back in with RTH Volume but closed right under VAH to finish regular trading week. Shortened holiday sessions didnt have much supply so we were able to hold over VAH which build up stops that got squeezed in upper Edge once end of week covering came in on Friday.
This Week :
This is technically the first tag of this new HTF Range Edge since our first push towards it failed just shy of it. More often than not first tests of big areas like an Edge provide a reaction in the oppositive direction, of course we could say the push that gave us selling from this area the first time was it and that this time we may hold long or continue but because this move was during shortened holiday sessions we need to watch out with looking for continuation from here unless market can hold over 640s - 50s, stay around/inside the Edge AND get through 670s with Edge top and start holding over it. Until this happens I would be looking for us to either try and balance around this Current Intraday Range of 620s - 670 which we pushed into Friday or if the buying just pushes us up during lighter volume days and wont stick come next week then we can see a move back towards VAH and if we can't hold over it then its possible to see continuation back inside the Value/Mean and if we have enough supply a push for lower VAL.
We have HTF stops built up there under 970s if that area gets taken it could bring in more selling to give us an Edge to Edge move from bottom to the top, if we can't take the stops at VAL then we could continue to balance inside this Value building Supply.
This is new month and last month of the year, will we start our first week with a sell towards the buyers who are under 940s or do we have enough buying to give us a hold over Value and try to test new one ?
On Daily TF we are still inside a 5720s - 6070s Range and currently we are inside Daily Edge, if we can't get through it then possible return towards Daily VAH which is in 980 - 60s Area.

SPY Bullish Continuation Ahead! Buy!
Hello,Traders!
SPY made a bullish
Breakout of the local
Horizontal level of 600$
Which indicated a bullish
Sentiment prevalence
On the market so we
Are now bullish biased
Locally and we will be
Expecting further growth
Buy!
Comment and subscribe to help us grow!
Check out other forecasts below too!

SPY WILL KEEP GROWING|LONG|
✅SPY is trading in an
Uptrend and the etf made
A bullish breakout while trading
In an uptrend which reinforces
Our bullish bias and makes
Us expect further growth
LONG🚀
✅Like and subscribe to never miss a new idea!✅

Daily Leading Indicators looking to turnaround PReviouslyly posted about the Bearish outlook for the Weekly :Leading Indicators... now it appears that Monday is giving the Daily Leading Indicators a new outlook.
A possible Bullish turnaround...
Breakdowns and Breakouts observed.

S&P500 (SPY) Hits Target #2 Today!Traders, though we've still got a ways to go to our final target of 670-700 on the SPY, it is worth celebrating our direct hit of 600 today. I remember a year ago drawing out 563 as a first target for our blow-off top and I was laughed at. Bears were in their mood and hungry. They wanted more blood. But a combo of our Elliot Wave and a daily inverse head and shoulders showed us exactly where we would hit.
Then I spotted this nice cup and handle on the weekly. If you remember, it was almost invalidated with that China carry trade flash crash. But I stood my ground and stated that we would need to see another weekly open and close below our neckline before the bet was off. That did not happen and we are well on our way to that 670-700 final target. However, before we get there, I do believe our 600 level on the charts will provide some psychological resistance. Admittedly, this was more of a guess than anything when I had drawn it up and placed it on my chart several weeks ago. But now, we are seeing overbought conditions on both the daily and weekly charts. Are we a bit over-heated? I think we may be and should be prepared to see a bit of a drop, or at least a week or so of sideways price action, before we break 600.
Unlike my first target at which I sold and buy the carry trade dip for massive profit, I don't know that I will be selling here. 600, as I stated already, was more of a guess than anything. But I am pretty decent at making these guesses. Experience and lots of psychology and chart study has taught me. Before I get ahead of myself though, let's watch and see what the market decides to do next week.
✌️ Stew

#ES_F Day Trading Prep Week 11.24 - 11.29.24Last Week :
Sunday Globex opened and held over lower ranges Value which put is in this 940 - 880+/- Distribution Balance, holding under 930s Edge kept giving us weakness into lower VAH but Tuesday Pre Market move into Value failed after tagging the Mean, prices were able to hold and climb back over the Edge which brought stability and more buying to close things up with a push/hold inside above Value.
This Week:
We have a tricky week coming up as we have End of the Month Week, Holiday, Supply inside and above current Value and buying/cost basis that we built up under 940s. This could lead towards slower back and forth trading inside/around this Value. Probably not a week to push for too much continuation on either side and maybe watch for smaller ranges. We are now inside 970 - 620 Intraday Range and if we have enough supply around/above it and buying under that could keep the price balancing around it. Unless volume comes in to knock us back down under VAL and can get us under 940s or make a push over 620s and start holding over 630+ then id be careful on holding too long or looking for big moves on either side, might be more of consolidation choppier trading.
On Daily TF we have again made a move under Smaller MA, made a push for but no tag of anything bigger under and popped back out to finish the week, we may require more sideways action in this current HTF Range of 930s - 650s +/- Before we would be ready for any bigger corrections and this could take time to set up, and of course we arent looking for much higher prices unless we can built up under above Edge and get a good push through it with a hold without coming back in. Time to be careful and tighten up.

SPY WILL KEEP GROWING|LONG|
✅SPY is already making a
Bullish rebound from the
Horizontal support level
Of 586$ while trading in
An uptrend so we are bullish
Biased and we will be
Expecting a further move up
LONG🚀
✅Like and subscribe to never miss a new idea!✅

SPY Long From Support! Buy!
Hello,Traders!
SPY is trading in a strong
Uptrend an the index is
Already making a bullish
Rebound from the local
Horizontal support below
At 584$ which reinforces
Our bullish bias and makes
Us expect a further move up
Buy!
Like, comment and subscribe to help us grow!
Check out other forecasts below too!

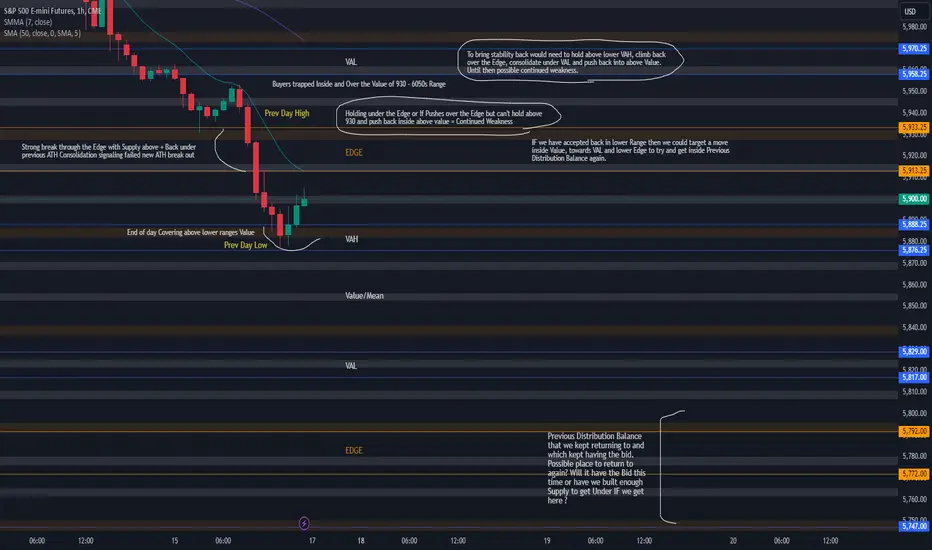
#ES_F Day Trading Prep Week 11.17 - 11.22.24Last Week :
Last week played out very well even though middle of the week had us thinking that maybe market will continue to hold inside Value above 970s as we kept getting buying in that area but it just took time to build up for the break of that cost basis at VAL to give us more selling end of week. Sunday Globex again opened over Value and grinded towards the upper Edge but we had no tag or push inside it which signaled weakness and as noted if that did no happen we needed to be careful looking for acceptance inside that new range and instead possibly look for this move to return back toward previous Edge and get back under 930s to possibly signal a failed new ATH break out by getting back under Previous ATH Consolidation. We first failed over Value and got the push back inside to correct the Poor low from Previous Weeks Friday Globex which was around the Mean area of that range which kept getting buying that gave us moves back to VAH but we slowly transitioned into correction first on Hourly then on 2hr and finally on 4hr to end the week on Friday with a break/hold under VAL smaller cost basis which gave us more weakness and selling to finish the Week under the lower Edge.
This Week :
So far looking at the structure of Daily/Weekly and the way we closed on Friday we could gather some info to help us go into this week. On Weekly TF we had a failed break out into new balance over 5950 which returned back inside Previous Balance of 950 - 660s, on Daily TF we hit a key upper Edge of the Range, held under it, built some supply and got back trough its VAH and made a move under its Mean area, under Previous ATHs consolidating potentially signaling a failed new ATH break out with a strong close under the smaller Daily MA. On Hourly's we have trapped Supply in above Range and reversed the whole move back under 930 - 13 Edge.
All of this so far screams weakness and continuation lower to me, of course we have to be careful as market could hold and start balancing here above lower Mean/Value and even try to get back inside and over upper Edge which could bring stability back but I think we would need to do all that and be able to hold over 930s AND get back over above VAL in order to see real stability or strength return.
Holding under the Hourly's Edge and under Daily Mean/under Previous ATHs we are looking for possible continuation towards 840s - 20s areas which would put us inside lower Value with a visit of its VAL which is also Daily VAL, these areas could provide covering if we get there BUT if we get through them then we can't forget about our favorite Previous Distribution Balance which market liked returning back into so much into 800 - 750s area which kept having our strong bids that would give us pushes away this is also Daily Edge low as that is a potential return target after failing at upper Edge. Will we get all the way there this week or not ? who knows but that is our possibility and something to watch moves towards as the week develops, question is when or if we get there will that area act as absorption area of all this Supply coming out and be enough to give us a good hold OR we have some nice longer TF stops under it which if we took could give us more supply to try another push for our lower Roll Gap which we have been building up to fill. This seems like a big move so maybe not all the way to fill the gap but it is in the cards if the weakness continues as that is also around Previous Weekly balance lows and if we get under 820 - 05 ( Weekly mid ) then that open the doors for it.
To think higher prices from here again we would need either a strong bid to push us back through the upper Edge and be able to hold over 920-30s AND have the buying to eventually get us back inside above Value, or at least hold over 860s, consolidate without going lower and make a push for upper Edge. Until then will watch the short side or some sort of consolidation balance to be playing out.