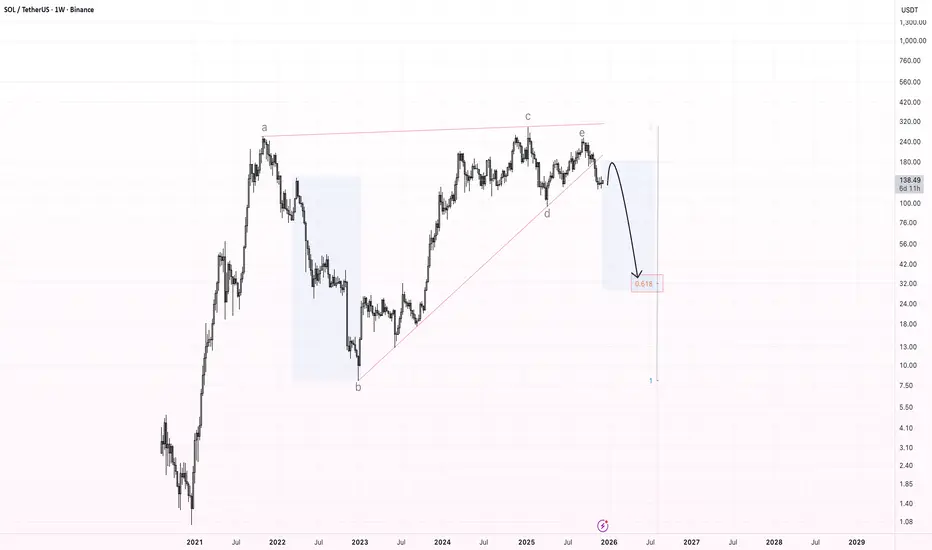
SOLANA reversal soonOn my opinion Solana has the cleanest EW count
Structure is well readable
Price is moving down after triangle was formed
Reversal will come after this wave 5 will be completed
SOL

SOLUSDT – Long Trade Setup and Analysis | 4H)SOLUSDT – Long Trade Setup and Analysis | 4H)
SOL is currently trading within a high-probability demand zone (123–121) that has been tested multiple times. Price compression at this base suggests that sellers are exhausted, and an upward reaction is likely.
Trade Plan
Entry Zone: 123 – 121
Stop-Loss: Below 121 (Daily close preferred)
Targets:
T1: 132 – 135
T2: 140 – 145 (Major resistance and range high)
Technical Analysis
Strong Horizontal Support: Multiple reactions confirm that buyers are active.
RSI ~35: Near oversold territory → increases the probability of a bounce.
Liquidity Sweep: Wick reversal below support indicates a stop-hunt before the reversal.
Structure: Downside momentum is slowing; base formation is visible.
DYOR | NFA.

SOL – Bearish Rising Wedge Breakdown (Weekly Chart)The chart shows a large multi-year bearish rising wedge , which has now been broken to the downside. This wedge has been forming since the 2022 bottom and consists of clear wave structure (a–b–c–d–e), with the final wave e rejecting at the upper boundary and triggering the breakdown.
After this kind of pattern, the market often provides a relief bounce back into the broken support , which should now act as resistance . For SOL, the expected retest zone is located around $170–$190.
If price confirms resistance there, I expect the beginning of a larger downward wave , targeting the main Fibonacci zone near the 0.618 retracement, which aligns with a long-term target around $30–$40.
This zone marks the primary downside target for a full wedge breakdown.
Key Points:
Multi-year bearish rising wedge has broken.
Expected retest: $170–$190.
Major downside target: $30–$40 (0.618 zone).
Potential start of a macro corrective wave.
SHORT IDEA SOL is showing weak momentum after a failed push higher.
Price got rejected from resistance, and sellers are stepping in.
RSI is rolling over, showing bearish divergence and loss of strength.
As long as SOL stays below resistance, I’m expecting a move lower toward support.
Bias remains bearish until we see a strong reclaim.
Not financial advice. Trade with confirmation.

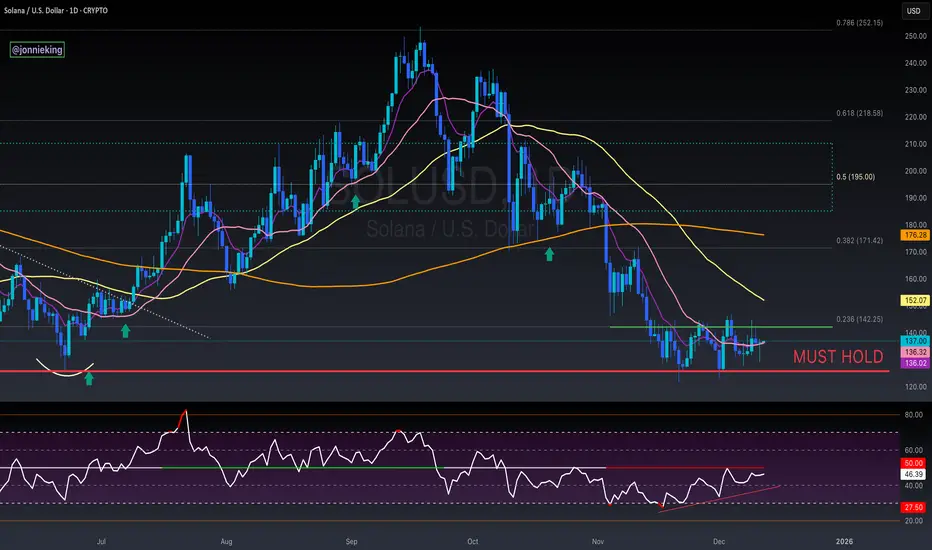
SOL mid-term TASolana is still very bearish on mid-term trend, as well as long-term there's no change in direction. Daily time frame is strictly bearish and currently Solana is entering the bearish area again, which may pull the price deeper to the previous lows around $90ish area.

BTC Update: Chop, Chop, Chopping Wood. Don't get shaken out. BTC Update: Price is doing exactly what I was expecting after the prior expansion phase - chopping and grinding rather than resolving immediately. Despite the growing panic and bearish sentiment, the market has not seen a true downside flush yet. From a structural perspective, this still looks like a higher timeframe consolidation rather than a full trend breakdown.
On the weekly, BTC remains above major cycle support, and the recent weakness appears more corrective than impulsive. Historically, these types of ranges tend to resolve with one final liquidation move to reset positioning. I’m still watching for a sharp downside extension into the ~$70k region, which would represent a deeper test of higher timeframe demand and a more complete sentiment washout.
What stands out most right now is sentiment. Fear has escalated quickly relative to actual structural damage, which is typically what you see before a final flush, not after one. Until that move happens, I expect continued volatility and frustration as the market works through excess leverage.
Assuming a proper reset plays out, this would likely set the stage for a cleaner continuation higher into early next year. For now, patience is key - this phase is about letting the market finish its reset before the next sustained leg develops.

SOLANA Buy Signal With 60% Profit (3D)Considering that Solana is approaching a strong demand zone and if this corrective wave reaches the entry area it will result in more than a 55% price drop we will be looking for long buy positions at the two specified entry points.
The origin we are approaching is a strong one that has previously swept liquidity pools therefore there is significant money flow in that area.
We have two targets at the first target you should take profit and then move to break even this is a higher time frame setup and this signal may take several weeks to play out.
Do not enter the position without capital management and stop setting
Comment if you have any questions
thank you

SOLANA's situation+next targets and expected movements If this support is lost and the descending triangle pattern proves valid and the price follows it, solana will fall below $110 cents for a long time. But since the crypto market often breaks rules and patterns, maybe this time it will reverse again and, after breaking the triangle, push the price back above $157 cents.

SOL/USDT | Solana Is Testing Buyers Right Now, Pump or Dump?CRYPTOCAP:SOL rallied all the way to $146 before pulling back again and right now price is trading near $132. The correction is completely normal and the main demand zone sits between $122 to $132 which is exactly where Solana is reacting at the moment. This is the zone that needs to hold because losing it would open the door for a deeper drop.
If buyers fail to defend the current range there is still a clean lower demand area around $105 where I expect stronger accumulation and a possible start of the next bullish leg. For now I am watching to see if SOL stabilizes inside the $122 to $132 zone because a proper hold there usually leads to another upward push.
Please support me with your likes and comments to motivate me to share more analysis with you and share your opinion about the possible trend of this chart with me !
Best Regards , Arman Shaban

SOL - Taking the Baton from SUIAlright traders, quick update from the battlefield.
The SUI swing trade finished way faster than I expected —
which is nice… but also suspicious. 😅
And now?
SOL is stepping in with a very similar setup.
Same vibes, same structure, same “this probably shouldn’t go lower” feeling.
Today’s move looks like nothing more than a liquidity grab to me.
Grab the stops, scare everyone, shake the tree.
Tomorrow we’re getting better macro data,
and if that lines up, we could easily rotate back into the range.
Yes, I’m still counting on a little Santa rally 🎅
and yes, I want to be in the position early.
Am I okay risking a few % of my account for it?
Absolutely.
That’s the price of being early — and sometimes wrong. 😄
Let’s see how SOL decides to behave.
Good luck traders — and may Santa not skip crypto this year 🎅📈🚀

SOL Scalp Sell/Short Signal (1H)Given the formation of lower LHs and the bearish internal structure of Solana based on a bearish ICH, we can look for short sell positions below the previous highs.
At the first target, move to break-even and shift the stop loss to the entry.
Do not enter the position without capital management and stop setting
Comment if you have any questions
thank you

Solana Fakeout: Bulls Caught, Bears in ControlMarket Context
In my previous publication about Solana, I clearly defined an Invalidation Level for the bearish setup. Price has now swept buy-side liquidity above that level, forming a false breakout with strong rejection.
This move appears to be a stop hunt, not genuine acceptance above resistance.
Structure & Intent
The long bullish candle above the invalidation level failed to hold, signaling lack of follow-through and confirming distribution at premium prices.
This behavior reinforces the expectation of further downside expansion.
Scenarios Recap
Previously, two downside scenarios were outlined:
• Scenario 1 : mitigation toward 116–118, followed by potential stabilization
• Scenario 2 : continuation toward 108 and below
The recent liquidity grab confirms Scenario 2 activation.
Execution Plan
📉 Bias: Bearish
🎯 Primary Target: 106
🧲 Intermediate liquidity: 116
❌ Invalidation : 129.4
Any acceptance or touch above this level invalidates the bearish thesis and opens the door for bullish continuation.
Conclusion
As long as price remains below the invalidation zone, Solana is expected to expand lower in search of sell-side liquidity.

Solana ~ TRADE The CHOP: 3 Ways to Make ATLEAST +15%Choppy markets are identified by low volume and sideways trading / range trading. It seems uninteresting in most cases, but you don't have to sit around and wait for the next big impulse wave!
Here are three plays YOU can take during choppy markets:
1) 4H : Short Resistance
Chop trading can be a blessing - the price often touches the same support zone and the same resistance zone 2 - 3 times, before breaking out either way. This means that if you spot your zone early, you could take a short timeframe swing trade. Another way to find a trade is to look for gaps in the candles, for example:
2) 4H : Long Support
South Africa is in a time of turbulence, and the Rand is unpredictable as the effects of G20 settle in. During these times, and this counts for all markets, placing a low risk leveraged long on support is a way to trade the chop:
3) Daily : SPOT Hold to TP Zone
Nothing like a classic low risk trade - but you may need some patience with it! If you're not willing to look at charts all day, or have alarms wake you up at 2:30am to take a trade then this is your style., for example:
What do you do during choppy markets?

SOL in Downtrend: Crypto Winter Hits HardFinally, Solana has broken out of its stagnation.
For a long time, the chart has been building a consolidation in the form of a three-wave WXY correction.
Right now, wave Y is wrapping up. I believe this wave could play out in two scenarios:
🔻• Solana drops from current levels to around 116-118;
🔻• or we see it much lower, in the 108 area.
I’m leaning more toward the second option because the consolidation has been quite prolonged. Plus, as I mentioned earlier, I think we’ve entered a downtrend. Crypto winter has already kicked off and is in full swing.
❌ The invalidation level for my bearish plan is 131.8 — any touch, even briefly, would cancel this scenario.
⚠️Be cautious: don’t trade without stop-losses, and avoid trying to catch the bottom, or you might end up with an unwanted “gift.”
🚀Drop reactions and comments if you want me to post daily updates on Solana.

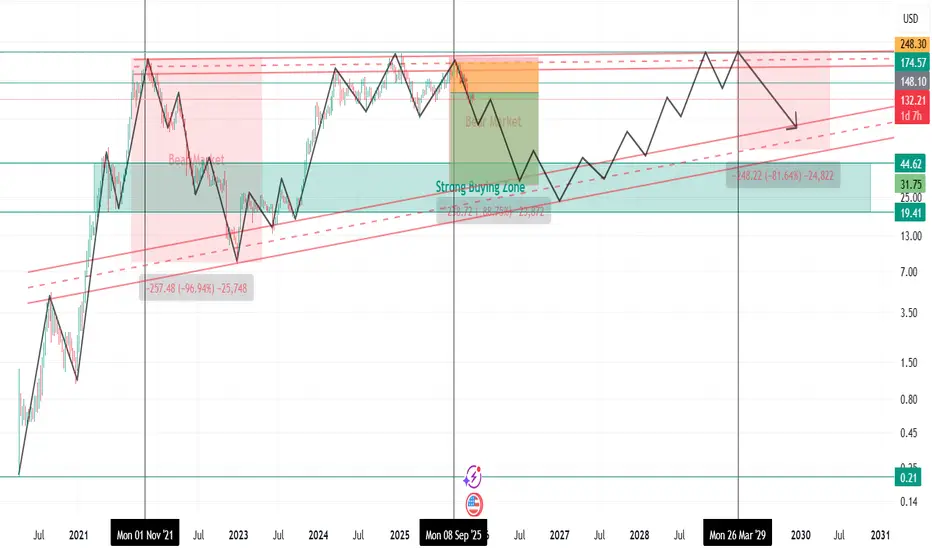
SOLUSD Long-Term Market Cycle Analysis |Bear Market Phase ActiveSolana (SOL) was listed on 10 April 2020 at around $0.21 .
During the 2020–2021 bull market (Altseason Phase-4) , SOL showed an exceptionally strong rally after listing and formed its all-time high near $260 on 6 November 2021 .
From that point, a major bear market started.
Between 7 April 2021 and 29 December 2022 , Solana remained in a clear downtrend , printing continuous lower highs and lower lows.
Price dropped from $260 to nearly $8 , resulting in a −96.9% correction , which is typical for high-beta altcoins during bear cycles.
A new bull market phase began on 30 December 2022 , but according to current market structure and cycle analysis , this bull phase has now ended around 13 September 2025 .
The overall structure has shifted bearish , and Solana is currently trading in a confirmed bear market phase starting from 14 September 2025 .
Key Resistance Zones (Strong Reversal Areas):
$148
$174
$210
These levels are expected to act as major supply zones , where strong selling pressure and reversals are likely.
Bear Market Outlook & Risk Projection
Bear market may extend until October 2026
A further downside move of up to −88% is possible within this cycle
If such a correction occurs, there is an 80% probability that SOL could trade in the $45 – $30 range during September–October 2026
Key Support Zones (Accumulation Areas):
$80
$45
$30
Trading Bias
* Avoid long positions during this phase
* Focus on short setups near resistance zones
* Trade with strict risk management and confirmation
Disclaimer:
This analysis is based on historical market cycles, structure, and technical behavior .
Not financial advice. Always manage risk.
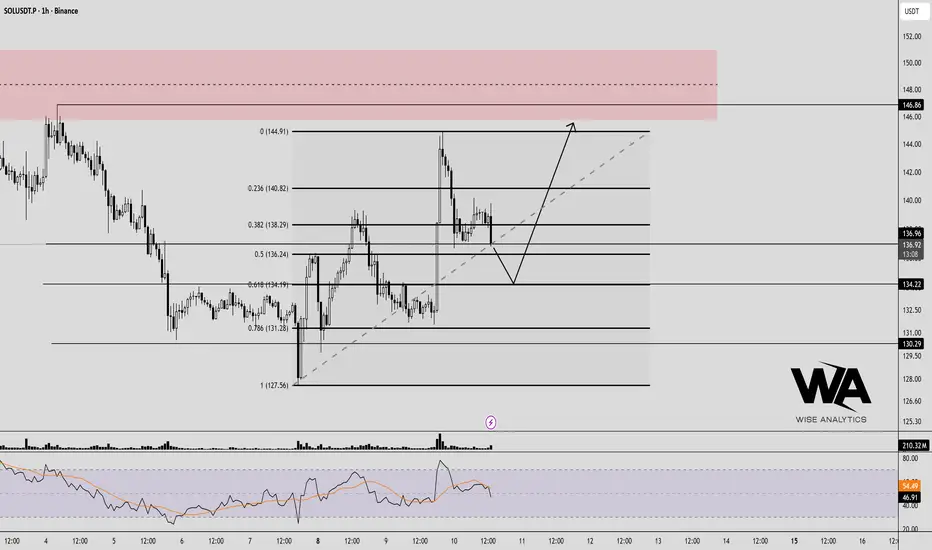
SOLUSDT – Swing Trade in Play Alright traders, we’re trying another swing trade on SOL —
counting on a rally in the next few days/weeks.
Why? Because the macro picture is finally starting to look a bit less depressing.
Sure…
today’s Jobless Claims weren’t great,
but overall macros are improving slowly,
and that gives the market some space to breathe.
So what do I expect?
👉 Small push down first (because crypto can’t ever go straight up)
👉 followed by a move upward — hopefully the real swing leg we’re waiting for
It’s not guaranteed (nothing ever is),
but the setup looks solid and worth taking with proper discipline.
⸻
⚠️ Trade safely, legends
Use proper risk management,
don’t overleverage,
and let SOL do the heavy lifting. 😄
Good luck! 🚀🔥

SOLUSDT – Up… Finally?Alright traders, I’ll be honest —
a few of my recent trades went south faster than my morning coffee.
So hopefully this one decides to treat us a little better. 😅
We had a small decline during the Asia session,
nothing dramatic, just the usual SOL “I’m bored” dip.
But from this level, I’m expecting a bounce —
maybe not a huge one, but definitely enough to catch a clean move up.
The setup is simple:
👉 small pullback
👉 potential bounce
👉 let’s try to finally win one 😄
Let’s see how it plays out —
trade safe, manage your risk,
and may SOL behave for once! 🚀🔥

$SOL Stuck In ConsolidationSolana has been stuck in this consolidation range the past month ~$125 - 145
Truly an infliction point for CRYPTOCAP:SOL
a break in either direction should be massive upside or downside.
HOPIUM: bullish divergence appears to be forming on the RSI
Solana Breakpoint just kicked off today, but the market showed very little interest.
Bulls need a huge injection here.
SOL looking Spicy... Keep an eye on the structure. Solana is still trapped inside a tight range, but momentum is quietly shifting.
Price continues to reject the same major resistance zone, while buyers are stepping in at the bottom of the range with repeated bullish signals on the lower indicators. Each pullback is showing less downside follow-through, and the oscillators are beginning to build higher lows.
The key level remains unchanged: SOL needs a clean breakout above the range high to open up that much larger volume gap toward the mid-140s. Until then, this is a consolidation with tightening compression.
Hold the range - breakout potential.
Lose the range - $116 becomes the next major support.
Watching this setup closely, SOL looks like it's preparing for a bigger move.
What’s your outlook here?

#BTC Global analysis of BTC. Correction and decline to 65kBYBIT:BTCUSDT
BYBIT:BTCUSDT.P
COINBASE:BTCUSD
Bitcoin is currently in an uncertain phase for everyone, so I have analyzed the most likely outcome of the price movement in my opinion.
On D1, we see a downtrend and a reaction from support levels. As a result, Bitcoin corrected to the 0.5 Fibonacci level, after which it did not reverse the trend but continued to test the 0.5 level.
The trend short line on H8-D1 was broken after several serious touches, and now I am waiting for a retest from the 0.618 Fibonacci level and a further correction to 98500-100000, where the 0.618 and 0.702 Fibonacci levels are also located.
This is a serious resistance level for the price and the place where the structure (BOS) was broken. The price usually returns to this place for further movement along the trend.
I expect this scenario, as I have not noticed that the main cryptocurrency has gathered enough liquidity to update its highs and a global long scenario.
At levels 98500 - 100000, I expect a short scenario to levels 65000 - 75000.
From there, Bitcoin will likely delight us with a long-term outlook and attract a large number of investors.
In addition to this, it is known that a large number of investors hold stablecoins and are ready to buy Bitcoin. Until this happens, we can assume that investors and funds are waiting for a suitable favorable price for the main asset.

My trading plan is SOL.I will be buying Solana in this price range, aiming to reach $146.
Remember that today is FOMC day, so expect high volatility! Follow your risk management strategy and make your own decisions.
$SOL Solana is currently in a clear accumulation phase following a strong reaction from the major demand zone.
The horizontal accumulation in this zone indicates both a re-intensification of liquidity and the market gathering energy for the next directional breakout.
As long as the region holds, the structure is positive, and this accumulation will be the key to the next expansion phase.

Solana Rebounds Weakly with No Clear Trend SignalsSolana on the 4H timeframe is only showing a mild pullback, as neither technicals nor news indicate fresh inflows strong enough to shift momentum. Price remains capped below the 138–142 FVG resistance cluster, and although small rebounds occur, their narrow range highlights the lack of aggressive buying. The Ichimoku cloud and multiple overhead FVGs form a thick supply layer, causing every upward attempt to be sold off — making a breakout relatively unlikely.
Volume behaviour also supports the idea of a technical retracement: it picks up slightly at the lows but fades as price climbs, signalling reactive buying rather than committed inflows. If SOL fails to break above 142, a move back down to fill the lower FVG at 128–123 remains a reasonable scenario.
