SBET vs DFDV: Which Crypto Treasury Horse Will Run Fastest?SharpLink Gaming (SBET) and DeFi Development Corp. (DFDV) are prime examples of the MicroStrategy model applied to different digital assets, Ethereum and Solana, respectively.
SharpLink Gaming, formerly an online gaming company, has made a dramatic and public pivot to become one of the world's largest corporate holders of Ether (ETH). Its strategy is to act as a direct and transparent vehicle for investors to gain exposure to the Ethereum ecosystem. The company actively raises significant capital through equity offerings, such as its recent multi-billion dollar ATM program, to fund its ETH acquisitions. It also generates yield by staking its ETH, which is a key part of its business model. The company's stock price and market narrative are now almost exclusively tied to the performance of its growing ETH treasury, making it a high-beta proxy for Ethereum.
DeFi Development Corp. has a similar, dedicated focus on Solana (SOL). The company's business is centered on accumulating, compounding, and providing exposure to SOL. DFDV's core strategy is to grow its "SOL per share" metric, which is its equivalent to MicroStrategy's Bitcoin per share. To achieve this, DFDV also engages in aggressive capital raises. Like SharpLink, it also generates revenue by actively participating in the ecosystem through staking, operating its own validator nodes, and exploring other on-chain opportunities.
In essence, both companies have fundamentally transformed their business models to serve as publicly-traded, regulated treasury vehicles for their respective assets. They both use financial engineering, like capital raises, to grow their holdings and create a leveraged play for investors. The primary difference is the underlying asset—ETH for SBET and SOL for DFDV—and the specific ecosystem activities they engage in to generate additional value beyond simple price appreciation.
Market Cap
Comparing the market capitalization of Ethereum (ETH) and Solana (SOL) is crucial for understanding the capital flows needed for one to outperform the other. As of late August 2025, ETH's market cap is approximately $429 billion, while SOL's is about $87 billion, meaning ETH is nearly 5 times larger.
For SOL to outperform ETH, it must grow at a much faster rate. Due to its smaller size, SOL requires a proportionally smaller amount of new capital to achieve a significant price increase. For example, to close the market cap gap by 10%, SOL would need an additional $43 billion in inflows, which would cause its price to more than double. In contrast, for ETH to achieve the same proportional gain (e.g., a 10% increase), it would need over $40 billion in new capital inflows.
Essentially, SOL has a higher beta and a lower monetary hurdle to achieve significant percentage gains. A steady inflow of tens of billions of dollars would have a much more dramatic impact on SOL's price than on ETH's. However, with ETH's sheer size and institutional backing, particularly with the recent launch of spot ETFs, it can absorb and channel much larger capital flows, which is a key reason its price is less volatile. Therefore, SOL's smaller size makes it more sensitive to inflows, making it easier for it to outperform ETH on a percentage basis, especially during a retail-driven bull market.
Impact of Spot ETFs
A significant number of spot Ethereum ETFs have already been approved and are trading in the United States. Following the approval of the initial 19b-4 filings in May 2024, the SEC subsequently declared several S-1 registration statements effective in July 2024, allowing the ETFs to begin trading. There are currently nine SEC-approved spot ETH ETFs from major issuers like BlackRock, Fidelity, and Grayscale. There are currently no approved SOL spot ETFs in the United States. However, several applications are under active consideration by the SEC. Filings from major issuers such as Bitwise and 21Shares have been submitted, but the SEC has consistently delayed its decision on them. There is a general expectation that if the SEC continues to follow the precedent set by Bitcoin and Ethereum, a Solana ETF could be the next in line for approval. In summary, a clear distinction exists: ETH spot ETFs are a reality, with multiple products already trading, while SOL spot ETFs are still in the application and review phase, awaiting a decision from the SEC.
Summary
While ETH has had relative outperformance in August 2025 against Bitcoin and most large-cap alts, the approval of Solana spot ETFs will provide a significant tailwind for SOL and SOL treasury companies like DFDV. While Ethereum is the strongest horse among the alts, has experienced no downtime, and gas fee transactions on the main chain have become much cheaper than they were the last cycle, hot money will quickly allocate capital towards the highest-beta alts and crypto treasury companies as ETFs are approved; possibly on a rolling basis if underlying assets are approved at different times in Q4. However, expect ETH and SBET to do exceptional through 2026 as ETH hits mainstream adoption through ERC-20 based tokenized stocks, prediction markets, etc. and as spot ETF inflows accelerate.
SOL

25/08/25 Weekly OutlookLast weeks high: $117,955
Last weeks low: $110,678.07
Midpoint: $114,316.53
This weekly outlook is a day late due to a public holiday but what happened last week is clear. A sell-off from Monday all the way until Sunday and as suggested in the last weeks outlook the $108,000-$111,000 level did provide the support BTC bulls were looking for, after a 6.2% drop from high to low despite a Friday rally thanks to the FED chairs speech.
Looking at the chart it is in my opinion not ideal for the bulls, my reasoning for this:
August/September seasonality coming into play. Historically a poor return in this period of the year.
Heavy sell-off despite good macro news implies exhaustion on the buy side.
Monthly close towards the end of this week, window dressing/de-risking takes place and increases the sell-side pressure.
Daily bearish structure confirmed with new lower high and lower low set.
So what does this mean for this week? Locating an area on the chart I'd like to see BTC strength from,. For me that would be 1D 200 EMA level at ~$103,000. Since September 2023 BTC has used the 1D 200 EMA as a springboard for each of its rallies and so for this bullrun to continue price must continue to respond positively off the level. The RSI would have likely reached oversold adding confluence to potential Long entries.
In a bullish scenario we could see the weekly low get reclaimed, this has routinely happened in the past and often leads to a test of the midpoint, this would be a good short term play but my gut says the overall higher timeframe (next month) is continued sell-off.

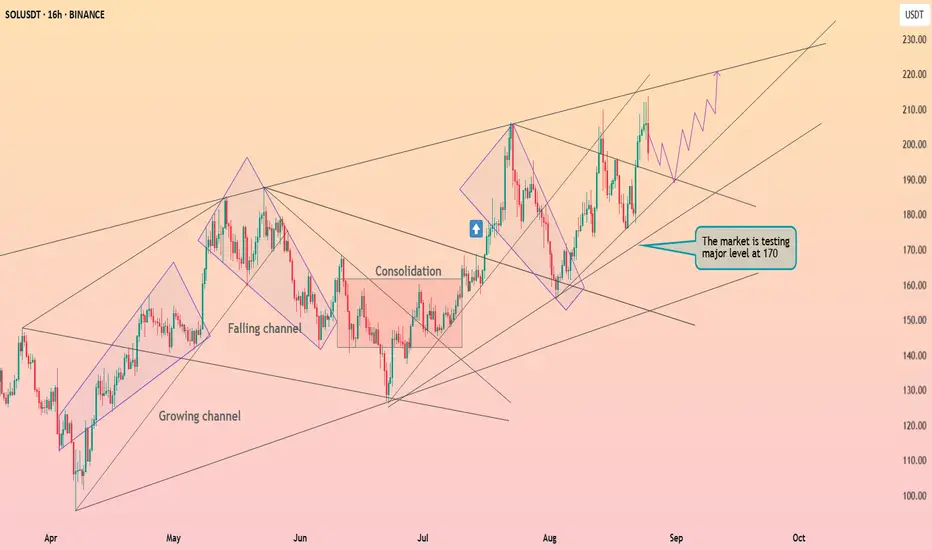
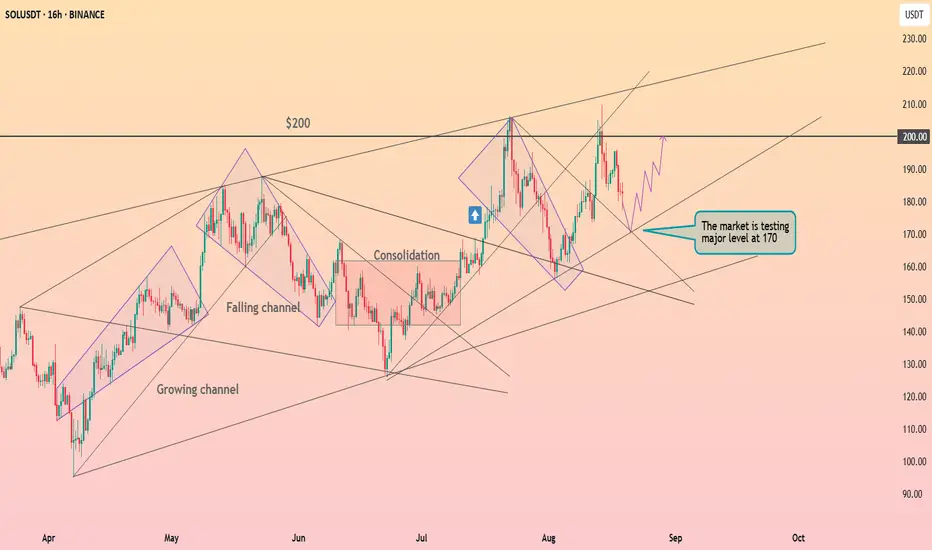
Solana fixed above the $175 ┆ HolderStatBINANCE:SOLUSDT on the 16h chart is testing the major $170 resistance level. Previous consolidations and falling channels have transitioned into higher highs, supporting the broader bullish structure. A breakout above $170 would confirm momentum toward $200, while $160 acts as the critical support for invalidation.
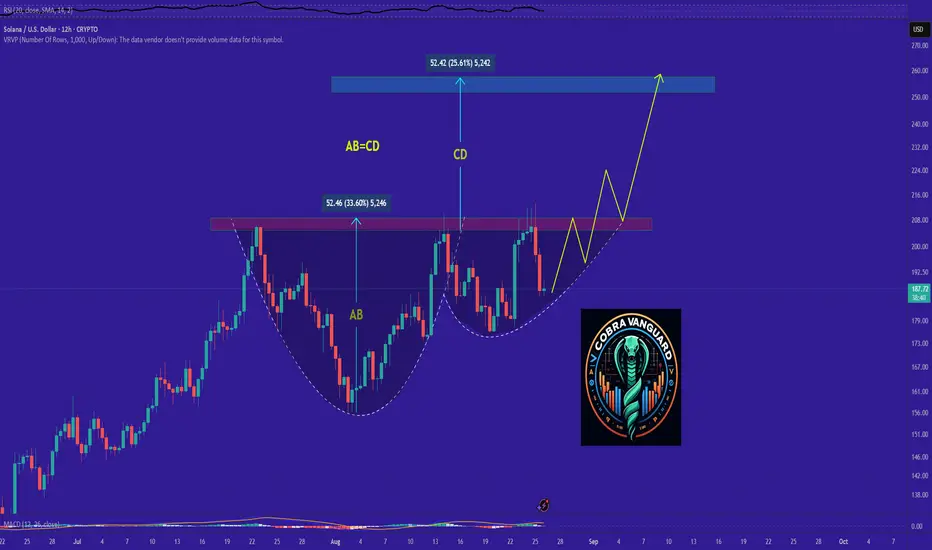
SOL's Situation, A Comprehensive Analysis !!!It appears that the price is forming a cup and handle pattern, and if this occurs, it could push the price above $210.
Best regards CobraVanguard.💚
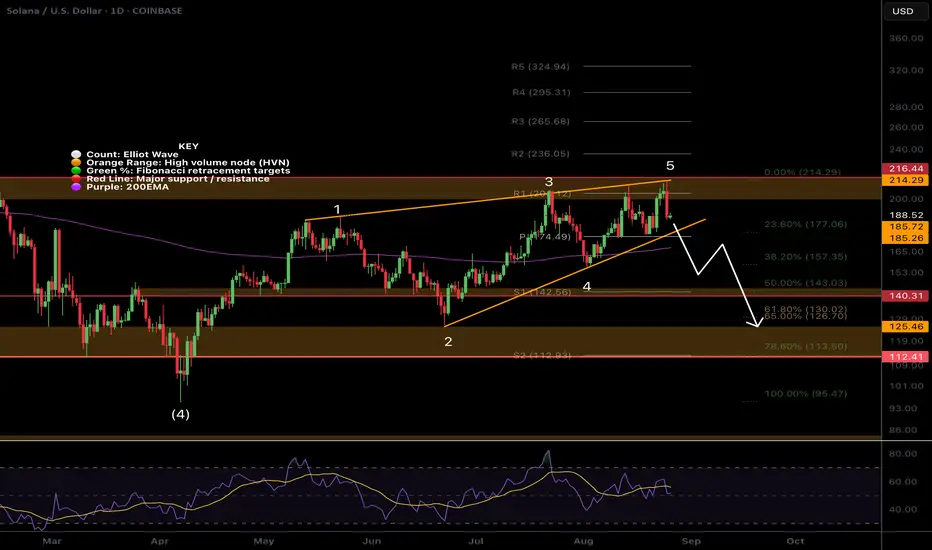
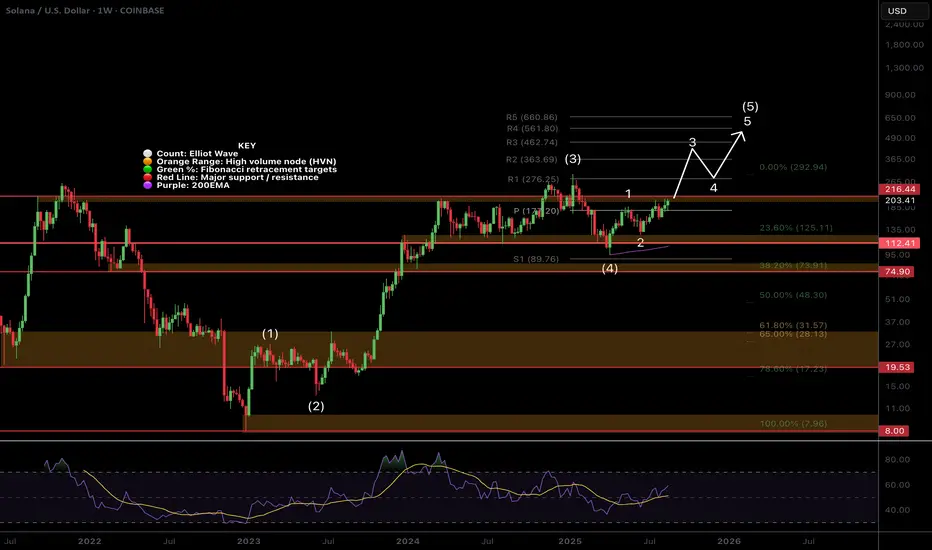
SOL Elliot Wave Count ChangedCRYPTOCAP:SOL Solana appears to have completed an Elliot wave diagonal pattern with a series of ABCs.
Falling below the trend line and 200EMA would confirm this and bring up a first target of $140 at the High Volume Node and 0.5 Fibonacci retracement.
Daily RSI has had bearish divergence for a while. The 'alt-coin golden pocket' 0.786 sits at the wave 2 bottom around $119 which would be a buy for me if price gets down that far.
Safe trading.
SOLUSD H4 | Bullish bounce off major supportBased on the H4 chart analysis, we could see the price fall to the buy entry, which is an overlap support and could bounce from this level to the take profit.
Buy entry is at 174.90, which is an overlap support.
Stop loss is at 161.49, which is a swing low support that is slightly below the 138l2% Fibonacci extension.
Take profit is at 196.85, whihc is a pullback resistance.
High Risk Investment Warning
Trading Forex/CFDs on margin carries a high level of risk and may not be suitable for all investors. Leverage can work against you.
Stratos Markets Limited (tradu.com ):
CFDs are complex instruments and come with a high risk of losing money rapidly due to leverage. 65% of retail investor accounts lose money when trading CFDs with this provider. You should consider whether you understand how CFDs work and whether you can afford to take the high risk of losing your money.
Stratos Europe Ltd (tradu.com ):
CFDs are complex instruments and come with a high risk of losing money rapidly due to leverage. 66% of retail investor accounts lose money when trading CFDs with this provider. You should consider whether you understand how CFDs work and whether you can afford to take the high risk of losing your money.
Stratos Global LLC (tradu.com ):
Losses can exceed deposits.
Please be advised that the information presented on TradingView is provided to Tradu (‘Company’, ‘we’) by a third-party provider (‘TFA Global Pte Ltd’). Please be reminded that you are solely responsible for the trading decisions on your account. There is a very high degree of risk involved in trading. Any information and/or content is intended entirely for research, educational and informational purposes only and does not constitute investment or consultation advice or investment strategy. The information is not tailored to the investment needs of any specific person and therefore does not involve a consideration of any of the investment objectives, financial situation or needs of any viewer that may receive it. Kindly also note that past performance is not a reliable indicator of future results. Actual results may differ materially from those anticipated in forward-looking or past performance statements. We assume no liability as to the accuracy or completeness of any of the information and/or content provided herein and the Company cannot be held responsible for any omission, mistake nor for any loss or damage including without limitation to any loss of profit which may arise from reliance on any information supplied by TFA Global Pte Ltd.
The speaker(s) is neither an employee, agent nor representative of Tradu and is therefore acting independently. The opinions given are their own, constitute general market commentary, and do not constitute the opinion or advice of Tradu or any form of personal or investment advice. Tradu neither endorses nor guarantees offerings of third-party speakers, nor is Tradu responsible for the content, veracity or opinions of third-party speakers, presenters or participants.

SOLANA BULLISH MEGAPHONE PATTERN LOADING! solana continues to move step by step towards higher levels within the bullish megaphone pattern, which will make movements towards ATH and more inevitable in the coming period

SOLUSDT 1W Chart1. Main trend
• You can see a strong upward trend from holes around 120 USDT.
• The course currently moves along the growing trend line (orange).
• The last candles show that the buyers are defending support and each hole is higher → a sign of market strength.
⸻
2. Support and resistance (key levels from the chart)
• Support:
• 186.56 USDT - the first strong support (coincides with the trend line).
• 166.42 USDT - another stronger support.
• 139.00 USDT - main strategic support.
• resistance:
• 219.02 USDT - the closest resistance (currently tested).
• 253.15 USDT - strong resistance if 219 is broken.
• 296.24 USDT - another target in the event of a bull market.
⸻
3. Indicators
• MacD - upward signal, lines are above the zero line, green histogram → momentum is growing.
• STOCHASTIC RSI - high, close to the purchase zone → a short correction may occur.
• RSI (classic) - ~ 60 points, i.e. not yet purchased, but the space for increases is reduced.
⸻
4. Scenarios
• Bycza (more likely at the moment):
If the SOL stays above 186 USDT and pierces USDT USDT, subsequent goals are 253 → 296 USDT.
• Bear (alternative):
If the price drops below 186 USDT and breaks the trend line, possible return to 166 and even 139 USDT.
⸻
🔑 Summary
• The trend is upward and still strong.
• Key breakdown is 219 USDT.
• Trend holding (above 186 USDT) = potential for further increases.
• Breaking the trend line = correction warning.

SOL Game Plan - Solana AltcoinSOL Game Plan
📊 Market Sentiment
Overall sentiment remains bullish, supported by expectations of a 0.25% rate cut in the upcoming FOMC meeting. A weakening USD and increasing global risk appetite are creating favorable conditions for further upside in crypto assets.
📈 Technical Analysis
Price has aggressively broken the HTF bearish downtrend and closed above it on the daily chart, indicating potential continuation to the upside.
In addition, price broke through the HTF resistance level, which is now acting as HTF support.
📌 Game Plan
I expect price to retrace back to the HTF support level at $194 and bounce from there, potentially retesting the broken HTF trendline as well.
🎯 Setup Trigger
I will monitor the 4H market structure for confirmation before initiating a position.
📋 Trade Management
Stoploss: Daily close below HTF support zone
Target: $296 (all-time high)
💬 Like, follow, and comment if you find this setup valuable!
⚠️ Disclaimer: This content is for informational and educational purposes only and does not constitute financial, investment, or trading advice. Always do your own research before making any financial decisions.

SOLANA's Situation (4h) !!!It appears that the price is forming a cup and handle pattern, and if this occurs, it could push the price above $210.
Best regards CobraVanguard.💚

$SOL Ready for Price Discovery?CRYPTOCAP:SOL wave 3 of (5) appears to be underway but has to get through the major resistance High Volume Node at $216 and previous high first for an impulsive move.
Weekly pivot point was tested successfully as support and RSI has plenty of room to continue upwards.
Analysis is invalidated below $130.
Safe trading
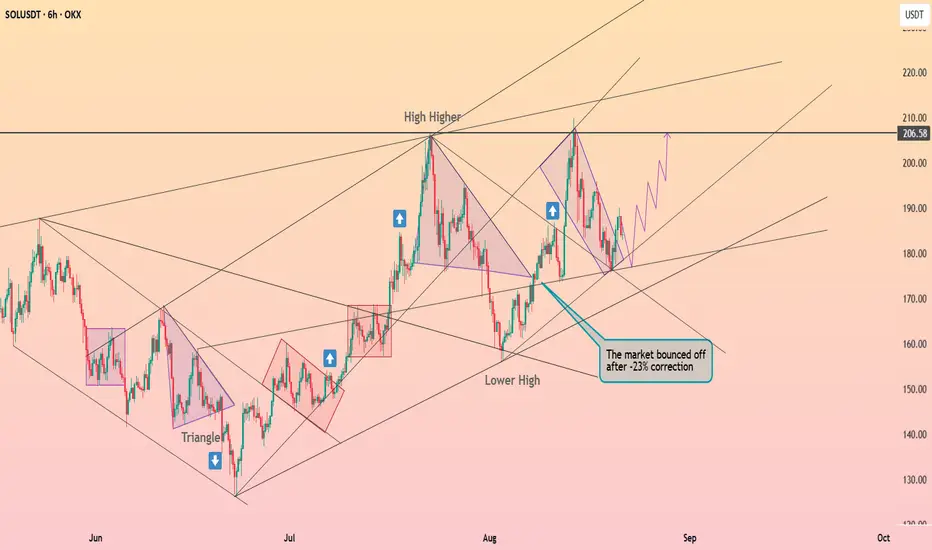
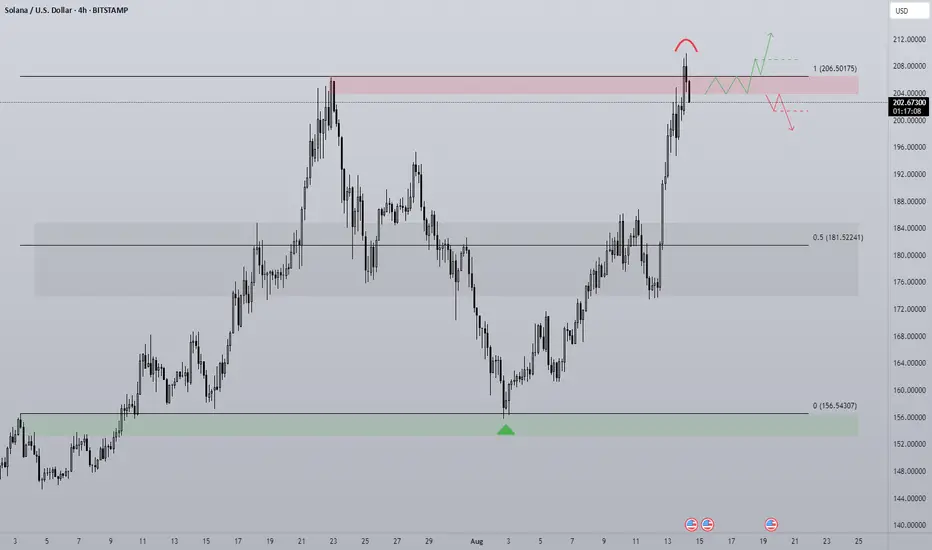
Solana exited the descending wedge ┆ HolderStatOKX:SOLUSDT has recovered quickly from a -23% correction, holding structure with higher highs and resilient rebounds. The market is now preparing for a retest of $206.58 resistance, and a breakout could fuel another push higher toward $220+.
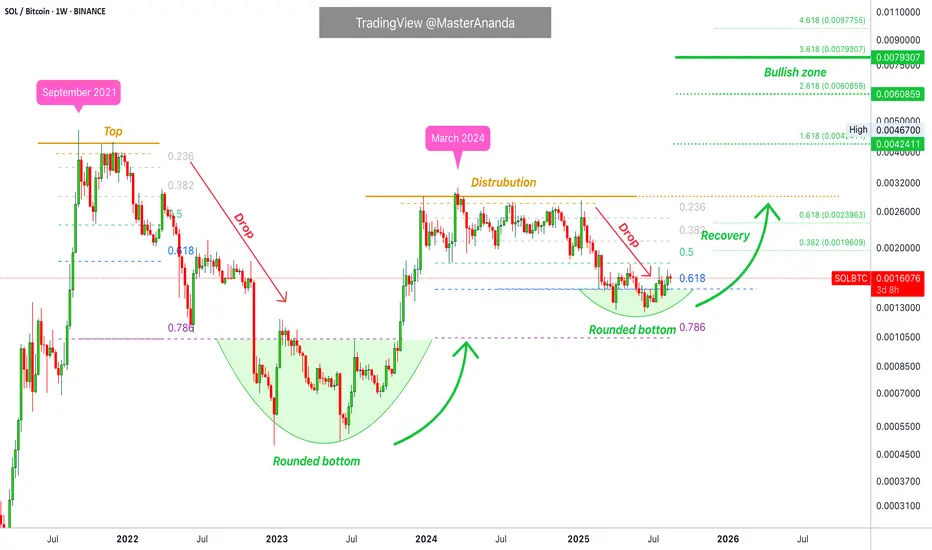
Will Solana Recover? SOLBTC Reveals the AnswerThe truth is that we can find the answer by looking at SOLBTC (Solana vs Bitcoin). If we have a bearish SOLBTC then we know the market is about to tank and about to do so wildly. But, with a bullish SOLBTC we know Solana to be bullish and related altcoins as well. Let's dive into this chart and see what it has to say.
SOLBTC peaked March 2024. A peak is always followed by a correction and this time it took a while before support broke. SOLBTC went into distribution and crashed earlier to reach long-term support. The support zone established appeared just below 0.618 and right above 0.786 Fib. retracement. SOLBTC activated the lowest prices since November 2023.
This last part represents the rounded bottom on the chart between April and August 2025. Notice how SOLBTC is trading back above 0.618 Fib. retracement. This makes this a very strong bullish setup.
Back in September 2021, SOLBTC peaked and produced a drop. The drop or bear market resulted in a huge rounded bottom and from this bottom a recovery, the recovery leads to a bullish cycle and wave. Currently we are in this bullish cycle.
The recent drop is a long-term higher low. We are now entering a new recovery phase and this will lead to massive growth. Seeing SOLBTC being extremely bullish long-term, we know SOLUSDT (Solana vs Tether) is also set to grow. There you have your proof.
By the way, SOLBTC is now good for a LONG trade. I will give this chart a closer look.
Namaste.
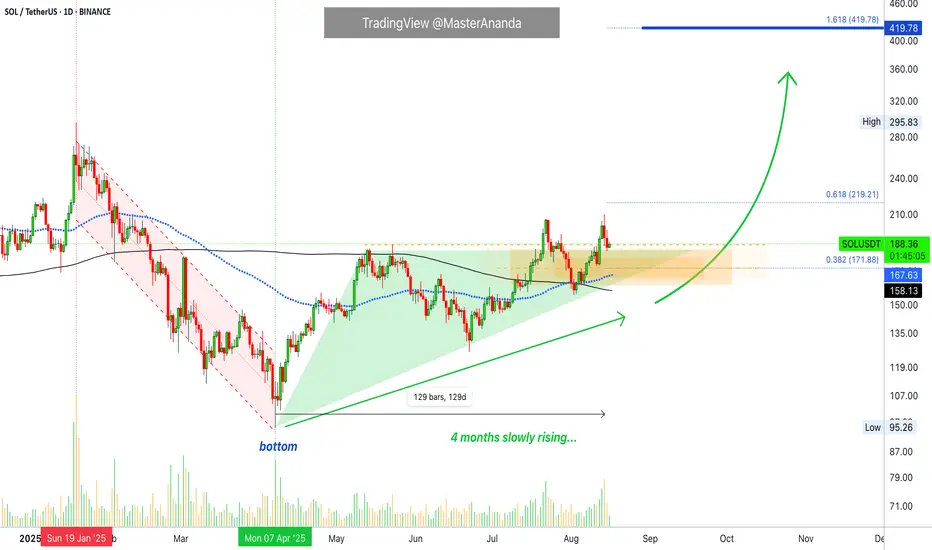
Solana Bullish · Long-Term Growth ConfirmedAfter the market bottom in April Solana has been rising slowly for four months.
Look at this chart here. I am keeping it very simple because I believe simple is best. Where is Solana at now? What happens next?
Solana is trading safely above EMA89 and MA200, notice the dynamics on the chart. These levels were first conquered as resistance back in July and by the 2nd of August these levels were being tested as support, they both held.
SOLUSDT is trading safely above these levels and also a price of $172 which is the 0.382 Fib. extension of the current wave. This is an important zone and the action is happening safely above it.
Solana has room to move around, wiggle around. This is what happens as prices grow. There can be stops and retraces but this does not mean that the rise is over, there is always more.
Solana just conquered the EMA89/MA200 duo-resistance recently, we have not yet seen what is possible now that the trading is happening on the bullish zone. We are due a major advance... The market is consolidating, building up strength to be able to grow long-term.
Namaste.
Solana above the strong support ┆ HolderStatBINANCE:SOLUSDT is currently testing $170, just beneath major resistance at $200. Breakout confirmation could open path to new highs, while rejection risks pullback to $150 support. Consolidations suggest momentum is building for another significant move.
SOLUSDT 4H✅ SOL/USDT — 4H (Binance) | Aug 20, 2025 — Professional Technical Read
🔎 Chart context
• Structure is broadly bullish since early Aug, but the last leg printed a lower high → pullback into a 4H demand/FVG block.
• Price now ~180.7 inside that block. Two paths are drawn on your chart: a reaccumulation → breakout to 210 or a loss of demand → sweep 158.
📍 Key levels (approx.)
• Supply / liquidity above: 200–210 (major liquidity line marked 210.00).
• Decision block (current): ~175–183 (4H demand/FVG; prior breakout origin).
• Pivot / CH reference: ~194–196 (CH 4H label — reclaim turns momentum cleanly bullish again).
• Support below: ~158 (tagged on chart), then 150–145 (deeper old base).
🧭 Market structure & liquidity map
• After the CH 4H and rally to the recent peak, price created a higher low around ~165–168, then a spike to ~205, and is now mitigating the 175–183 block.
• Wicks show responsive buyers at the upper edge of the block, but the midline is soft; a clean close below ~175 likely exposes the resting liquidity at 158.
• Above, buy‑side liquidity sits over 200 with a cluster around 209–210 (equal‑highs feel).
📈 Bullish continuation (probable if 175–183 holds)
Conditions:
• Hold 175–183 with a 4H HL and impulsive reclaim of ~188–190, then CH area ~195.
Path & targets:
1. Trigger reclaim: 188–190 → momentum confirmation above 195 (CH 4H).
2. TP1: 198–200 (partial).
3. TP2: 205–206 (prior swing).
4. TP3: 209–210 (liquidity sweep).
Invalidation: a 4H close below 175.
📉 Bearish continuation (activated on loss of demand)
Conditions:
• 4H close below 175 or failed bounce capped under 188–190.
Path & targets:
1. Pullback/failed retest into 182–186 (sell zone).
2. TP1: 168–166 (intermediate shelf).
3. TP2 (main): 158 sweep (your downside tag).
4. Extension (if momentum persists): 150–145 mitigation.
Invalidation: sustained reclaim >195.
🎯 Trade plans (system‑agnostic

Solana seeks to rebound ┆ HolderStatKUCOIN:SOLUSDT on the 6h chart broke through the $150 key level, then extended to 210 before correcting. The market is now testing 172.60 support. If buyers defend this level, upside targets at 190–200 remain valid.

SOL - Breakout or Rangebound?For me this chart is quite simple with two options, a bullish and bearish scenario. SOL is currently rangebound but the massive momentum in the broader market has opened the door to a potential breakout of this trading environment.
To look at the context of the chart we has a clear push from the midpoint up to range high, very little in the way of pullbacks until price breaks up above the old local high. We know that generally stop losses hide behind a key high or low and so price trading into it with such momentum is something to note when entering a trade at this level.
Liquidations for SOL are currently 50:50 long and short and so this balance shows no clear liquidation event in one particular way, at least not yet.
Bullish scenario -
SOL continues the rally above the range, strong volume to confirm that price is ready to expand beyond the area that failed in the past. A retest of $206 with a strong bounce gives this move a higher probability and proof buyers are still willing to buy at the level. Idea is invalid should price accept back below the range high, signifying buyers are not ready to sustain rally continuation.
Bearish scenario -
Price accepts below range high and shows that buyers are not willing to expend beyond the range. Naturally a retreat would then follow as the bears defend the same point that they successfully defended in the past (range high). Any price action that resembles chop within the red box would be a non action area as there is an area of balance giving no clear clue of direction either way.
SOL. 100% upside potential.If markets as a whole remains bullish, probability of this move is high. CRYPTOCAP:SOL price has been touching the middle of the channel with higher lows since May.

SOL Volatility Period: Around August 18
Hello, traders!
Follow us to get the latest information quickly.
Have a great day!
-------------------------------------
(SOLUSDT 1M Chart)
If the price stays above the M-Signal indicator on the 1M chart, the uptrend is expected to continue.
If it falls below 126.36, you should stop trading and observe the movement.
Since the HA-High indicator is forming at 179.74, the key question is whether it can find support near this level and rise.
The start of a stepwise uptrend is likely to begin with a rise above 237.60, the DOM (60) indicator level.
Therefore, the key point to watch is whether it can find support in the 179.74-237.60 range.
The DOM (60) indicator indicates the end of a high, while the HA-High indicator indicates a decline from a high.
Therefore, the 179.74-237.60 range can be considered a high boundary zone.
When the DOM (60) or HA-High indicator first forms, a decline is likely.
If the decline is followed by a rise near the HA-High or DOM (60) indicator, the likelihood of an upward breakout increases.
Therefore, if support is found around 179.74 this time, it is highly likely to lead to an attempt to rise above 237.60.
-
(1W chart)
The key area to watch on the 1W chart is whether the price can break above the 202.45-222.61 level.
If the price breaks above the 202.45-222.61 level and maintains its upward momentum, a stepwise uptrend is likely to begin.
-
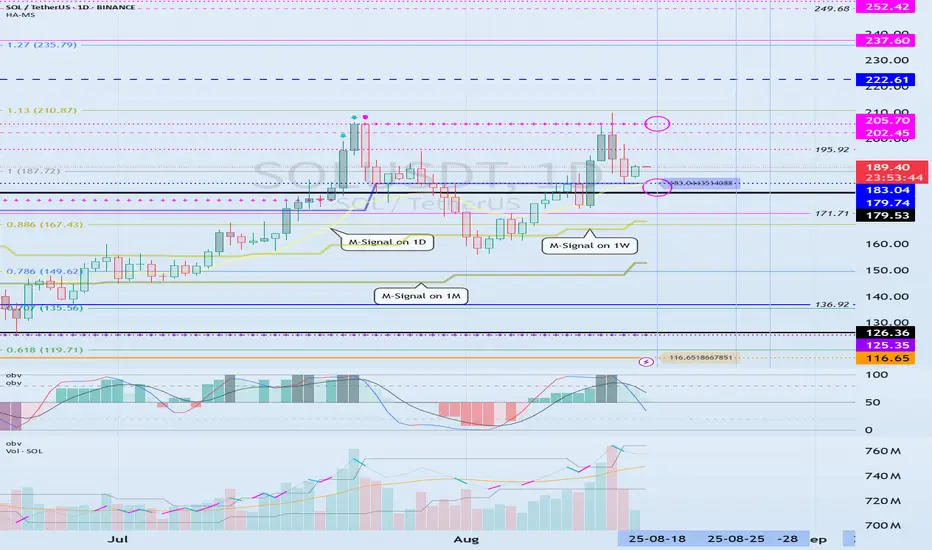
(1D chart)
The key area to watch on the 1D chart is whether the price can find support around 179.53-183.04 and rise above 205.70.
The 183.04 point is the HA-High indicator level, and the 205.70 point is the DOM (60) level.
If it falls below 183.04, it is expected to meet the M-Signal indicator on the 1W chart and re-establish the trend.
Ultimately, the price must remain above the M-Signal indicator on the 1M chart to maintain a strong uptrend.
Therefore, looking at the bigger picture, we need to determine whether the 126.36-179.53 range provides support and allows for an upward movement.
SOL's current volatility period is around August 18th (August 17th-19th).
At this time, we should look for a direction in which it deviates from the 183.04-205.70 range.
-------------------------------------------------
Only the concept of price moving averages, which I learned while studying chart analysis, is applied to the M-Signal indicator on the 1M, 1W, and 1D charts.
The rest of the explanation cannot be interpreted using existing chart analysis techniques.
This is because the HA-Low and HA-High indicators were developed for trading on Heikin-Ashi charts, while the DOM(60) and DOM(-60) indicators are a comprehensive evaluation of the DMI, OBV, and MOMENTUM indicators.
Therefore, to interpret my charts, you must apply the concepts of support and resistance points.
It's not that my chart explanations lack logic; they simply seem illogical because they can't be interpreted using existing interpretation methods.
Chart analysis should be as simple and concise as possible.
If you spend too much time analyzing charts or trying to apply complex theories, you will lack time to develop a trading strategy, increasing the likelihood of your trades going in the wrong direction.
To interpret my chart, all you need is a basic understanding of price moving averages and support and resistance.
Support and resistance points are determined by the horizontal lines of the DOM(60), HA-High, HA-Low, and DOM(-60) indicators.
The DOM(60) and HA-High indicators mark highs, while the HA-Low and DOM(-60) indicators mark lows.
Therefore, a basic trading strategy can be used: buy when the price rises from the DOM(-60) to HA-Low range, and sell when it reaches the HA-High to DOM(60) range.
However, if the price rises above the HA-High to DOM(60) range, a stepwise uptrend is likely, while if the price falls below the DOM(-60) to HA-Low range, a stepwise downtrend is likely.
Therefore, a segmented trading strategy should be adopted.
-
The basic chart for chart analysis is the 1D chart.
Therefore, it's best to trade in line with the trend of the 1D chart.
Therefore, the position that matches the trend of the 1D chart becomes the main position.
So, since the current trend of SOL's 1D chart is up, the LONG position becomes the main position.
To trade based on the trend of the 1D chart when trading futures, you need to set low leverage.
Therefore, when trading based on the timeframe chart you're viewing, increase your investment proportion when trading in line with the trend of the 1D chart. Conversely, when trading in the opposite direction, reduce your investment proportion and execute short, quick trades.
-
Thank you for reading to the end.
I wish you successful trading.
--------------------------------------------------
- This is an explanation of the big picture.
(3-year bull market, 1-year bear market pattern)
I will explain in more detail when the bear market begins.
------------------------------------------------------
SOLUSDT 4H
🔎 Chart Context
• Pair: SOL/USDT
• Exchange: Binance
• Timeframe: 4H (240M)
• Date: 16 August 2025
This chart uses price action + liquidity concepts (CH, FVG, liquidity grabs, demand zones) for projection.
📊 Key Observations
1. Recent Highs & Lows
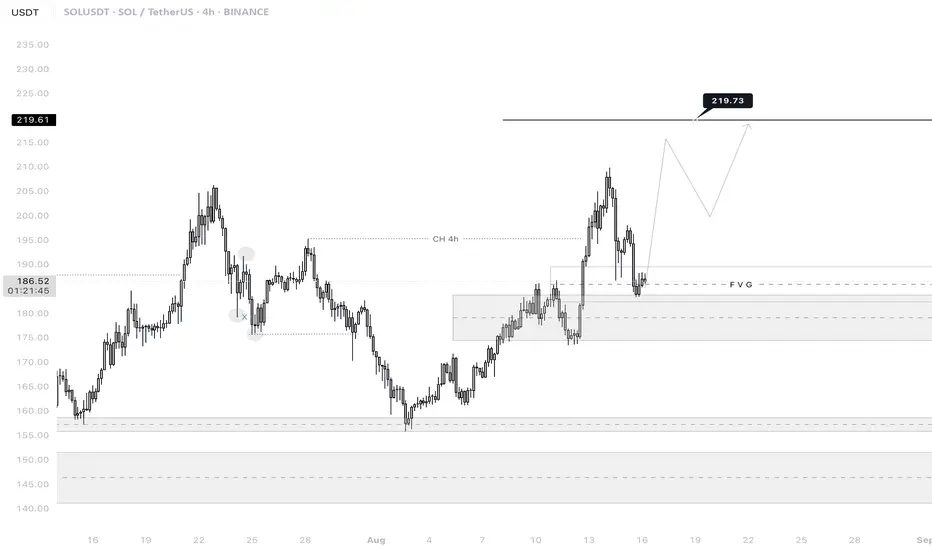
• Swing High: 209.86
• Previous High: 206.30
• Previous Lows: 173.43, 175.63, and 161.13
These levels represent liquidity points where orders are clustered.
2. Change of Character (CH 4H)
• Around 195.26, a CH (Change of Character) has been marked.
• This suggests that the bearish trend shifted into bullish momentum after reclaiming higher highs.
3. FVG (Fair Value Gap)
• The current price is retesting the FVG zone after rejecting from 209.86.
• FVG zones typically act as rebalancing levels where price either consolidates or launches into the next move.
4. Demand Zones
• 173.43 – 177.73: Strong demand area with previous accumulation.
• 155.83 – 157.23: Deeper demand zone that may act as a long-term support if the market drops sharply.
• Current reaction shows bulls protecting 173–177 zone.
5. Upside Target
• Next projected liquidity pool is at 219.73.
• This is above the 209.86 high, indicating liquidity sweep potential and continuation of bullish trend.
📈 Bullish Case (High Probability)
• Price held the FVG + demand block around 173–177.
• Higher High (209.86) confirmed a bullish structure.
• If momentum sustains, target = 219.73, where liquidity above old highs is likely to be taken.
• Expect potential retracement back to 195–197 before pushing up.
📉 Bearish Case (Low Probability but Possible)
• If SOL fails to hold 173–177 demand zone, we may see a deeper retracement toward 161–157 support zone.
• Losing that level would invalidate the bullish structure and turn the chart back into distribution mode.
⚡ Trading Plan
• Entry (Long): Accumulation around 173–177 (FVG/Demand zone).
• Target 1: 195–197 (partial take-profit).
• Target 2: 209.86 (previous high).
• Target 3 (final): 219.73 (liquidity sweep zone).
• Stop-loss: Below 173 (safe stop), or aggressive stop below 182.70 minor structure
#OL is aiming for the $259–$300 zone in the next bullish legSOL is aiming for the $259–$300 zone in the next bullish leg, as long as it holds above the $155–$130 support range. A break below this zone could delay the move, but momentum remains strong while above support.

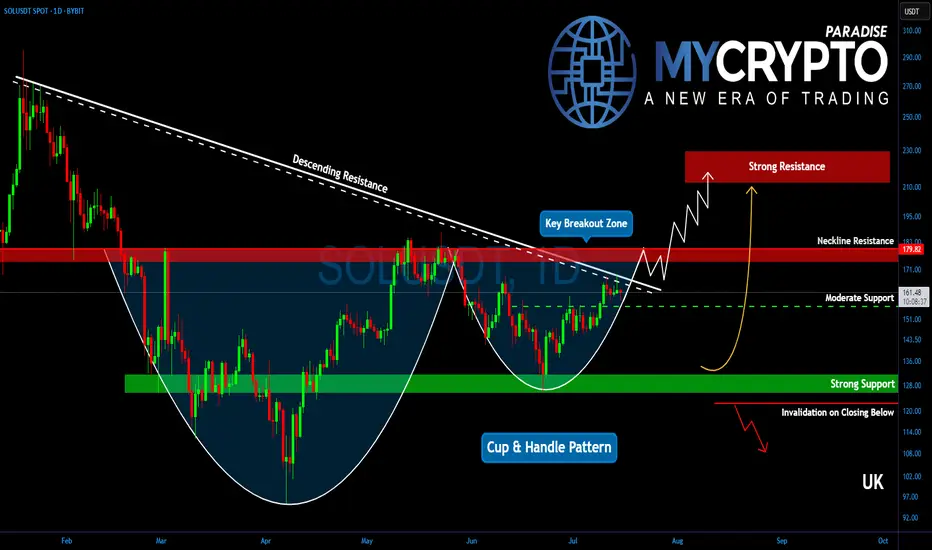
Will Solana Explode? This Important Zone Could Trigger a MoveYello, Paradisers! Is #Solana about to break free into a new bullish wave? After months of struggling under key resistance, the bulls are finally making a serious push… but only one zone stands between SOL and a potential explosion.
💎After peaking in January, Solana has remained suppressed under a descending trendline. But now, that trendline is being challenged aggressively, and the price structure is starting to form a reversal pattern that demands attention.
💎Right now, the most important level on the chart is the descending channel resistance at $167. Bulls are actively testing this zone, and if they manage to flip it into support, it could trigger a significant shift in momentum. But just above, at $180, sits an even more critical barrier, the neckline of the current reversal pattern. This entire region between $167 and $180 is the true battleground.
💎#SOLUSDT's confirmed breakout above $180 would be a major technical signal. It would likely send Solana toward the $210 to $225 zone, which marks a significant resistance area. This isn’t just psychological; it also aligns with the 61.8% Fibonacci retracement, a level where institutional players often begin offloading positions
💎As for the downside, support remains solid between $155 and $160. This region is protected by both horizontal demand and dynamic support from key moving averages, offering bulls a stable base to defend. Adding to the bullish case is a potential golden cross formation between the EMA-50 and EMA-200, a signal that, if confirmed, could inject even more confidence into Solana’s price action.
Paradisers, strive for consistency, not quick profits. Treat the market as a businessman, not as a gambler.
MyCryptoParadise
iFeel the success🌴