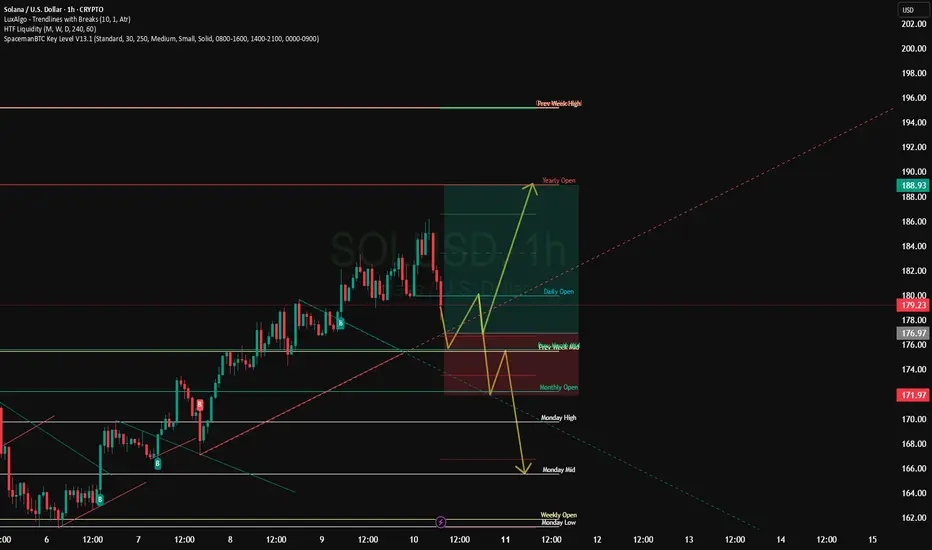
SOLANA Potential Bullish Continuation OpportunitySolana seems to exhibit signs of potential Bullish Momentum on the shorter timeframes as the price action may form a credible Higher Low with multiple confluences through key Fibonacci and Support levels which presents us with a potential long opportunity.
Trade Plan:
Entry : CMP
Stop Loss : 172
TP 0.9 - 1 : 207 - 209
Solanausdt

Solana is trading around $207-208, showing strong growth.1. Current dynamics
Solana is trading around $207–208, showing steady growth. During the last day, the price has added about 0.5–0.7%, with a weekly gain of about +8%.
2. General technical picture
On timeframes from 1 hour to a month, SOL receives a general “Strong Buy” signal; the pace slows down only on the minute chart.
Indicators confirm: RSI — ~62 (Buy), MACD — Buy, ADX shows a strengthening trend — also Buy.
3. Fundamental levels and scenarios according to TipRanks
The price is above MA100 and MA200, which forms a stable bullish base. However, the price is below EMA20, the signal is Sell, while EMA50 supports Buy.
Pivot points (pivot) approximately:
Support: $177-182
Resistance: $187-200
4. Short-term driver
SOL is trading around $204, forming a triple top at $210.
Breaking this resistance can lead to +10% growth, with targets at $218-$228, and then to $250.
Current indicators: RSI - ~67 (bullish), MACD - confirms bullish momentum.
5. Trading activity review
SOL is trading with a volume of about $7.2-7.7 billion. Market capitalization is about $112 billion.

Solana shows weak growth of +0.12%,Short-term support and resistance levels
Main resistance: $200 — SOL has already bounced off this mark, confirming its importance.
Support: $172 — a key zone where a reversal occurred earlier in early August.
Analytical review and scenarios for today
Financial sources indicate that SOL has turned bearish from $200, forming a "Bearish Engulfing" pattern. A pullback to $172 is possible.
Other forecasts believe that SOL is testing resistance at $188-190, and if broken, it may aim for $210-225.
Futures volume and open interest have grown significantly, indicating accumulating institutional interest and support for bullish dynamics.
Overview of other scenarios: technically, SOL is still neutral — mixed signals, but positive on-chain dynamics (for example, TVL) remain.

Solana: $178 Holds - Next Step To $200+📈 Solana (SOL/USD) – Technical Review — August 2025
- Support at $178 (20-day EMA) is keeping the price from falling. A rebound from this zone provided growth to $190-195. The current price is around $193.
- Technical “Buy” signals: Bitget is a pure BUY on the daily chart (13 Buy vs 4 Sell), TipRanks — Strong Buy, TradingView — Buy (weekly and monthly timeframes).
- Market volumes and dynamics: Growing trading volumes and maintaining upward dynamics confirm the upward momentum.
- Next growth targets: the nearest resistance is $200-205. A breakout of this range will open the way to an extension of the movement to the $220-250 area.
Conclusion: SOL is showing a solid bullish trend. Key area to watch is $178-$180: holding above confirms upside potential to $200+. Breakout of $200 will open the way to new highs.
Recommendation:
- Buy on dip: rebound from $178
- Buy breakout: on volume breakout of $200
- Stop-loss: can be placed below $178
- Targets: $200 → $220 → $250

SOL. 100% upside potential.If markets as a whole remains bullish, probability of this move is high. CRYPTOCAP:SOL price has been touching the middle of the channel with higher lows since May.

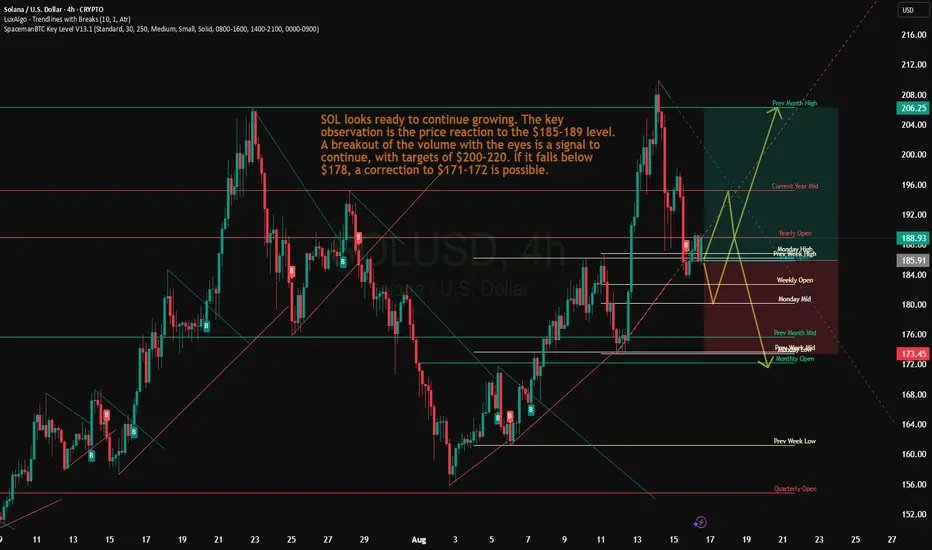
Solana - Don't miss it General background and conclusions
Solana is showing a pre-split state - neutral with an upward slope, holding above MA-200 and receiving confirmation from structural patterns.
Technical signals point to the importance of the $188 level: its breakout will open the way to $200-206 and potentially to $247.
In the short term, growth to $180 is possible if the direction is confirmed.
In the absence of volumes and strength, a downward movement to the lower support of $160 and further is possible.
Recommendations
Strategy "buy on breakout": entry at the close and holding above $188 with a target of $200-206. Alternative: buy on dip to $160 in case of a technical rebound.
Stop loss: it is reasonable to place it just below $160.
Additional monitoring: It is important to monitor the dynamics of volumes, price behavior around $188, as well as the development of fundamental drivers (ETF, Firedancer, etc.) in order to clarify the movement scenario.

Solana: $178 to $200+ - The Next Level on the PathSOL/USD Technical Review
Support around $178 (20-day EMA) is holding the price, indicating high buying interest.
The key resistance level is $185–$189. A breakout of this range will open the way to targets of $200–206, possibly even $220 if the momentum continues.
Pattern formation: an upward reversal from the $160 zone (lower Bollinger band + Fibonacci) is recorded, which completes the ABC correction and launches a new wave impulse. Upside potential is towards $180.
Trend and on-chain indicators: a decrease in the balance on exchanges, an increase in TVL and growing institutional interest (ETF) create a solid base for moving higher.
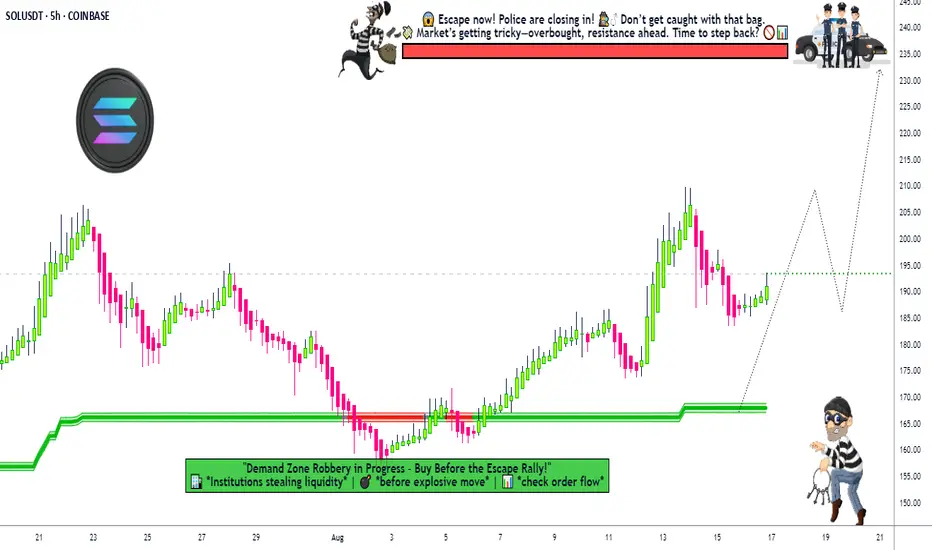
Is This the Perfect Time for a Solana Bullish Heist?🔥🚨 THIEF TRADER’S SOL/USDT HEIST PLAN! 🚨🔥
Asset: SOL/USDT "Solana vs Tether" | Plan: BULLISH HEIST MODE! 💰🎯
🎯 ENTRY: THIEF LAYER STRATEGY (MULTI-LIMIT ORDERS!)
"STEAL AT EVERY LEVEL!" 🏴☠️
📍 Layer 1: 190.00
📍 Layer 2: 185.00
📍 Layer 3: 180.00 (Add more layers if you’re a greedy thief!)
🚨 Thief Pro Tip: The more layers, the bigger the loot! Adjust based on your risk appetite.
🛑 STOP LOSS: THIEF ESCAPE ROUTE!
"DON’T GET CAUGHT!" 👮♂️
🔻 SL @ 173.00 (OG Thieves adjust SL based on risk!)
⚠️ Warning: Bears might set traps—stay sharp!
🎯 TARGET: POLICE BARRICADE AHEAD!
"CASH OUT BEFORE THEY CATCH YOU!" 🚔💨
🎯 Main Target: 240.00 (But escape early at 235.00 to be safe!)
💰 Thief Rule: Take profits like a ghost—disappear before the cops arrive! 👻
⚡ THIEF TRADING RULES:
✅ Scalpers: Only LONG side heists! Use trailing SL to lock profits!
✅ Swing Thieves: Stack layers & hold for the big score!
✅ Risk Management: Never risk more than you can steal!
📢 THIEF ALERTS!
🚨 News = Trap Zone! Avoid new trades during high-impact news!
🚨 Trailing SL = Your Getaway Car! Protect your stolen cash!
💥 BOOST THIS IDEA TO SUPPORT THE THIEF SQUAD!
"More boosts = Bigger heists next time!" 🚀💸
❤️ **Like, Share, & Follow for more CRYPTO HEIST PLANS!
⚠️ DISCLAIMER: This is NOT financial advice—just a Thief’s Master Plan! Trade at your own risk! 🎭
🚀 NEXT HEIST COMING SOON… STAY TUNED, THIEVES! 🏴☠️🔥
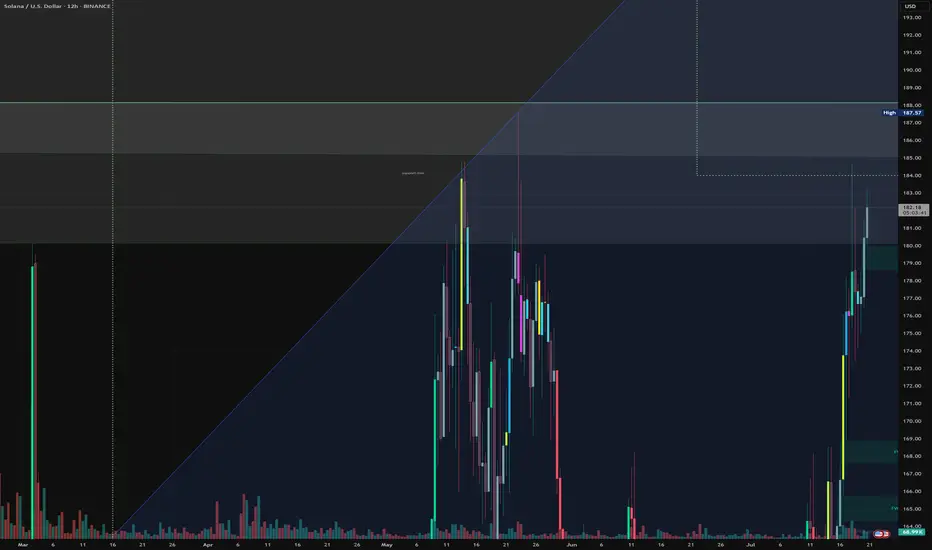
It’s Been a While... $SOL is back!
CRYPTOCAP:SOL has been stuck in a 100–200 range for a while now, with anything outside acting as a liquidity grab before reversing.
Back in March, the market was trying to print a bearish signal (obviously failed), so I didn’t have a clear picture then. Now, it’s back on track.
The monthly isn’t as satisfying as other charts—candle lacks strength and closed below the yearly open. That said, price just tapped the $100 range low, so naturally the next big expectation is a break above $200 with conviction and new highs.
I don’t think CRYPTOCAP:SOL will be the highlight of crypto this cycle, but there’s still a potential 2x from here worth taking advantage of.
Solana - is showing reversal signalsTechnical structure and patterns
On the daily chart, SOL has formed an inverse head and shoulders pattern, a classic reversal pattern. A breakout above the neckline with increasing volume could lead to a move to $247.71. However, weak demand could jeopardize this scenario, triggering a fall even to $138.05.
The asset has grown by 18% in a week, reaching $181, but there are liquidation clusters and strong resistance at $184–185. A breakout of this range could accelerate growth, with a possible surge to $256.
Support and resistance levels
Resistance:
The key zone is $180–184, a breakout of which would open the way to growth.
Support:
Important zones are $153–143, where cumulative activity was previously observed.
Network background and volume dynamics
The number of tokens on exchanges has decreased by almost 10%, which indicates a decrease in selling pressure. A "golden cross" is also forming between the 100- and 200-day EMAs - a bullish signal with target levels above $176.
Earlier, SOL rebounded from the support zone around $160 and is moving towards a breakout of $175. The further trajectory - growth or consolidation - will depend on how the price behaves at the border around $175.
"SOL/USD BULLISH HEIST! Steal Profits Like a Pro"🏆 "SOLANA HEIST ALERT! 🚨 Bullish Loot Ahead – Thief Trading Style (SOL/USD)" 🏆
💸 Steal Profits Like a Pro – Day/Swing Trade Plan 💸
🌟 Greetings, Market Pirates & Profit Raiders! 🌟
Hola! Bonjour! Hallo! Marhaba! 🤑 Dear Thieves & Trend Snipers, the SOL/USD vault is WIDE OPEN! Time to execute the heist with precision.
🔥 THIEF TRADING MASTER PLAN 🔥
🎯 Mission: LONG SOLANA (Escape Near Blue ATR Line)
⚠️ Danger Zone: Overbought | Consolidation | Bear Trap Ahead
🏆 Rule: "Take Profit & Treat Yourself – You’ve Earned It!" 💪💰
📈 ENTRY STRATEGY (The Heist Begins!)
"SWIPE THE BULLISH LOOT!" – Enter at any price, but smart thieves use:
Buy Limit Orders (15-30min timeframe)
Swing Low/High Pullbacks for optimal entry
DCA/Layering Strategy (Multiple limit orders for max loot)
🛑 STOP-LOSS (Escape Plan)
📍 Thief SL: Below nearest low (Daily MA @ $160.00)
⚠️ Adjust SL based on: Risk tolerance, lot size, & DCA layers.
Pro Tip: Tighten SL if market flips bearish!
🎯 TARGETS (Profit Escape Routes)
🎯 Main Take-Profit: $220.00 (or exit earlier if momentum fades)
🧲 Scalpers: Only LONG! Use trailing SL to lock gains.
💰 Big Bank Thieves: Go all-in. Smaller Raiders: Join swing traders.
📰 WHY SOLANA? (Fundamental Boosters)
Bullish Momentum (Tech + Sentiment Driving Price)
Macro Trends, On-Chain Signals 👉 Check Liinkss 🔗
Intermarket Analysis: Crypto & equities syncing for gains!
⚠️ TRADING ALERTS (News & Risk Control)
🚨 News = VOLATILITY! Avoid new trades during major releases.
🔒 Protect Running Trades: Use trailing stops to secure profits.
💥 SUPPORT THE HEIST! (Boost & Win Together) 💥
🔥 Hit the "LIKE" & "BOOST" button to strengthen our Thief Trading Squad!
🚀 More Heist Plans Coming Soon – Stay Tuned! 🤑🎉
📌 Reminder: This is NOT financial advice – DYOR & manage risk!

Solana bulish Have you ever stayed in a winning trade just to get more?
That voice whispering “keep it longer, this might be the big one”?
It’s the same voice that’s emptied thousands of portfolios...
Hello✌️
Spend 2 minutes ⏰ reading this educational material.
🎯 Analytical Insight on Solana:
SOLUSDT
has seen healthy volume recently and is testing key daily support along with an important trendline. Holding these zones could fuel a 15%+ rally toward the $199 mark 📊🚀
Now, let's dive into the educational section,
🧠 The Psychology of Greed: Profit’s Evil Twin 😈
When you enter a trade and it starts moving in your favor, your subconscious kicks in. Suddenly, your brain whispers: “Just a little more... hold it!”
That’s when the greed game begins.
No matter how well you planned before the trade, once you're in profit, your brain creates a fantasy. A future where profits double, triple... a dream world. And this dream is exactly what makes traders give back everything including their original capital.
Our minds are wired to crave the rush of winning again. It’s like a hit of dopamine. So you hold the position even when the chart is flashing reversal signs. That’s the setup for disaster...
📉 Take-Profit Levels: Why Getting Out Is the Real Win 📌
Here’s the cold truth
If you don’t exit when you planned to, that profit was never really yours
A take-profit isn’t just a number. It’s a psychological boundary that separates a disciplined trader from an emotional one. Many beginners think setting a TP means giving up potential gains but in reality, it means respecting your plan and your capital.
You’ll always have another chance to trade. Always
But if greed wipes out your funds, there’s nothing left for the next opportunity
Each trade is just a chapter, not your whole story.
🧪 The Social Media Trap: When Your Brain Stops Thinking 📱
Online hype is poison. From “X coin just did 100x” to “I made $50K in a weekend” your brain gets hijacked.
You start chasing fantasies, not trades
That illusion of overnight success makes you ignore your own strategy. You stop following your plan and start trying to copy people who probably aren’t even real.
This is how social media slowly pushes traders into ruin
You feel left behind and that fear pushes you into greedy irrational decisions.
🔧 TradingView Tools That Help You Beat Greed 🛠
Luckily, TradingView offers several tools that can help keep your greed in check and your head clear
Alerts
Set an alert at your take-profit zone so you don’t keep staring at the chart. Let the system notify you when it’s time.
Long/Short Position Tool
Use this to visually define your entry, TP, and SL. Seeing it on the chart makes it easier to stick to your plan.
Bar Replay
This is gold for practice. Rewind price action and practice exits. See how often greed would’ve destroyed your trades.
Notes
Add reminders to your charts. Write things like “Exit at 2500 don’t overstay.” When future-you sees that message, it helps stay on track.
These tools don’t just improve your trades. They show discipline. And that’s exactly the kind of analysis editors look for when picking Editor’s Choice posts.
🚪 Final Words: In and Out, That’s the Game 🎯
Taking profit is a skill but exiting on time is an art
If you learn to respect your plan and silence greed, you’ll protect your capital and your sanity
There’s always a next trade if you survive this one
✨ Need a little love!
We pour love into every post your support keeps us inspired! 💛 Don’t be shy, we’d love to hear from you on comments. Big thanks, Mad Whale 🐋
📜Please make sure to do your own research before investing, and review the disclaimer provided at the end of each post.

Solana - The bullish background remains strongCurrent Technical Signals
SOL is trading around $180-$181, holding above the key 20-day EMA, which is around $178.25. A break below this level could open the way to support around $171.78, while holding above this level creates potential for a rise towards $186.40-$190.47.
A golden cross is forming between the 100- and 200-day EMAs on the daily chart - a classic bullish signal, strengthening the chances of a rise to $200.
Your network volume and balances on exchanges are showing a decline, which indicates a decrease in supply - easing pressure on the price and supporting bullish sentiment.
Support and Resistance
Support:
$178.25 (20‑EMA)
$171.78 — lower limit in weak market
The Currency analytics
Resistance:
$180–$190 zone — critical for further gains
Upper resistance at ~$200 — critical for rally continuation
Structural and Valuation Signals
A test of the daily bullish divergence on SOL indicates potential for further gains after correction.
SOL recently broke out of its ascending channel, indicating a possible reversal and the beginning of a new move higher.
Finance Feeds

Solana - Current Technical LandscapeCurrent Technical Landscape
Key Support Zone - 20-day EMA (~$178.25): SOL is trading around $180, and a break below this level could lead to a decline towards $171.78. On the other hand, a bounce back would open the way to the $186.40 and $190.47 areas.
Short-Term Weakness and Cooling Activity: Despite growing by over 40% in July, there is now a decline in on-chain activity:
Active Addresses Down 16%
DeFi TVL Down 8%
This could increase bearish pressure in the short term.
Resistance on the 4-hour chart: According to Seeking Alpha, SOL faces strong resistance at the 20-EMA (~$164.78) and below the 50/100-EMA zones (between $170.73 and $174.14), while the downtrend remains dominant.
Structure overview and signals
TipRanks indicators:
General recommendation: Sell
RSI (~43.05): Neutral
MACD: Buy
Stochastic RSI, Williams %R, CCI: Buy
MA 20/50/200: mostly Sell, except MA100 (was Buy)
TipRanks
Support and resistance by Pivot (TipRanks):
Pivot: $166.49
Support: $163.12, $158.24, $154.87
Resistance: $171.38, $174.74, $179.6
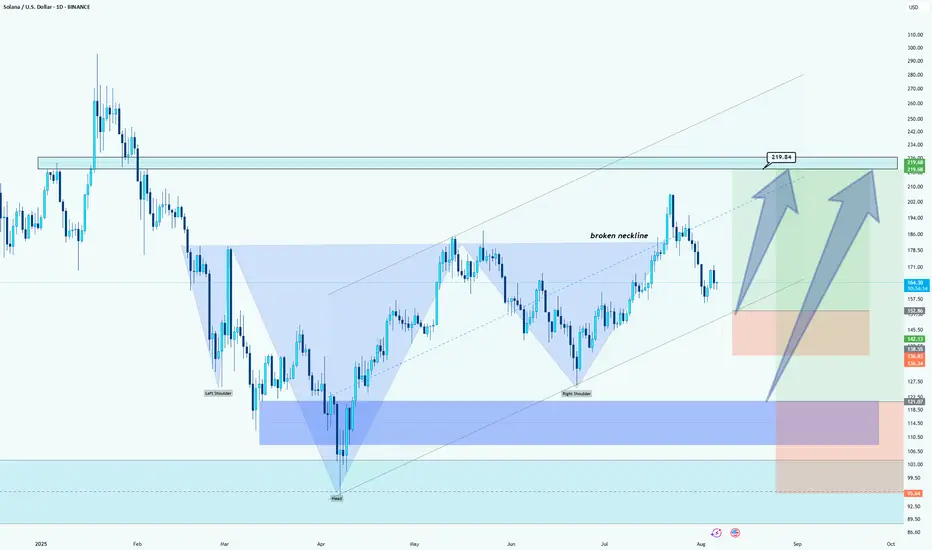
Solana (SOL): Bullish Continuation after Neckline BreakoutWhat I see:
Chart Patterns (Head and Shoulders): The chart illustrates a classic "Head and Shoulders" pattern. The left shoulder, head, and right shoulder are formed, and the neckline (the blue dashed line) has been broken, which suggests that the price could rise towards the target zone above the broken neckline.
Target Price: Based on the pattern and technical analysis, the potential target for the price could be around $219.84, as indicated by the box in the upper right corner. This target aligns with the upward trend continuation from the broken neckline.
Support Zones: There are several key support levels below the current price, including the lower zone marked in blue around $95.50 and the potential demand area in the middle blue zone (around $136.34). These could act as areas for price to rebound from if there's a pullback.
Trend Line and Movement: The dotted blue trend line suggests an ascending trend, showing higher lows, and the price is likely to continue upward after the recent breakout above the neckline.
Given the broken neckline and the formation of the Head and Shoulders pattern, the bullish scenario appears more likely. A price target of around $219.84 seems feasible if the upward momentum continues. However, if the price fails to hold above the neckline or reverses, the support zones could provide areas for potential price bounces, with the $136.34 region as a significant level to watch for possible buying opportunities. Therefore, the most probable outcome aligns with the bullish scenario (towards $219.84).
SOL Institutional Capital Fuels Bull Run SpeculationSolana's Ascent: A Perfect Storm of Adoption and Institutional Capital Fuels Bull Run Speculation
A powerful and rare confluence of tangible real-world adoption, significant institutional investment, and bullish technical indicators is generating a palpable buzz around Solana (SOL). The high-performance blockchain, often touted as a leading "Ethereum killer," is experiencing a resurgence that has captured the market's attention. After a period of sideways consolidation, SOL has decisively broken through key psychological and technical price levels, igniting speculation that this may be the start of a sustained and powerful bull run.
The narrative driving this optimism is not based on fleeting hype but on two concrete, fundamental pillars. The first is the global shipment of Solana Mobile's second-generation smartphone, the "Seeker," a device engineered to onboard millions into the Web3 ecosystem by seamlessly integrating crypto into the user's daily life. The second is a powerful vote of confidence from the traditional finance world, where a growing number of publicly traded companies are aggressively accumulating SOL for their corporate treasuries, treating it as a strategic reserve asset. As these foundational tailwinds gather force, technical charts are beginning to align, suggesting that the path of least resistance for Solana's price may soon be sharply upward.
The Seeker Phone: Solana's Trojan Horse for Mass Adoption
Perhaps the most visible and innovative catalyst is the global rollout of the Seeker smartphone. Following up on its first-generation "Saga" device, Solana Mobile has initiated the shipment of tens of thousands of pre-ordered Seeker phones to a global audience. The market's reception has been nothing short of explosive, with pre-orders soaring past 150,000 units—a dramatic increase from the 20,000 total sales of its predecessor. This overwhelming demand underscores a pent-up desire for a mobile-native Web3 experience.
But the Seeker is far more than just a piece of hardware; it represents a strategic masterstroke to solve the persistent problem of user experience in the crypto space. For years, interacting with decentralized applications (dApps) on mobile has been a clunky, insecure, and fragmented process, creating a high barrier to entry for the average consumer. The Seeker directly addresses these pain points. It features a built-in crypto wallet and a hardware-isolated "Seed Vault," which secures a user's private keys in a protected environment within the phone, drastically enhancing security and simplifying transactions.
This mobile-first approach creates a powerful economic flywheel. Priced accessibly, the phone is projected to generate substantial revenue for Solana Mobile. However, its true value lies in its ability to foster a vibrant, self-sustaining ecosystem. Each device includes a "Genesis NFT," a digital key that unlocks exclusive airdrops, rewards, and early access to new applications. This model, which proved incredibly successful with the Saga phone and the famous BONK memecoin airdrop, gamifies participation and incentivizes users to actively explore and engage with the Solana network. It transforms the phone from a passive communication tool into an active portal for decentralized finance (DeFi), NFT marketplaces, and Web3 gaming.
Furthermore, the Seeker boasts its own decentralized dApp store, presenting a direct challenge to the incumbent duopoly of Apple and Google. By offering developers a platform with lower fees and fewer restrictions, Solana is cultivating an environment where innovation can flourish. This attracts builders to the ecosystem, leading to a richer and more diverse array of applications, which in turn attracts more users. The Seeker phone, therefore, is not just a product—it's a Trojan Horse designed to embed the Solana network into the fabric of daily life, driving network utility, transaction volume, and ultimately, sustained demand for the SOL token.
The Institutional Stampede: Big Money Places Its Bet on Solana
While the Seeker phone provides a compelling grassroots adoption narrative, it is the concurrent wave of institutional investment that adds a powerful layer of validation and financial firepower. A growing cohort of publicly traded companies is now strategically adding SOL to their corporate treasuries, signaling deep-seated, long-term confidence in the network's technology and economic potential. This trend moves Solana beyond the realm of speculative trading and into the domain of strategic corporate finance.
Leading this charge is DeFi Development Corp (DFDV), a firm that has made headlines with its aggressive accumulation strategy. The company recently purchased an additional 110,466 SOL, bringing its total holdings to a staggering 1.29 million SOL. This move is part of a publicly stated ambition to hold one SOL per outstanding company share by 2028, a strategy explicitly modeled after MicroStrategy's high-conviction Bitcoin treasury plan. By securing a multi-billion dollar line of credit for these purchases, DeFi Dev Corp is making a clear and unequivocal bet on Solana's future.
This institutional embrace extends beyond a single entity. Upexi Inc., a consumer brand holding company, has significantly increased its SOL holdings and secured a $500 million credit line for further acquisitions. Bit Mining, a prominent player in the digital asset mining space, has not only purchased millions of dollars worth of SOL but has also launched its first Solana validator, contributing directly to the network's security and decentralization. Perhaps most surprisingly, Artelo Biosciences, a Nasdaq-listed pharmaceutical company, has pivoted to include SOL in its treasury, becoming the first public pharma firm to adopt a digital asset as a reserve.
These companies are drawn to Solana for its unique combination of high throughput, low transaction costs, and yield-bearing potential. The network's ability to process thousands of transactions per second at a fraction of a penny makes it a viable platform for enterprise-grade applications. Furthermore, the ability to stake SOL and earn a consistent annual yield of 7-8% presents a compelling alternative to holding depreciating fiat currencies or low-yield government bonds. This makes SOL an attractive treasury asset that can both appreciate in value and generate a recurring revenue stream. This institutional inflow provides robust price support and has an outsized market impact, as it effectively removes large quantities of SOL from the circulating supply, creating a potential supply shock as demand continues to grow.
Coiling for a Breakout: A Technical Perspective
This potent mix of fundamental catalysts is vividly reflected in Solana's price chart, which shows the asset coiling for a potentially explosive move. After establishing a solid foundation of support, SOL has demonstrated significant strength by breaking through the crucial $160 and $162 levels. The price is now trading firmly above its 100-hourly simple moving average, a key indicator that traders use to gauge short-term trend momentum. A price holding above this moving average is generally considered a sign of bullish health.
Currently, a key bullish trend line has formed on the hourly chart, with immediate and strong support located at the $165 mark. This level now acts as the first line of defense for the bulls; as long as the price remains above it, the upward trajectory is considered intact. However, the path higher is not without obstacles. The first major test awaits at the $172 resistance zone. A decisive and high-volume break above this level would signal that buyers are in firm control and could trigger a cascade of further buying.
Should the bulls conquer $172, the next significant hurdle lies near the $180-$182 range. Overcoming this area would open the door to a more sustained rally, with analysts eyeing subsequent targets at $192 and the psychologically important $200 level. While these technical levels present challenges, the underlying momentum indicators are encouraging. The Moving Average Convergence Divergence (MACD) is showing bullish acceleration, and the Relative Strength Index (RSI) is holding strong above the 50 midpoint, indicating that buying pressure is outweighing selling pressure.
Of course, no market moves in a straight line. A failure to break the $172 resistance could lead to a temporary pullback. If the $165 support level were to fail, the next support zones would be found near $160 and $155. A break below these levels could signal a short-term bearish reversal and would invalidate the immediate bullish thesis. However, given the powerful fundamental drivers at play, many analysts believe that any such dips would likely be viewed as buying opportunities.
The Verdict: Is This the Definitive Catalyst?
Solana currently finds itself in an exceptionally strong position. It is one of the few blockchain projects that can boast a clear, tangible strategy for mass adoption through its mobile initiatives. The Seeker phone is a game-changer, providing a seamless on-ramp to Web3 that could onboard a new generation of users.
This powerful fundamental narrative is being amplified and validated by a wave of institutional capital. The strategic accumulation of SOL by public companies lends the asset a new level of legitimacy and provides a powerful source of demand that is unlikely to waver based on short-term market fluctuations.
When these two forces are combined with a bullish technical structure, the result is a perfect storm of positive catalysts. While the broader crypto market will always be subject to macroeconomic factors and regulatory shifts, Solana has carved out a uniquely compelling growth story. The immediate challenge is for the bulls to maintain their momentum and decisively break through the upcoming resistance zones. If they succeed, this confluence of events may very well be remembered as the definitive catalyst that propelled Solana into its next major bull run, solidifying its position not just as a competitor, but as a leader in the new digital economy.
SOLUSDT📊 #SOLUSDT
⏱ TIME: 1D
⭕️risk: mid
📍The initial buying market: 168-169
📌TP1: 192$
📌TP2: 224$
⛔️SL: 144$
❌These analyzes are just to give a better perspective for you dear ones
Do not base on buying and selling❌

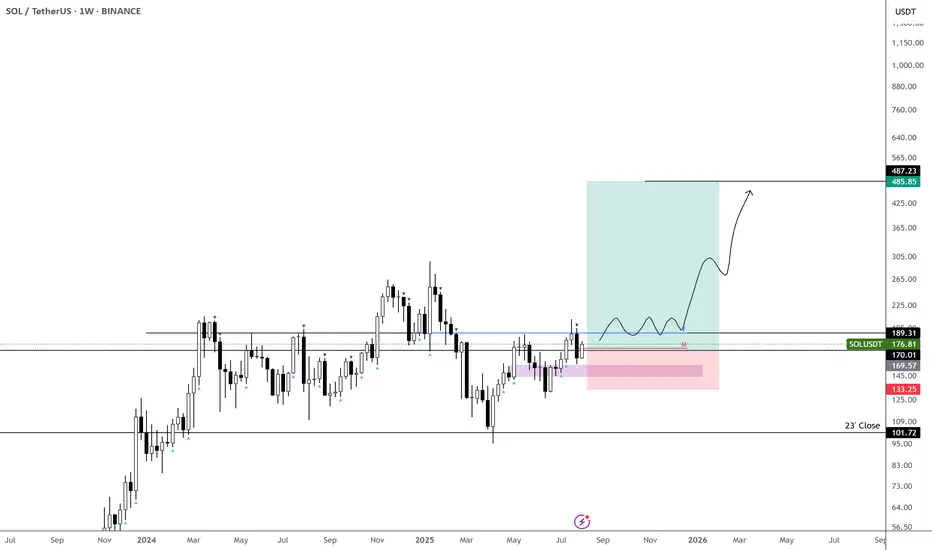
Still bullish in the higher time frames Solana has been struggling to break and stay above $170-200 zone this cycle.
It has been a very difficult asset to trade, however, I can see more bullish setups than bearish setups in higher timeframe charts.
Monthly:
1) July monthly candle closed above Fib 0.618 and formed higher high higher low.
2) RSI and MACD are still in the bull zone.
3) Stochastic are in the bear zone, but they are pointing to the upside.
Weekly:
1) EMA21 is still above EMA55.
2) The current weekly candle is forming bearing engulfing candle, however, there are two more days before it closes. It is still above EMA 21.
3) RSI orange line (RSI based moving average) is moving upwards and entering the bull zone.
4) MACD is about to enter the bull zone.
5) Stochastic hasn't reached overbought territory yet.
6) The set up of these three momentum indicators is very similar to the set up in Oct 23 before Solana started a massive bull trend. (see red vertical line)
Daily:
1) EMA21>EMA55>EMA200
2) As I said in the previous articles, EMA 55 and 200 don't cross easily. But when they do, the price often pulls back significantly before it starts to move in the direction of the trend.
3) Daily candle broke below EMA21, however, the price is reacting strongly to EMA55.
4) The price is still higher high higher low.
I will wait and see if the price is going to bounce off from $143 -157 region. (see blue rectangular block).

SOLANA could have a major retracement Solana completed a major ABC correction into a supply zone on the higher time frame (HTF), taking out the previous quarter’s highs.
On the daily chart, the RSI is overbought and signals the potential for a significant retracement.
Price action on the 4-hour chart shows a series of lower highs, indicating a bearish trend. If Solana fails to break above the previous high and trigger a market structure shift, the downtrend is likely to continue, leading to a deeper retracement on the higher time frames.

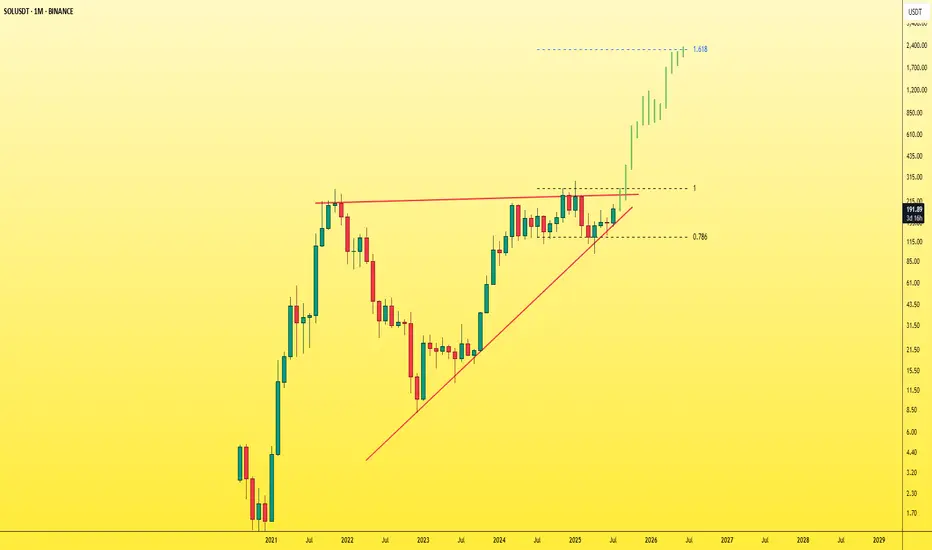
SOL - Don't miss the breakout before it's too late!The symmetrical triangle pattern on the monthly timeframe is showing signs of weakening after multiple failed breakout attempts — and now, a breakout seems highly likely.
Once SOL breaks out of this triangle, it will enter price discovery mode , opening the door to a massive bullish move. At that point, most traders will start saying “it’s too late”, while SOL keeps rallying aggressively — fueled by FOMO and liquidity traps.
You'll see:
- People outside the market waiting for a pullback that never comes.
- Traders inside the move getting shaken out by small dips and volatility.
Right now, SOL is still in a fair trading zone and available at a reasonable price .
Don’t wait for it to explode and then chase. Get in before the breakout .
Best Regards:
Ceciliones🎯
Solana Price Faces Reversal At $200 As Profits Hit 5-Month HighBINANCE:SOLUSDT price has risen 21% in the past week , now trading at $199. Despite breaching the $200 mark, Solana has failed to maintain this level, marking a five-month high.
The Net Unrealized Profit/Loss (NUPL) indicator for BINANCE:SOLUSDT shows that profits have reached a five-month high . This signals that many investors are in profit, raising concerns about a potential sell-off.
If these factors hold true, BINANCE:SOLUSDT price could decline toward the support levels of $188 or even drop to $176 . A move below these levels could erase a significant portion of the recent gains and shift the altcoin into a bearish trend.
However, if investor confidence remains strong and the market continues to show bullish signs, BINANCE:SOLUSDT could stabilize above $200 . Securing this level as support could propel the price back toward $221, invalidating the bearish outlook.
SOLUSDT on Fire! Bullish Wedge Fuels INSANE Upside Potential!BINANCE:SOLUSDT has been exhibiting strong bullish momentum, currently trading within a broadening wedge pattern. This technical structure often signals increased volatility and the potential for decisive moves in either direction. In the present scenario, the breakout above the psychological $200 resistance level suggests that bulls are firmly in control, fueling hopes of further upside.
The continuation of momentum hints at the market preparing for another leg up. The immediate price target lies at $300, where traders may expect some profit-taking and resistance. However, should momentum sustain and buying pressure persist, BINANCE:SOLUSDT has the potential to surge toward the $700 region, aligning with the pattern’s projected price expansion.
As always, managing risk is key. Use a well-placed stop loss below the support level to protect your capital. Breakouts can be explosive, but discipline and proper risk management make all the difference.
BINANCE:SOLUSDT Currently trading at $201
Buy level : Above $200
Stop loss : Below $150
Target 1: $250
Target 2: $300
Target 3: $500
Target 4: $700
Max leverage 2x
Always keep stop loss
Follow Our Tradingview Account for More Technical Analysis Updates, | Like, Share and Comment Your thoughts

SOLANA - BULLISH & BAERISH
Hello everyone,
here is my current outlook on Solana (SOL):
Personally, I am currently only watching Solana as we may already be in a correction phase. Nevertheless, there is an interesting scenario where we could still be in a green wave 5, which could potentially reach prices above USD 300.
Possible course:
In April 2025, the bottom may have been found following an ABC formation.
Wave 1 (yellow) could be completed in May 2025.
Wave 2 (yellow) could end in June 2025.
We could currently be in wave 3 (yellow).
Important point to watch:
If the price does not make it sustainably above the yellow wave 1 (approx. USD 190), the probability increases strongly that we are still in a B wave.
This would mean that we are still in a major correction, which could theoretically take us back to around USD 60. In this scenario, wave 1 would have already ended in January 2025 and we would still be in the correction of wave 2.
Conclusion:
The indicators are particularly important in this phase. Keep a close eye on them to better understand the structure.