Solana (SOL) - November 7Hello?
Welcome, traders.
By "following", you can always get new information quickly.
Please also click "Like".
Have a nice day.
-------------------------------------
(SOLUSD 1W Chart) - Mid-Long-Term Perspective
Above 61.44-72.85 section: expected to continue upward trend
Above section 108.38-152.84: Expected to create a new wave.
Currently, it is rising 4 times the ascent of section A.
It is necessary to check whether the rise corresponding to the ascent width of section B comes out and touches section 317.55-333.37.
(1D chart)
If the price is maintained above the 238.46-254.28 range, a move is expected to move up to the 285.92 point.
An important segment of this ATH update is the 179.45-199.83 segment.
So, you need to make sure the price stays above the 179.45-199.83 range.
-----------------------------------------------------
(SOLBTC 1W chart)
------------------------------------------
We recommend that you trade with your average unit price.
This is because, if the price is below your average unit price, whether it is in an uptrend or in a downtrend, there is a high possibility that you will not be able to get a big profit due to the psychological burden.
The center of all trading starts with the average unit price at which you start trading.
If you ignore this, you may be trading in the wrong direction.
Therefore, it is important to find a way to lower the average unit price and adjust the proportion of the investment, ultimately allowing the funds corresponding to the profits to regenerate themselves.
------------------------------------------------------------ -----------------------------------------------------
** All indicators are lagging indicators.
Therefore, it is important to be aware that the indicator moves accordingly with the movement of price and volume.
However, for the sake of convenience, we are talking in reverse for the interpretation of the indicator.
** The MRHAB-O and MRHAB-B indicators used in the chart are indicators of our channel that have not yet been released.
(Because it is not public, you can use this chart without any restrictions by sharing this chart and copying and pasting the indicators.)
** The wRSI_SR indicator is an indicator created by adding settings and options to the existing Stochastic RSI indicator.
Therefore, the interpretation is the same as the traditional Stochastic RSI indicator. (K, D line -> R, S line)
** The OBV indicator was re-created by applying a formula to the DepthHouse Trading indicator, an indicator disclosed by oh92. (Thanks for this.)
** Support or resistance is based on the closing price of the 1D chart.
** All descriptions are for reference only and do not guarantee a profit or loss in investment.
(Short-term Stop Loss can be said to be a point where profit and loss can be preserved or additional entry can be made through split trading. It is a short-term investment perspective.)
Solbtc

SOL/BTC buy opporunityHi followers,
BINANCE:SOLBTC Just recently finished a big ABC correction, which was followed by a very nice bullish flag.
Will this setup play out to reach previous all time high?
Don't forget to manage your risk! 👌
Good luck and trade with care 🙏
If you like my content - 👍 Like, 💬 comment, 👆 follow and 👉 share!
❗❗❗
Disclaimer: This information is not a recommendation to BUY or SELL. It is to be used for educational purposes only

SOL - is going to break this trendline 🔥🔥SOL is back to its all-time high. The first time the price broke this level but could not move higher. This was followed by a small pullback. Now the price is back to the level and it is starting to squeeze. This is a good signal for a breakout and continuation of growth. Also worth mentioning is the rising lows, which is also a good signal for growth. A good buying opportunity could be after a breakdown.
Write in the comments all your questions and instruments analysis of which you want to see.
Friends, push the like button, write a comment, and share with your mates - that would be the best THANK YOU.
P.S. I personally will open entry if the price will show it according to my strategy.
Always make your analysis before a trade.

SOLANA triangle breakoutSolana broke up this triangle 📐 and I think there is chance for run to 237 and even higher. Setting BUY LIMIT order to catch the pullback and add to my bag. Check the other triangle breakouts in related ideas. SOL , just show us some love!💕
ENTRY : local high @ 149
SL : local low @ 128
TARGET : height of the triangle projected from midpoint of the local range (BUY STOP-LIMIT - SL) @ 237
RRR : 4.3
INVALIDATION : when SL level hit
Please like👍, comment🗣️, follow me✒️, enjoy📺!
⚠️Disclaimer: I'm not financial advisor. This is not a financial advice. Do your own due dilingence.

SOLUSDT Technical Analysis⏳ Spot
💎 SOLUSDT has formed a triple top under a significant Resistance. After the breakout it is going for a retest and after the rejection I expect that it continues the Bullish move
🌐 Tradingview
🏁 Short & Medium Term
💵 Invest Only 5% of your Portfolio
🎳 Entry at Market or at 215.91 - 219.03
☕️ TP1 232.39
🍺 TP2 249.85
🍻 TP3 270.06
🍾 TP4 291.25
🍷 TP5 315.00
🍸 TP6
🍹 TP7
🎁 TP8
🚫 SL 210.00
Good Luck 🎲
Check the Links in Description and If you LIKE this analysis, Please support our page and Ideas by hitting the LIKE 👍 button. ❤️ Your Support is really appreciated! ❤️
Traders, if you have your own opinion about it, please write your own in the comment box. We will be glad for this.
Feel free to request any pair/instrument analysis or ask any questions in the comment section below.
We will have more FREE forecasts in TradingView soon
Have a profitable day 😊👍🏻

#SOL/BTC [ SOLANA ]#SOLBTC chart is looking good after the breakout of the trendline and a retest - the price now is in very interesting area and could see a nice upward move from here.
My potential targets are:
0.0034944
0.0036238
0.0038180
0.0040121

🔥 SOL / USD — SOLANA Trading 🔥 Pump it up!Hey!, seems like solana on the verge of breakout to NEW ATH.
I am considering 2 targets:
248 and 300 in short-term or up to 3 weeks.

Buy SOLANA and WAGMIANOTHER FLAGGG. LSSSSGOOOO
SOL annual conference is coming next week 7th November. REMEMBER THIS.
Big partnerships will be announced, we can easily see a 50% to 2x
PS sol is my fav coin
WGMI = We all gonna make it
Cheers🥂

SOLBTCSolana has broken its white dynamic resistance and after this correction can continue its upward movement.

SOL $200 breakthrough and attempt to defendSOL has made an important breakthrough and is preparing to defend its new price level, $200 is a very important level, we will see if the trend continues

SOL/USDT did 55% profit and still Bullish toward $400#Solana update:-
#solusdt did 55% after breakout.
Still bullish toward $400
Support:- $140/$100

SOL: Head and shoulders forming (?)Just set a few buy orders just in case this plays out. Could be invalidated at any time since the coin itself is strong, even tho the current gaming narrative doesn’t help it.
Good luck!

Solana/USD About to Moon?Solana has held the Fibonacci golden pocket as support, and has now broken the corrective trendline, confirming the bull market. We’re looking for price to have a continued upside, targeting the 27% fibonacci extension at the price of USD 235. Our idea would be no longer valid if price breaks below the fibo golden pocket and trades through the $165 mark.

I will be honest about SOLI'll be honest about SOL.
Yes, it has potential, but that double top I am seeing in the supply zone is not very nice to look at, which simply means: be prepared to consider this a top if the 217 levels stayed a supply zone.
now the good news: SOL retested and wicked down to the 0.786 level and bounced off from there.
Our golden ratio is still around the 145 levels and we have a major support at 123
I'm hoping to establish demand at the 177 area.
establishing demand is to basically retest 177 again or three times with significant volume to the upside, here's how you can ape in.
Anyhow, could be the calm before the storm.
I think altseason may be around the corner and if alt season is here, then SOL is not done yet.

SOL will EXPLODE once price is done consolidatingSome very bullish news surrounding solona and heavy out-performance over the rest of the market has sent SOL parabolic. But its not done. Expecting more highs to come.
- Daily support / resistance has been broke and has held up
- Price is now consolidating in small channel atop ATH support
- We wait for momentum to drop, a break of of consolidation, and for bulls to regain control over momentum and then were in
* One of the hottest coins in the market right now. Once BTC and ETH start making gains off recent pull back, SOL is outta here

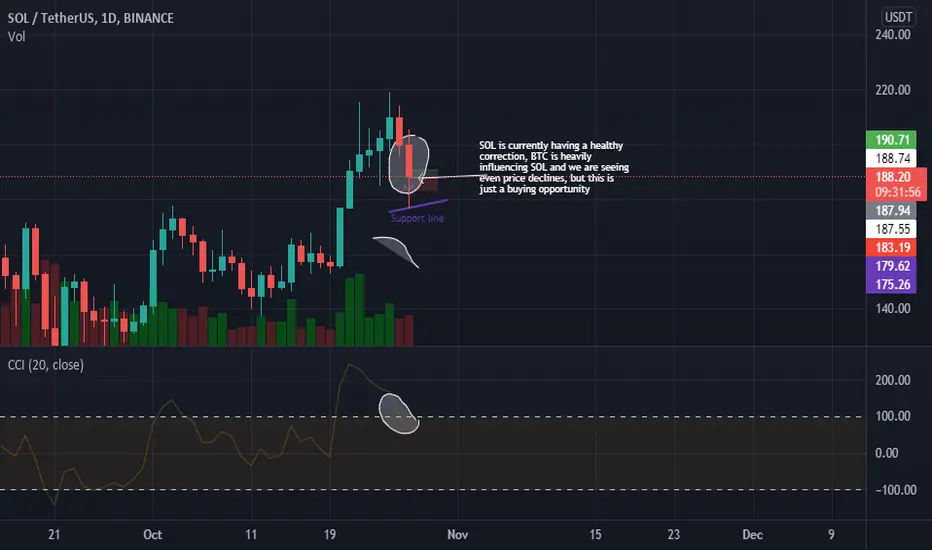
SOL healthy correctionThe SOL is currently in a healthy correction, this is due to BTC, is this something to worry about? Absolutely not, such situations are a natural phenomenon in the market
SOl Bullish XABCD ! run it back to $200+ With almost 17% correction from ath its time to get back to ath for sol !
Ps:- This is not a financial advice its just my opinion on chart !

✴️ SOL/USDTSOL tested the major resistance of $215 and was rejected from there. It is now retesting the support zone of $190-$195 and needs to hold above this to remain bullish. If it breaks above $215 then we will see a good rally towards the $250 area.

WIll we have another bullrun or we have a double top pattern? Hello my friends
as I predicted in last post solana despite of btc's correction could reach 200 and almost 215(ATH)
But what's next?
the volume is really bad for a big rally . just compare with the volume in last reaching to 215$
but btc/usdt had a breaking out lately and I consider it as a good sign but it means 2 different things
1- solana go up and btc go down ( not too down )
2- btc go down and solana also go down but less that btc.
I'm so neutral about sol but i'm kinda bearish about btc because of some reasons like USDT.D chart and the chart of btc itself .
so be careful . DO NOT PAY ATTENTION to news and imaginary targets
and I must say it again : " DO NOT BUY AT RESISTANCE"
have fun
please like and comment your opinion

The Red vs Green Light of SolanaThe other day we took a good look at Solana's technicals. Today, we'll do something even more relevant: we'll look at its strength in comparison to that of Bitcoin. But why is that?
Well, because given how much Bitcoin has rallied during September, and at weak trading volumes at that, Bitcoin is and remains fragile. In this sense, if Solana were to look weak in direct relationship to that of Bitcoin's spot price then we can safely assume Bitcoin is in for a nasty dump to follow - one that might take us as far down as the low to mid $20 000's.
If, on the other hand, Solana were to show continued strength in relation to Bitcoin then we might very well be in for an alt season. This would be THE ideal low risk/high reward entry spot.
Let's now begin by taking a good look at SOLUSD/BTCUSD.
On the daily chart, the long diagonal trend line from early January has now flipped and acts as resistance. Right now SOL/BTC is testing it from below.
It tested and broke above it in August. The question now remains: can it do it again?
The next question at hand is how this temporary correction will play out. Is the ABC completed already, or is it just the subwave structure of a bigger A-wave?
If Bitcoin were to plunge down to the low to mid $20 000's, we should automatically expect Solana to vastly under perform. For as fast a runner Solana is on the upside, it sure is fragile and volatile on the downside.
One thing ... a bad omen, indeed ... that we need to keep an eye on is the upper bearish blue RSI line on the 2-day chart.
On the previous two successful occasions upon which SOL/BTC closed on this line from below, Solana immediately proceeded by under performing versus that of Bitcoin by -85% and -34% respectively.
This incredibly bearish signal would, however, be neutralized if the RSI were to close above it and with at least a 1% safety margin.
Practically speaking, the ideal scenario to accomplish this AND to turn the ship around for a truly bullish set-up would be for SOL/BTC to:
1) break above the primary diagonal resistance line;
2) take out the recent pivot high from early October this year
Naturally, this would all have to happen within the upcoming few days, as the diagonal trend line would otherwise keep pushing its technical resistance further up. In such case, taking out the pivotal high wouldn't make much of a difference in itself.
I'm fully aware that this entire scenario is unlikely to unfold by the end of the week. Yet, if it still were to, it'd be one of the most bullish signs we could wish for in Solana, and reason alone to ladder in heavy low-risk longs.
For that's the name of the game: low risk/high reward.

SOL - these are the best points to buy ❗❗SOL has broken the support line and has now tested it as resistance, a bad signal. But that does not mean that SOL will fall right now. Below marked the level where there is a lot of liquidity and also an area of huge discount. These are the best places to buy. There is also a global trendline on the chart, if price breaks it, it will also be a very good buying opportunity.
Write in the comments all your questions and instruments analysis of which you want to see.
Friends, push the like button, write a comment, and share with your mates - that would be the best THANK YOU.
P.S. I personally will open entry if the price will show it according to my strategy.
Always make your analysis before a trade.

SOLUSD: Discounts to BuySOL continues to push aggressively into the previous highs.
Buying at an ATH is a big no for any investor.
We would like to see significant discounts in price before we load up our long term buy positions.
Once we clear the ATH, we will look for sells on a structural shift.
We will sell down until the perfect buy zone appears.

It will alter the course of SOLANA historyHello dear solana holders. The following seven days will be crucial for price movement, because SOL will decide on trend.
Here are two possibilities:
First, if the price will go up, I believe we will see a +35% rise to the new ATH with a target price of $230. This might be the start of a fresh rally, but I'll take my profits slowly and not get carried away.
Second, in the case of a breakdown, the price will hit the $ 125 minimum target. This option has the potential to force holders to sell more. So be extra cautious and avoid taking high risks.
Take your side and make the bets.
Best regards
Artem Shevelev
