SOL recorded its steepest historical drop during the past week!SOL recorded its steepest historical drop during the past week. The currency was breaking its resistance in the $35 range. With this sharp drop, its price in the futures market even reached below $10. But a small part of this devaluation was compensated in the last two days. The condition of this currency is still very worrying. The bottom of Solana's long-term descending channel has been temporarily broken. Due to the high angle of the price meeting this support, there is a possibility of a complete break of the $10 support if the market continues to decline. In general, the support we can consider for Solana ranges from $11.85 to $14.40.
Solana has a bearish trend in most time frames. If the selling pressure increases in the market, there is a possibility of breaking this support and falling further to the range of 9.10 to 8.5 dollars. In the 4-hour time frame for a trend reversal, buyer support is needed to keep the price above the $15 range. Therefore, the return of the price below this range can make the trend downward again in 15 minutes. Changing the trend in the 1-hour time frame requires breaking the $20 resistance. To see signs of price growth, we should wait for a positive divergence on the RSI in the 4-hour time frame.
Solbtc

SOLANA - It's not as bad as it looks.After stopping the downtrend on the chart, there is a breakout with a breakout of the historical support level. In order for this breakout to be considered false, the price needs to return above support with bars of renewed buying on rising volumes.
There are sales through the claymatic, to confirm the purchases you need a test of this buyer, which stands at 12-15. Observe.
If you liked the idea, please like it. That's the best "Thank you!" for the author 😊
P.S. Always do your own analysis before a trade. Put a stop loss. Fix profits in installments. Withdraw profits in fiat and make yourself and your loved ones happy.

UPDATE 1: Battle planning on Solana looking at EthereumTLDR: I waited over 4 months for the trade to get to the point I would put a short on. The next move is to short to the buybox. See the linked idea for more context
Introduction
I have spent a lot of time looking at blow off tops and parabolic moves over the last 450 ideas and 5 years with the goal of being able to benefit from these natual phenomenon of mass psychology. One thing I greatly desire for my trades now is what I call "chart clarity" where the better a asset looks to be following a pattern I know the more I want to trade it.
I plan on following this fractal for the next couple of year so long as each step gets confirmed. I hope to make a lot of money doing this and hopefully others can benefit.
Analysis and battle plan
ETH was prety volatile during the last bull run and bear market but once we zoom back it was just a simple ABC correction with a final consolidation at the Fib Extension 1 level before a final quick move to target. In that case the C wave was a 1.618 extension of the A wave.
As I chart it, Solana's C wave will be a 2x extension of the A wave. Ethereum had a symmetrical triangle that it broke out of when it was done consolidating at the 1 line but Solana has an even more bearish continuation pattern, a bearish rising wedge on a flag pole.
Price action can be inconsistent depending on the exchanges being looked at but the target is the blue buy box. If price wicks below that into the area of the muave-ish circle then that would be too low for me and would make me think the pattern could be off going forward.
The chart below shows some smaller time frame structure. There is a head and shoulders formation that should facilitate price breaking down out of the wedge in dramatic fashion.
A look at SolBTC shows a black head and shoulders making up the top of a right shoulder in blue heand and shoulders. That SOLBTC sell pressure should create a lot of sell pressure on SOLUSDT.
Further battle planning
If price consolidates in the buy box as predicted the next big move I would want to play would be a long with price action going up to the base of the bull trap, which is the end of corrective wave A and the beginning of wave V. As I study this fractal on smaller altcoins I have seen some rallies move quite a way into wave B but others have died within pennies of the beginning of Wave B. I shan't be greedy.

SOL BUY SETUPHello, dear traders. how are you ? Today we have a setup to buy/long the SOL symbol.
For risk management, please don't forget stop loss and capital management
When we reach the first target, save some profit and then change the stop to entry
Comment if you have any questions
Thank You


Where is Solana going?Note: Word to shorts is risky at these prices
We had a big triangle, and this fast movement is behind this triangle. I have identified two supports, with these negative news, it is not unlikely that these two supports will move down
Comment if you have any questions
Thank You

Solana (SOL) - November 8Hello?
Welcome, traders.
By "following", you can always get new information quickly.
Please also click "Boost".
Have a good day.
-------------------------------------
(SOLUSDT 1W Chart)
Whether it can move higher than 58.38 is the key.
To do that, we need to see if we can move above 37.35 and see if we can find support.
(1D chart)
As it fell to around 29.28, it returned all the upside.
The key is whether it can find support near 29.28 and move above 32.87.
If it doesn't, it's likely to drop below 24.54.
It is important to find support near 29.28 to move above the M-Signal line on the 1W chart.
------------------------------------------------------------ -------------------------------------------
** All descriptions are for reference only and do not guarantee a profit or loss in investment.
** If you share this chart, you can use the indicators normally.
** The MRHAB-T indicator contains indicators that indicate support and resistance points.
** SR_R_C indicators are displayed as StochRSI(line), RSI(columns), CCI(bgcolor).
** CCI indicator is expressed as overbought range (CCI > +100) and oversold range (CCI < -100).
(Short-term Stop Loss can be said to be a point where profit and loss can be preserved or additional entry can be made through split trading. It is a short-term investment perspective.)
---------------------------------

Solana Analyze (Short Term, Timeframe 15min,11/07/2022)!!!Solana was able to complete wave 4 on PRZ(Price Reversal Zone), while the wave was an extended wave.
I expect Solana will go down at least to the support line.
Solana Analyze Analyze ( SOLUSDT ) Timeframe 15min⏰.
Do not forget to put Stop loss for your positions (For every position you want to open).
Please follow your strategy, this is just my idea, and I will be glad to see your ideas in this post.
Please do not forget the ✅' like '✅ button 🙏😊 & Share it with your friends; thanks, and Trade safe.

SOL BUY STOPHello, dear traders. how are you ? Today we have a setup to buy/long the SOLUSDT symbol.
For risk management, please don't forget stop loss and capital management
When we reach the first target, save some profit and then change the stop to entry
Comment if you have any questions
Thank You

SOLANA to $850Solana SOL
Not a fan of the coin but it is going to $850.
I don't make the rules.
Not financial advice.

Solana (SOL) - October 31Hello?
Welcome, traders.
By "following", you can always get new information quickly.
Please also click "Boost".
Have a good day.
-------------------------------------
(SOLUSDT 1W Chart)
The key is whether you can support and rise in the 28.47-37-55 section.
(1D chart)
At point 32.87, the HA-Low line of the 1W chart was generated.
So, if you hold the price above 32.87, you are likely to see an uptrend.
However, since the section 28.47-37.55 is the section that determines the trend, it is expected that the upward trend can be continued only when it rises above this section.
If it fails to move above 32.87, we need to see if we can sustain the price above the downtrend line (1).
------------------------------------------------------------ -------------------------------------------
** All descriptions are for reference only and do not guarantee a profit or loss in investment.
** If you share this chart, you can use the indicators normally.
** The MRHAB-T indicator contains indicators that indicate support and resistance points.
** SR_R_C indicators are displayed as StochRSI(line), RSI(columns), CCI(bgcolor).
** CCI indicator is expressed as overbought range (CCI > +100) and oversold range (CCI < -100).
(Short-term Stop Loss can be said to be a point where profit and loss can be preserved or additional entry can be made through split trading. It is a short-term investment perspective.)
---------------------------------

A sign of continued price growth for the coming weeks?!SOL had good growth last week. With support forming across the market, Solana responded well to the $27 support range. As in the past, this area had a high strength in reversing the Solana trend for a short period; this time, it activated many orders from buyers. As you can see, the channel's midline has been broken to the top, which has pushed the price exactly into this pullback area for the past two days, and the support of buyers has caused the next resistance to be broken in the $31-$32 range.
There is potential for a pullback to this range, but it is more likely that the upside move to $35 resistance is expected before the pullback. We expect a negative reaction and a short-term price stop in this area. Even Solana's price trend can turn into a range under this resistance. But it is expected that this range trend will turn into an upward trend again after a short period. If the weekly candle closes strongly like this, it can be a sign of continued price growth for the coming weeks.

Solana (SOL) - October 24Hello?
Welcome, traders.
By "following", you can always get new information quickly.
Please also click "Boost".
Have a good day.
-------------------------------------
(SOLUSDT 1W Chart)
The key is whether you can support and rise in the 28.47-37.55 section.
(1D chart)
The key is whether you can break out of the downtrend line (1) and move above the downtrend line (2).
If the price is maintained above the downtrend line (2) until the volatility around October 30, it is expected to rise to the 32.42-34.12 range.
If you fail to ascend,
1st support: 28.47
Second support: 25.05-26.70
In order to continue the upward trend, it must rise above the HA-High indicator.
------------------------------------------------------------ -------------------------------------------
** All descriptions are for reference only and do not guarantee a profit or loss in investment.
** If you share this chart, you can use the indicators normally.
** The MRHAB-T indicator contains indicators that indicate support and resistance points.
** HA SRRC indicators are expressed as StochRSI(line), RSI(columns), CCI(bgcolor).
** CCI indicator is expressed as overbought range (CCI > +100) and oversold range (CCI < -100).
(Short-term Stop Loss can be said to be a point where profit and loss can be preserved or additional entry can be made through split trading. It is a short-term investment perspective.)
---------------------------------

SOLUSDT 60 % range trading (NEW)The price is in the range.
Easy trading for a range traders:
- Buy at the bottom of the range ($30)
- Sell at the top of the range ($48)
- Take profit at $41
- Exit the trade If the price breaks below the range

SOLANA SOL/USD Looking Toppy! SOLANA went on a nice run almost 200x from its lows less than a year ago. Its pretty near its top now, there may be a small drive up to $280-$290 when Bitcoin makes its run, then wave 5 is done I believe and its probably headed down for a while. Also SOL/BTC has pretty much double topped and finished the 5 waves and is on the way down. Not a very popular opinion I know especially if you bought in late. Just my opinion and not financial trading advice. Thank you and follow me for updates, more of the top cryptos and some hidden gems.

SOL BIG MOVERemember this chart. I think Solana is waiting for such a move in 12-hour time frames and above.

Solana (SOL) - October 11Hello?
Welcome, traders.
By "following", you can always get new information quickly.
Please also click "Boost".
Have a good day.
-------------------------------------
(SOLUSDT 1W Chart)
The key is whether you can support and rise in the 28.47-37.55 section.
(1D chart)
We need to see support near 31.81 and see if we can move higher than 34.58.
If not, you should see support around 28.47.
------------------------------------------------------------ -------------------------------------------
** All descriptions are for reference only and do not guarantee a profit or loss in investment.
** If you share this chart, you can use the indicators normally.
** The MRHAB-T indicator contains indicators that indicate support and resistance points.
** SR_R_C indicators are displayed as StochRSI(line), RSI(columns), CCI(bgcolor).
** CCI indicator is expressed as overbought range (CCI > +100) and oversold range (CCI < -100).
(Short-term Stop Loss can be said to be a point where profit and loss can be preserved or additional entry can be made through split trading. It is a short-term investment perspective.)
---------------------------------

SOLUSDTP climbing alarm👌👌I don't need to give an explanation about the cryptocurrency because its name speaks for itself.
Dear friends, I have designed for you the path of movement in front of Solana and I have also shown you the flag points on the chart, so be careful in your buying and selling.

Solana (SOL) - October 4Hello?
Welcome, traders.
By "following", you can always get new information quickly.
Please also click "Boost".
Have a good day.
-------------------------------------
(SOLUSDT 1W Chart)
The key is whether you can support and rise in the 28.47-37.55 section.
(1D chart)
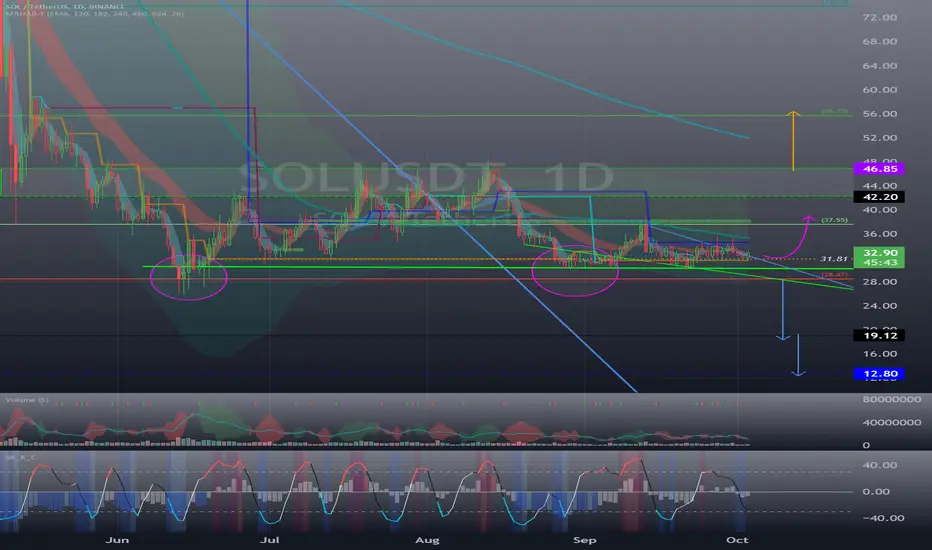
Resistance: 42.20-46.85
You need to check if you can get support and climb in the 28.47-37.55 section.
In particular, we should see support at 31.81 and see if we can move higher.
Even if it rises above 37.55, if it does not break above the resistance section of 42.20-46.85, it may lead to further declines, so you need to be careful.
------------------------------------------------------------ -------------------------------------------
** All descriptions are for reference only and do not guarantee a profit or loss in investment.
** If you share this chart, you can use the indicators normally.
** The MRHAB-T indicator contains indicators that indicate support and resistance points.
** SR_R_C indicators are displayed as StochRSI(line), RSI(columns), CCI(bgcolor).
** CCI indicator is expressed as overbought range (CCI > +100) and oversold range (CCI < -100).
(Short-term Stop Loss can be said to be a point where profit and loss can be preserved or additional entry can be made through split trading. It is a short-term investment perspective.)
---------------------------------
SOLANA USDT SOL About To Blast Off! Multiple Bullish Divergence!SOL looks to have bottomed out here. There is bullish divergence on the daily with the MACD, RSI, VMACD, OBV, and CMF. Usually when all these show bullish divergence and multiple drives of it then there is a decent rally to follow. Right now Solana is bouncing off support and resistance levels within this accumulation zone as I show in the chart. Once SOL breaks $39 its game on and I can see a fairly rapid move up to $48 and then an even faster move from $48 to $75. Indicators are all looking bullish and the BBWP which measures volatility is at an extreme low ready to expand. There may be a quick swipe down to the bottom side of the accumulation zone around $30 before the lift off but its not likely. I think SOL has bottomed and is ready to soar. This is not financial or trading advice this is just my opinions and speculations. Follow and give me a boost if you appreciate my ideas. Leave a comment below and let me know what you think.
P.S. When I look at Solana on the log chart, it looks scary. It looks like LUNA did before it had its big dump. Im not sure how high this rally will go, Im just trading it and will probably make an exit around $70, but long term I think that Solana may correct much further. I don't see new all time highs even in the next bull run, maybe a double top though. Im not sure, I will link the logarithmic chart below so you guys can tell me what you think, but to me its a scary looking chart.

Solana (SOL) - September 25Hello?
Welcome, traders.
By "following", you can always get new information quickly.
Please also click "Like".
Have a good day.
-------------------------------------
(SOLUSDT 1W Chart)
The key is whether you can support and rise in the 28.47-37.55 section.
(1D chart)
The interval 28.47-37.55 is the interval that determines the trend.
As such, we expect the trend to continue in the direction that departs from the 28.47-37.55 section.
However, in order to continue the upward trend, it must rise above the 42.20-46.85 section.
------------------------------------------------------------ -------------------------------------------
** All descriptions are for reference only and do not guarantee a profit or loss in investment.
** If you share this chart, you can use the indicators normally.
** The MRHAB-T indicator contains indicators that indicate support and resistance points.
** Background color of Long/Short-S indicator: RSI oversold and overbought sections
** Background color of CCI-C indicator: When the short-term CCI line is below -100 and above +100, oversold and overbought sections are displayed.
** The OBV indicator was re-created by applying a formula to the DepthHouse Trading indicator, an indicator disclosed by oh92. (Thanks for this.)
(Short-term Stop Loss can be said to be a point where profit and loss can be preserved or additional entry can be made through split trading. It is a short-term investment perspective.)
---------------------------------

SOLBTCalt relief incoming?
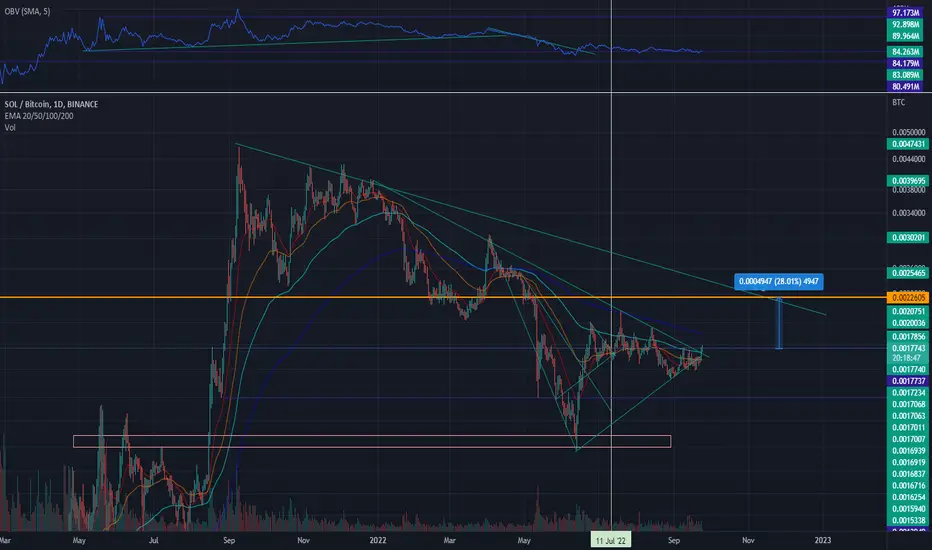
solbtc breaking long term downtrend
starting a bullish cfork here
it probably retests the breakout line this would be a good level with simple ivalidation to look for longs
#SOL/USDT 1DAY UPDATE !Hello dear traders, we here new so we ask you to support our ideas with your LIKE and COMMENT, also be free to ask any question in the comments, and we will try to answer for all, thank you, guys.
Solana (SOL) 1DAY UPDATE:-
The most recent rejection at the $38 resistance has pushed Solana’s price into a downtrend which lost 3% of its valuation in the past seven days. Now, SOL is found at critical support with the price hovering just above $30.
Buyers will have to do all that they can to protect the key support, because otherwise, Solana will enter a very dangerous area that could lead the price towards a significant drop. In August and September, buyers were successful to defend the $30 support, but the current market does not favor them.
The indicators do not give any clear hits on where Solana could go next and are rather neutral. This shows market participants are hesitating. Usually, this type of price action precedes a major move one way or the other. Therefore, best to be prepared for that.
Sorry for my English it is not my native language.
Hit the like button if you like it and share your charts in the comments section.
Thank you
