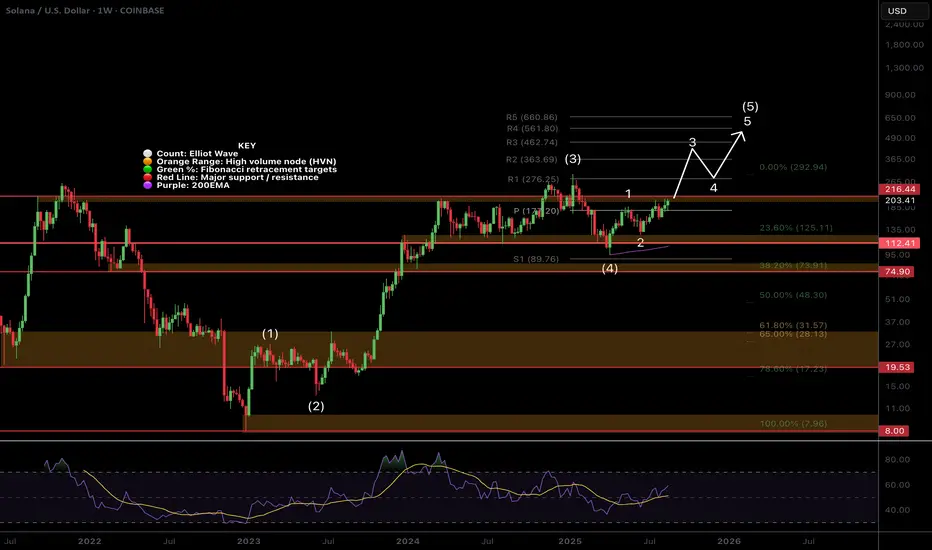
$SOL Ready for Price Discovery?CRYPTOCAP:SOL wave 3 of (5) appears to be underway but has to get through the major resistance High Volume Node at $216 and previous high first for an impulsive move.
Weekly pivot point was tested successfully as support and RSI has plenty of room to continue upwards.
Analysis is invalidated below $130.
Safe trading
Solusdt
Solana at the Gates of Breakout- 250-300 in sight1. What happened lately
After the sharp drop that started on July 23 and bottomed at 155 in early August, Solana has shown strong recovery.
The rebound pushed price back to the 207 resistance zone, followed by a pullback to 175, confirming it as a solid demand area. Yesterday, in line with the entire crypto market, SOLUSDT rallied strongly, and today, after a quick dip below 200, buyers stepped back in, pushing price once again toward resistance.
2. The key question
Is Solana ready to finally break above resistance and continue higher into a new bullish leg?
3. Why I expect continuation to the upside
• Positive fundamental backdrop across the crypto sector.
• Constructive technical structure with consecutive higher lows since April.
• 175 confirmed as a strong support zone, with buyers stepping in twice this month.
• 207 resistance under pressure again, showing growing bullish momentum.
4. Trading plan
As long as the daily close holds above 190, Solana remains firmly bullish.
A clear breakout above 207 could open the path toward 250, and in a more extended scenario, even 300 in the medium term.

Solana Prediction for 8/22I believe what we're seeing (order flow) is a bullish range order flow.
I don't see abnormal or excited sellers with huge size coming in constantly to bring price to any huge bearish targets.
Which leads me to believe, we're in a giant range.
Also today we had lots of buying activity that did strike me as excited. Big buyers, if they can get loose this target should be easy.

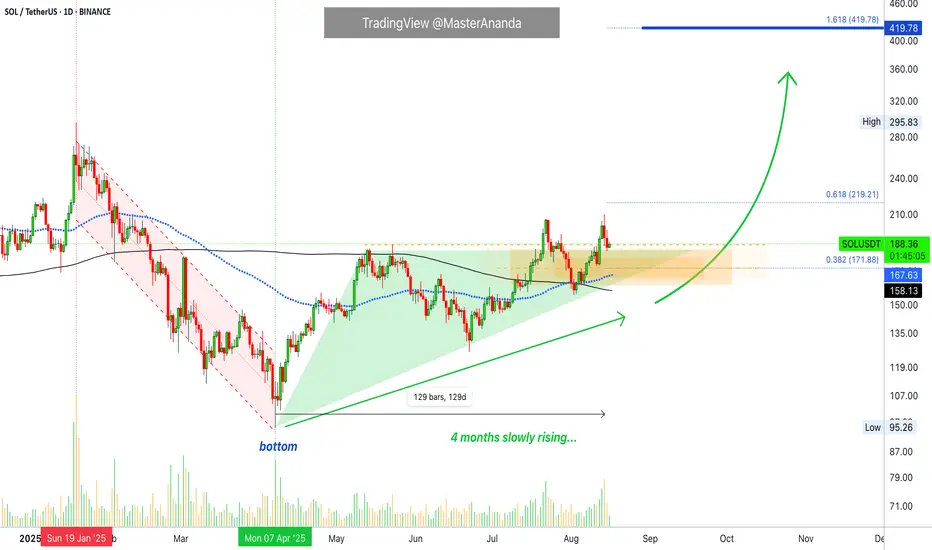
Solana Bullish · Long-Term Growth ConfirmedAfter the market bottom in April Solana has been rising slowly for four months.
Look at this chart here. I am keeping it very simple because I believe simple is best. Where is Solana at now? What happens next?
Solana is trading safely above EMA89 and MA200, notice the dynamics on the chart. These levels were first conquered as resistance back in July and by the 2nd of August these levels were being tested as support, they both held.
SOLUSDT is trading safely above these levels and also a price of $172 which is the 0.382 Fib. extension of the current wave. This is an important zone and the action is happening safely above it.
Solana has room to move around, wiggle around. This is what happens as prices grow. There can be stops and retraces but this does not mean that the rise is over, there is always more.
Solana just conquered the EMA89/MA200 duo-resistance recently, we have not yet seen what is possible now that the trading is happening on the bullish zone. We are due a major advance... The market is consolidating, building up strength to be able to grow long-term.
Namaste.
SOLUSDT 4H✅ SOL/USDT — 4H (Binance) | Aug 20, 2025 — Professional Technical Read
🔎 Chart context
• Structure is broadly bullish since early Aug, but the last leg printed a lower high → pullback into a 4H demand/FVG block.
• Price now ~180.7 inside that block. Two paths are drawn on your chart: a reaccumulation → breakout to 210 or a loss of demand → sweep 158.
📍 Key levels (approx.)
• Supply / liquidity above: 200–210 (major liquidity line marked 210.00).
• Decision block (current): ~175–183 (4H demand/FVG; prior breakout origin).
• Pivot / CH reference: ~194–196 (CH 4H label — reclaim turns momentum cleanly bullish again).
• Support below: ~158 (tagged on chart), then 150–145 (deeper old base).
🧭 Market structure & liquidity map
• After the CH 4H and rally to the recent peak, price created a higher low around ~165–168, then a spike to ~205, and is now mitigating the 175–183 block.
• Wicks show responsive buyers at the upper edge of the block, but the midline is soft; a clean close below ~175 likely exposes the resting liquidity at 158.
• Above, buy‑side liquidity sits over 200 with a cluster around 209–210 (equal‑highs feel).
📈 Bullish continuation (probable if 175–183 holds)
Conditions:
• Hold 175–183 with a 4H HL and impulsive reclaim of ~188–190, then CH area ~195.
Path & targets:
1. Trigger reclaim: 188–190 → momentum confirmation above 195 (CH 4H).
2. TP1: 198–200 (partial).
3. TP2: 205–206 (prior swing).
4. TP3: 209–210 (liquidity sweep).
Invalidation: a 4H close below 175.
📉 Bearish continuation (activated on loss of demand)
Conditions:
• 4H close below 175 or failed bounce capped under 188–190.
Path & targets:
1. Pullback/failed retest into 182–186 (sell zone).
2. TP1: 168–166 (intermediate shelf).
3. TP2 (main): 158 sweep (your downside tag).
4. Extension (if momentum persists): 150–145 mitigation.
Invalidation: sustained reclaim >195.
🎯 Trade plans (system‑agnostic

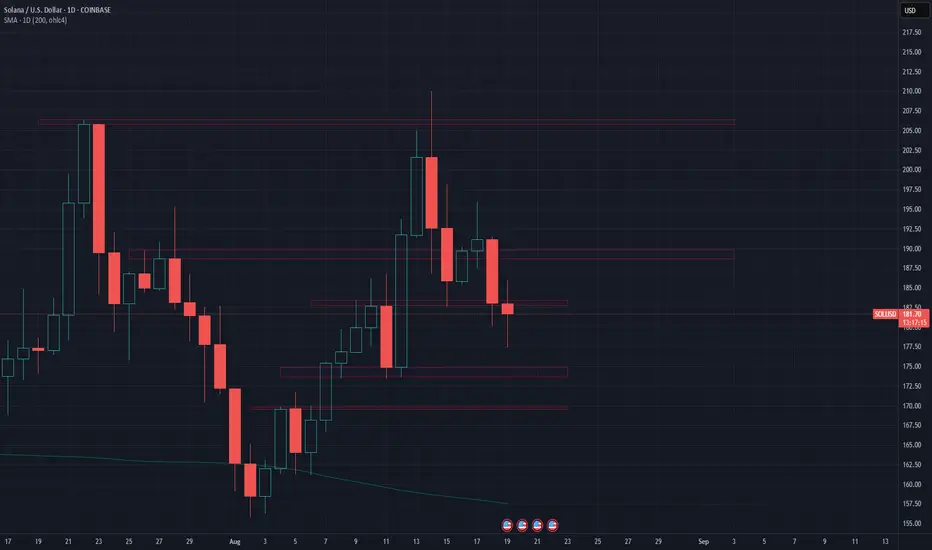
Solana tests supportAfter a solid recovery from the daily 200MA, Solana has retraced from its local high around $210.
Currently trading around $180, previous resistance and potential support, if the bulls can reclaim $184, we may see a recovery towards $206.
Potential resistance can be expected around $190 first.
Continued short-term weakness from current levels could see price test $170 - $175 as support.
Considering that a new high was created and price is trading above the daily 200MA, the market could be signaling strength and potential for further bullish momentum.
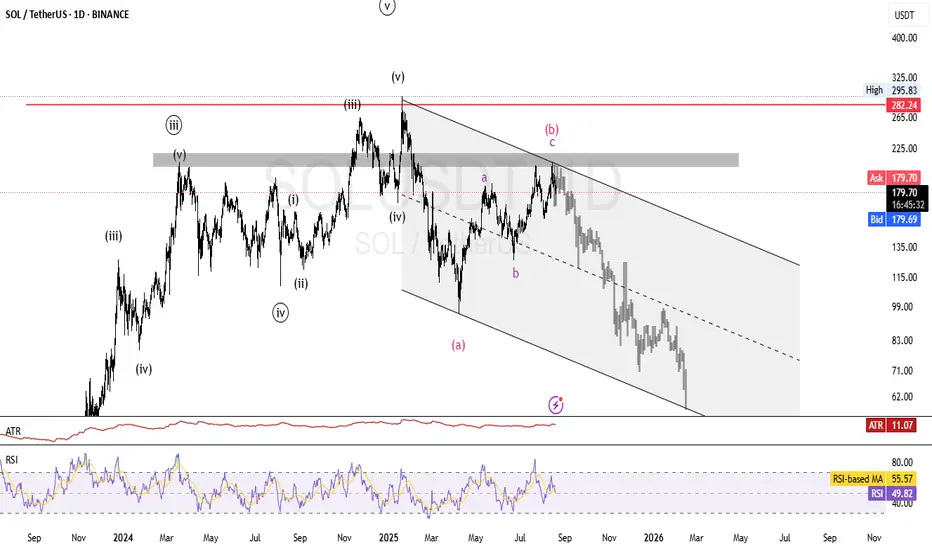
SOLUSDT: Elliot waves Analysis Hello. As you can see in the Solana chart, the analysis is based on Elliott waves in the long term. This is only a perspective and cannot be the basis for trading, but it seems that after reaching the deadline area, we can expect a continuation of the correction for wave C. So keep this perspective in mind, as it is possible.
Solana Buy SetupAs we're in the daily OB zone, I think this area has a good potential to set a buy order.
I take the SL a little tight but you can set in even below the low.
Please consider the risk management.
Dear traders, please support my ideas with your likes and comments to motivate me to publish more signals and analysis for you.
Best Regards
Navid Nazarian

SOLUSDSOLUSD Short Call Minor support broken
A short is planned as on larget time frame retracement is pending

Crypto Market Weekly Outlook: BTC and Alts Enter Seasonal PhaseThis is the new weekly crypto market review, and today we’ll take a detailed look at the current situation for Bitcoin and the main altcoins, focusing on the key scenarios for the coming months.
Brief summary on BTC:
• In the last three post-halving years (2013/2017/2021) the same seasonal pattern occurred: summer growth, followed by a September correction to the 10–30WMA (weekly moving average), and then a new growth wave starting from Q4.
• Cycle returns are decreasing: ~1000% → ~560% → ~75%.
• Comparing the current dynamics (from 2025 lows) to the growth period from the 2020 lows, we see an almost identical sequence of weekly candles. This strengthens the hypothesis that we are indeed within the classic summer–autumn scenario: 1–2 weeks of autumn correction, then 5–6 weeks of consolidation, followed by a new upward impulse.
• If price corrects toward the 110K zone and then repeats the 2021 pattern with ~70–75% growth, the targets will be in the 180K+ area. If the downtrend in returns continues and growth is only 30–50%, then the focus will shift to the 140–160K range.
• BTC trend structure: the lower boundary of the target resistance zone (~126K) has been reached, followed by a sharp correction. Local resistance: 119–121K. If we see a rebound attempt in the coming days, a possible reversal and the beginning of a new corrective wave should be considered. Key mid-term support zone: 113–107K, where I would like to see consolidation and the formation of a higher low before the next growth wave.
Brief summary on altcoins:
ETH
• Price is in the target mid-term resistance zone. I would like to see one more attempt in the coming weeks to break historic highs to at least 5100, possibly stretching to 5670, before entering a multi-month consolidation into the macro support zone at 4300–3650. If price breaks below Friday’s session low, the “autumn” correction may already be underway.
BNB
• The impulse from August lows has ended or is close to completion.
• Mid-term support zone: 813–780.
• A drop below 780 increases the likelihood of a diagonal structure, with potential to retest the August lows.
• As long as price remains above 730, the macro trend with potential growth toward 950–1000+ remains intact.
SOL
• Support zone: 180–165
• Target resistance zone: 255–285
XRP
• Rising risk of the trend shifting into a diagonal structure, increasing the potential correction toward 2.60–2.50.
• Main hypothesis unchanged: consolidation in the coming months before a new growth wave toward 4.30+.
HYPE
• Support zone: 44–40
• Target resistance zone: 60–65
• Very interesting growth potential for the next wave. Worth keeping this momentum in primary focus.
Feel free to comment which coins and assets you’re most interested in, and I’ll prepare a separate review on them.
Thank you for your attention! Wishing you a successful new trading week and strong investment decisions!

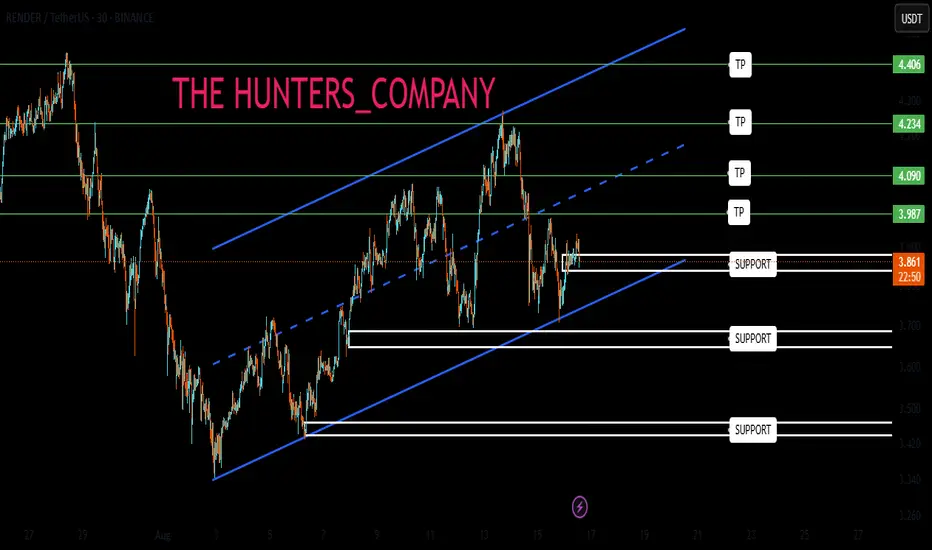
RENDER: Buyers arrivedHello friends
Given the decline we had, we see that buyers entered and created an ascending channel.
Now that we are at the bottom of the channel, we are in an important support area.
Of course, two other important support areas are also located further up, which if supported by the price, can move to the specified resistances.
*Trade safely with us*
SOL Volatility Period: Around August 18
Hello, traders!
Follow us to get the latest information quickly.
Have a great day!
-------------------------------------
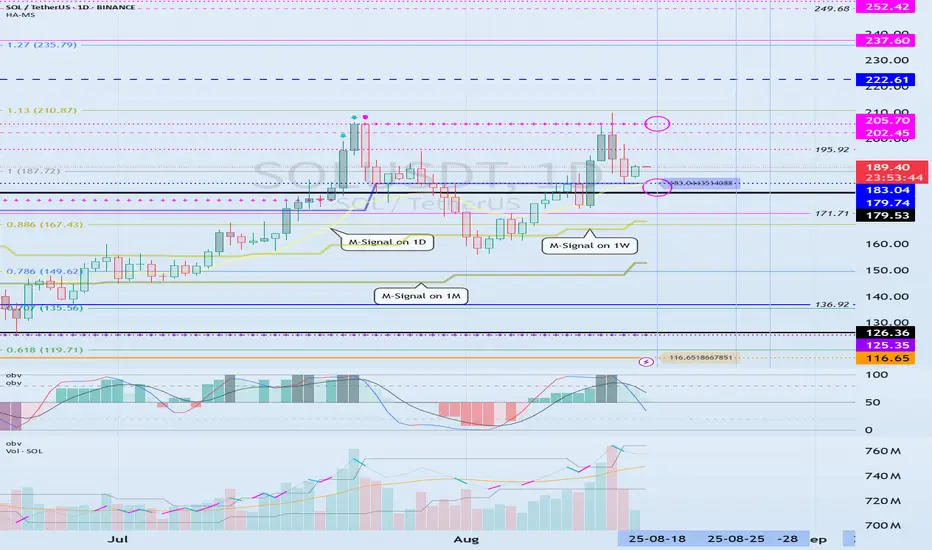
(SOLUSDT 1M Chart)
If the price stays above the M-Signal indicator on the 1M chart, the uptrend is expected to continue.
If it falls below 126.36, you should stop trading and observe the movement.
Since the HA-High indicator is forming at 179.74, the key question is whether it can find support near this level and rise.
The start of a stepwise uptrend is likely to begin with a rise above 237.60, the DOM (60) indicator level.
Therefore, the key point to watch is whether it can find support in the 179.74-237.60 range.
The DOM (60) indicator indicates the end of a high, while the HA-High indicator indicates a decline from a high.
Therefore, the 179.74-237.60 range can be considered a high boundary zone.
When the DOM (60) or HA-High indicator first forms, a decline is likely.
If the decline is followed by a rise near the HA-High or DOM (60) indicator, the likelihood of an upward breakout increases.
Therefore, if support is found around 179.74 this time, it is highly likely to lead to an attempt to rise above 237.60.
-
(1W chart)
The key area to watch on the 1W chart is whether the price can break above the 202.45-222.61 level.
If the price breaks above the 202.45-222.61 level and maintains its upward momentum, a stepwise uptrend is likely to begin.
-
(1D chart)
The key area to watch on the 1D chart is whether the price can find support around 179.53-183.04 and rise above 205.70.
The 183.04 point is the HA-High indicator level, and the 205.70 point is the DOM (60) level.
If it falls below 183.04, it is expected to meet the M-Signal indicator on the 1W chart and re-establish the trend.
Ultimately, the price must remain above the M-Signal indicator on the 1M chart to maintain a strong uptrend.
Therefore, looking at the bigger picture, we need to determine whether the 126.36-179.53 range provides support and allows for an upward movement.
SOL's current volatility period is around August 18th (August 17th-19th).
At this time, we should look for a direction in which it deviates from the 183.04-205.70 range.
-------------------------------------------------
Only the concept of price moving averages, which I learned while studying chart analysis, is applied to the M-Signal indicator on the 1M, 1W, and 1D charts.
The rest of the explanation cannot be interpreted using existing chart analysis techniques.
This is because the HA-Low and HA-High indicators were developed for trading on Heikin-Ashi charts, while the DOM(60) and DOM(-60) indicators are a comprehensive evaluation of the DMI, OBV, and MOMENTUM indicators.
Therefore, to interpret my charts, you must apply the concepts of support and resistance points.
It's not that my chart explanations lack logic; they simply seem illogical because they can't be interpreted using existing interpretation methods.
Chart analysis should be as simple and concise as possible.
If you spend too much time analyzing charts or trying to apply complex theories, you will lack time to develop a trading strategy, increasing the likelihood of your trades going in the wrong direction.
To interpret my chart, all you need is a basic understanding of price moving averages and support and resistance.
Support and resistance points are determined by the horizontal lines of the DOM(60), HA-High, HA-Low, and DOM(-60) indicators.
The DOM(60) and HA-High indicators mark highs, while the HA-Low and DOM(-60) indicators mark lows.
Therefore, a basic trading strategy can be used: buy when the price rises from the DOM(-60) to HA-Low range, and sell when it reaches the HA-High to DOM(60) range.
However, if the price rises above the HA-High to DOM(60) range, a stepwise uptrend is likely, while if the price falls below the DOM(-60) to HA-Low range, a stepwise downtrend is likely.
Therefore, a segmented trading strategy should be adopted.
-
The basic chart for chart analysis is the 1D chart.
Therefore, it's best to trade in line with the trend of the 1D chart.
Therefore, the position that matches the trend of the 1D chart becomes the main position.
So, since the current trend of SOL's 1D chart is up, the LONG position becomes the main position.
To trade based on the trend of the 1D chart when trading futures, you need to set low leverage.
Therefore, when trading based on the timeframe chart you're viewing, increase your investment proportion when trading in line with the trend of the 1D chart. Conversely, when trading in the opposite direction, reduce your investment proportion and execute short, quick trades.
-
Thank you for reading to the end.
I wish you successful trading.
--------------------------------------------------
- This is an explanation of the big picture.
(3-year bull market, 1-year bear market pattern)
I will explain in more detail when the bear market begins.
------------------------------------------------------
SOLUSDT 4H
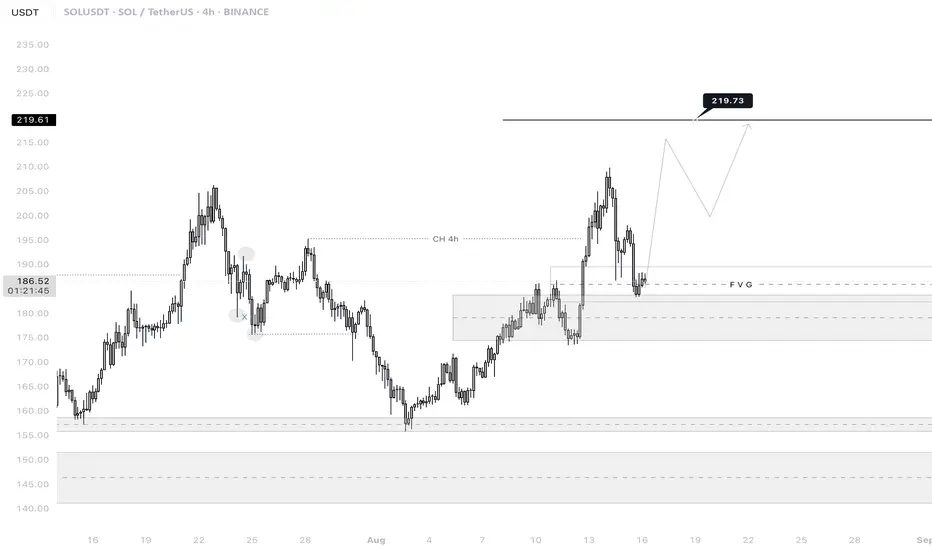
🔎 Chart Context
• Pair: SOL/USDT
• Exchange: Binance
• Timeframe: 4H (240M)
• Date: 16 August 2025
This chart uses price action + liquidity concepts (CH, FVG, liquidity grabs, demand zones) for projection.
📊 Key Observations
1. Recent Highs & Lows
• Swing High: 209.86
• Previous High: 206.30
• Previous Lows: 173.43, 175.63, and 161.13
These levels represent liquidity points where orders are clustered.
2. Change of Character (CH 4H)
• Around 195.26, a CH (Change of Character) has been marked.
• This suggests that the bearish trend shifted into bullish momentum after reclaiming higher highs.
3. FVG (Fair Value Gap)
• The current price is retesting the FVG zone after rejecting from 209.86.
• FVG zones typically act as rebalancing levels where price either consolidates or launches into the next move.
4. Demand Zones
• 173.43 – 177.73: Strong demand area with previous accumulation.
• 155.83 – 157.23: Deeper demand zone that may act as a long-term support if the market drops sharply.
• Current reaction shows bulls protecting 173–177 zone.
5. Upside Target
• Next projected liquidity pool is at 219.73.
• This is above the 209.86 high, indicating liquidity sweep potential and continuation of bullish trend.
📈 Bullish Case (High Probability)
• Price held the FVG + demand block around 173–177.
• Higher High (209.86) confirmed a bullish structure.
• If momentum sustains, target = 219.73, where liquidity above old highs is likely to be taken.
• Expect potential retracement back to 195–197 before pushing up.
📉 Bearish Case (Low Probability but Possible)
• If SOL fails to hold 173–177 demand zone, we may see a deeper retracement toward 161–157 support zone.
• Losing that level would invalidate the bullish structure and turn the chart back into distribution mode.
⚡ Trading Plan
• Entry (Long): Accumulation around 173–177 (FVG/Demand zone).
• Target 1: 195–197 (partial take-profit).
• Target 2: 209.86 (previous high).
• Target 3 (final): 219.73 (liquidity sweep zone).
• Stop-loss: Below 173 (safe stop), or aggressive stop below 182.70 minor structure
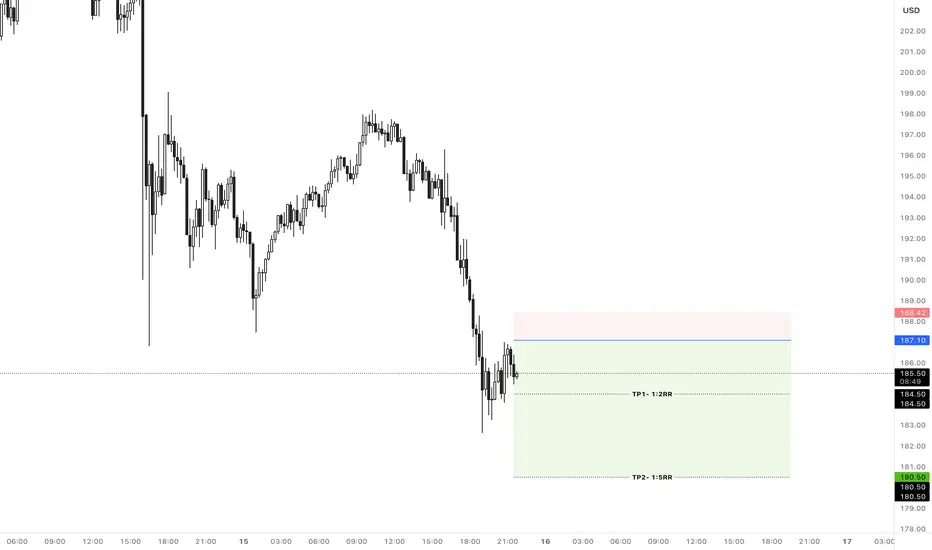
Solana Short SetupHi everyone.
I think we can set an order in this area to go short.
As we're in daily Order Block and getting close to the demand zone, so I'll post a buy setup after this one.
Let's see how does the market reacts.
Dear traders, please support my ideas with your likes and comments to motivate me to publish more signals and analysis for you.
Best Regards
Navid Nazarian
SOLUSDT ling term"🌟 Welcome to Golden Candle! 🌟
We're a team of 📈 passionate traders 📉 who love sharing our 🔍 technical analysis insights 🔎 with the TradingView community. 🌎
Our goal is to provide 💡 valuable perspectives 💡 on market trends and patterns, but 🚫 please note that our analyses are not intended as buy or sell recommendations. 🚫
Instead, they reflect our own 💭 personal attitudes and thoughts. 💭
Follow along and 📚 learn 📚 from our analyses! 📊💡"

Solana Buy SetupHi everyone.
Right now we're in a pullback and I think this area has its potential to set an order.
Please consider the risk management.
Dear traders, please support my ideas with your likes and comments to motivate me to publish more signals and analysis for you.
Best Regards
Navid Nazarian

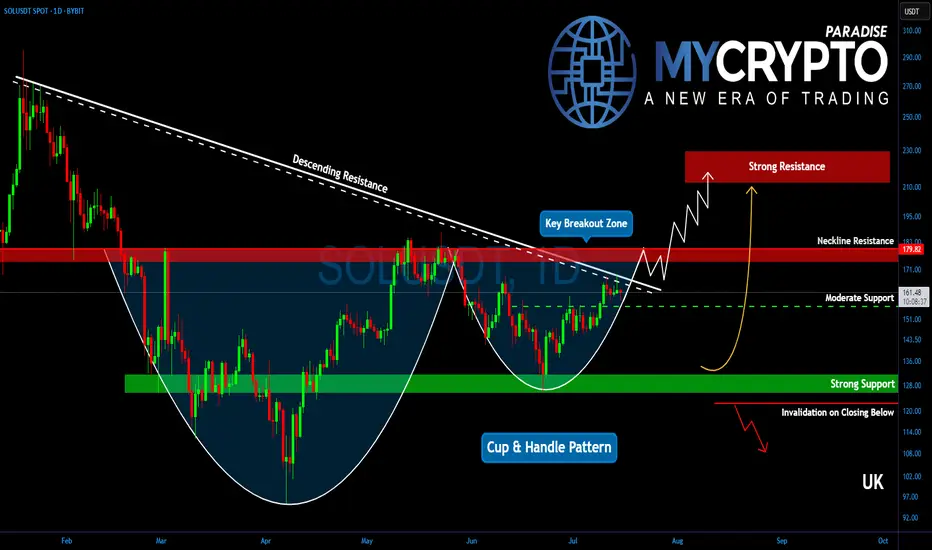
Will Solana Explode? This Important Zone Could Trigger a MoveYello, Paradisers! Is #Solana about to break free into a new bullish wave? After months of struggling under key resistance, the bulls are finally making a serious push… but only one zone stands between SOL and a potential explosion.
💎After peaking in January, Solana has remained suppressed under a descending trendline. But now, that trendline is being challenged aggressively, and the price structure is starting to form a reversal pattern that demands attention.
💎Right now, the most important level on the chart is the descending channel resistance at $167. Bulls are actively testing this zone, and if they manage to flip it into support, it could trigger a significant shift in momentum. But just above, at $180, sits an even more critical barrier, the neckline of the current reversal pattern. This entire region between $167 and $180 is the true battleground.
💎#SOLUSDT's confirmed breakout above $180 would be a major technical signal. It would likely send Solana toward the $210 to $225 zone, which marks a significant resistance area. This isn’t just psychological; it also aligns with the 61.8% Fibonacci retracement, a level where institutional players often begin offloading positions
💎As for the downside, support remains solid between $155 and $160. This region is protected by both horizontal demand and dynamic support from key moving averages, offering bulls a stable base to defend. Adding to the bullish case is a potential golden cross formation between the EMA-50 and EMA-200, a signal that, if confirmed, could inject even more confidence into Solana’s price action.
Paradisers, strive for consistency, not quick profits. Treat the market as a businessman, not as a gambler.
MyCryptoParadise
iFeel the success🌴
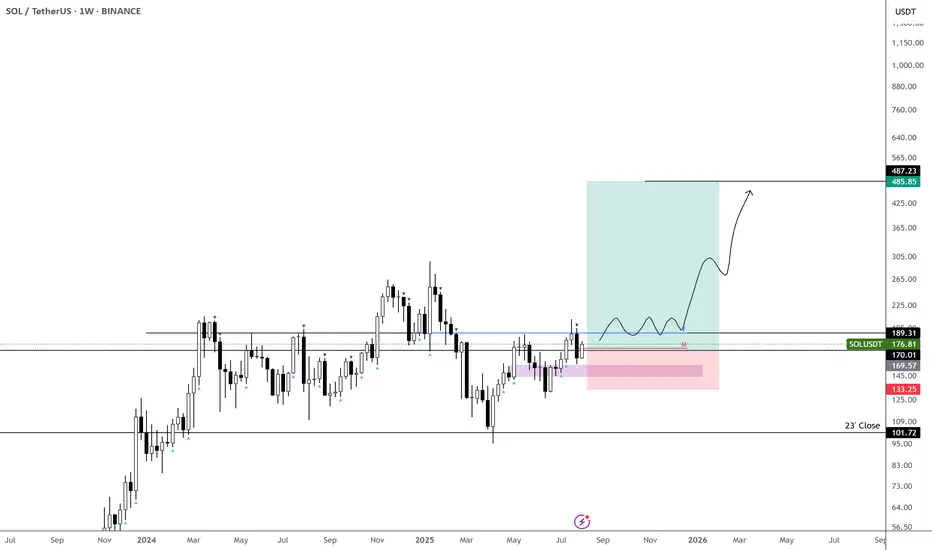
Solana Trades Above $200: New ATH Revealed, Next Target & MoreSolana has been consolidating within a very wide range since February 2024. Solana ended its bear market December 2022. The market bottom was followed by a quick bounce and accumulation phase at low prices.
A 280 days long consolidation (Dec 2022 - Oct 2023) produced a rise from $20 to $210 ending March 2024. From this point forward we have a new long consolidation period but this time instead of 280 days SOLUSDT has been ranging for 525 days. Imagine how strong the next advance will be.
280 days of consolidation was enough to produce 10X growth.
Solana produced a low recently in April and has been recovering since. Prices from late February 2024 through present day form part of a sideways consolidation channel. This period is reaching its end.
The last low marked the end of this period and the start of the next bullish wave. This bullish wave is ongoing now and soon Solana will break local resistance and hit a new all-time high.
Right after the all-time high the first resistance zone of importance is $415 ($420 in some cases). Next we have $667 ($620 in some cases) and these are the levels to watch.
Current market conditions support a rise on SOLUSDT reaching $900 - $1,100.
Soon we will know if the market can continue even higher. For now these are the targets for this 2025 bull market. We are only weeks away from a major frenzy.
Namaste.

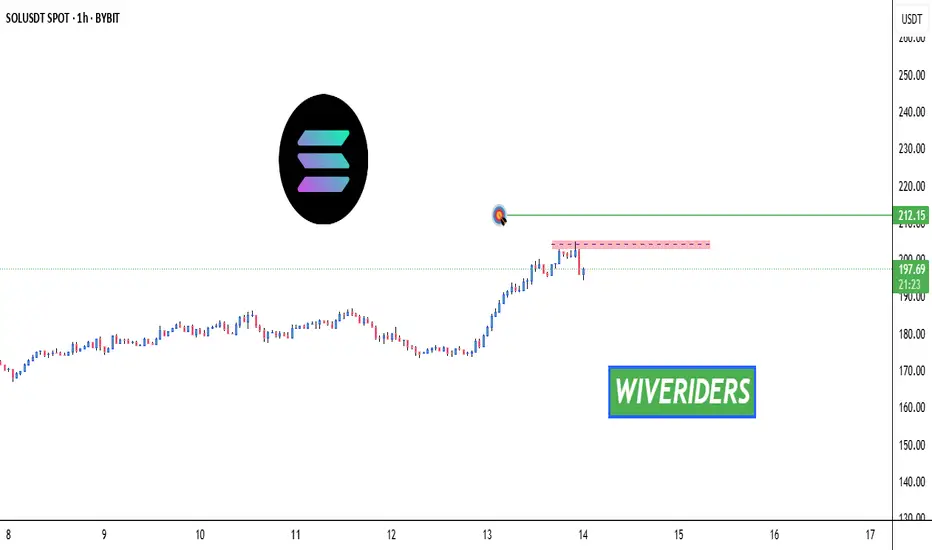
SOL Breakout Watch – Testing Key Resistance! 🚨 SOL Breakout Watch – Testing Key Resistance! 🔴⏳
SOL is testing the red resistance zone right now.
📊 If a breakout confirms, the next move could target:
🎯 First Target → Green line level
A strong breakout here could open the door for further bullish momentum.
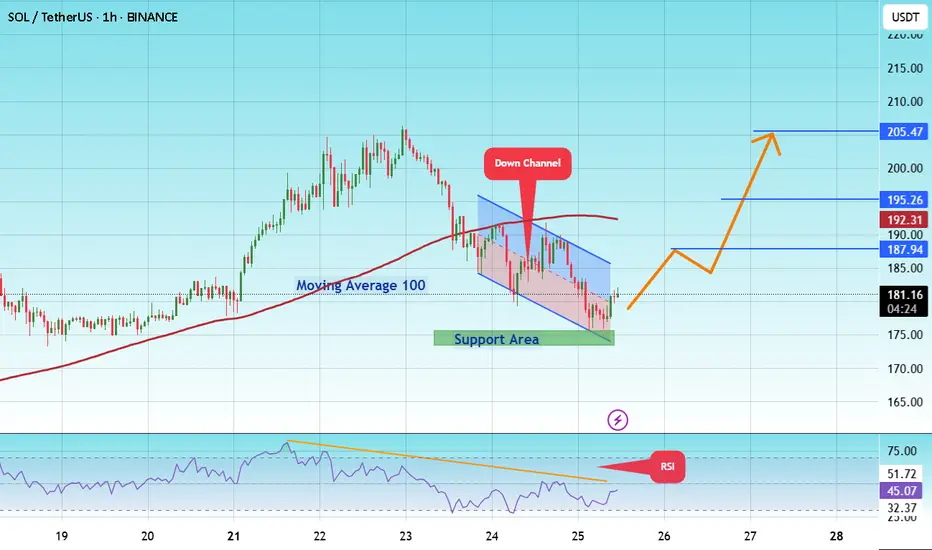
#SOL/USDT coin market structure analysis#SOL
The price is moving within a descending channel on the 1-hour frame and is expected to break and continue upward.
We have a trend to stabilize above the 100 moving average again.
We have a downtrend on the RSI indicator that supports the upward move with a breakout.
We have a support area at the lower boundary of the channel at 175, acting as strong support from which the price can rebound.
We have a major support area in green that pushed the price upward at 174.
Entry price: 181.
First target: 187.
Second target: 195.
Third target: 205.
To manage risk, don't forget stop loss and capital management.
When you reach the first target, save some profits and then change the stop order to an entry order.
For inquiries, please comment.
Thank you.
SOLANA Potential Bullish Breakout OpportunitySolana seems to exhibit signs of a potential Bullish Breakout on the Shorter timeframes as the price action may form a credible Higher High with multiple confluences through key Fibonacci and Support levels which presents us with a potential long opportunity.
Trade Plan:
Entry : CMP
Stop Loss : 172
TP 1: 202.5

It’s Been a While... $SOL is back!
CRYPTOCAP:SOL has been stuck in a 100–200 range for a while now, with anything outside acting as a liquidity grab before reversing.
Back in March, the market was trying to print a bearish signal (obviously failed), so I didn’t have a clear picture then. Now, it’s back on track.
The monthly isn’t as satisfying as other charts—candle lacks strength and closed below the yearly open. That said, price just tapped the $100 range low, so naturally the next big expectation is a break above $200 with conviction and new highs.
I don’t think CRYPTOCAP:SOL will be the highlight of crypto this cycle, but there’s still a potential 2x from here worth taking advantage of.
Smart money levels for $SOLUSDT, don't miss this zoneSolana continues to respect its long-term rising support line, showing strong underlying strength.
After a solid accumulation phase in early 2023 that led to a sharp rally, SOL is now in another accumulation zone just below its all-time high of $296.
A clean breakout from this range could set the stage for a major move into uncharted territory.
DYOR, NFA
