SOLANA – Key Support Retest, Watching HTF Structure CloselySOL is interacting with one of the most important HTF zones on the chart — the multi-year support level that has repeatedly defined trend transitions. This zone has served as structural support during expansion phases, a breakout base during the run toward all-time highs, and later as a liquidity pool during corrective cycles. Every major deviation from this line has led to a significant move in the opposite direction, making this retest highly meaningful.
Earlier in the chart, support broke and produced a full liquidity sweep, clearing long-position stop clusters before price reclaimed the level and initiated a multi-month advance. The presence of an order block just above this zone adds additional structure: it acted as a redistribution area during the breakdown, and later as the origin of re-accumulation. The recent taps into this region suggest the market is again probing for resting liquidity and responsive buy orders.
Price is now compressing between HTF support and declining 50/100 EMAs, creating a classic higher-timeframe squeeze. EMAs continue to slope downward, signaling a bearish macro trend, but candles remain supported at the long-term horizontal level. This type of compression typically resolves with a decisive expansion once liquidity is absorbed from one side.
The FVG Reaction Zone earlier in the trend shows how SOL tends to return to inefficiencies before choosing direction. The current circled region may represent the same behavior on a larger scale — an attempt to rebalance price before either reclaiming the EMAs or continuing displacement lower.
Momentum indicators add another layer: Stoch RSI is turning upward from deeply oversold territory, suggesting momentum exhaustion on the downside but not yet confirming a trend reversal. Historically on this timeframe, these rotations have preceded multi-week expansions when aligned with structural reclaim, but have also failed when EMAs continued to reject price.
Overall, SOL is positioned at a pivotal HTF decision point:
Hold support → potential base formation and EMA reclaim attempts
Lose support → opens the door to a fresh liquidity sweep into prior structural lows
Until a break in structure or EMA reclaim occurs, this remains a compression zone with elevated importance for trend continuation or reversal.
Solusdt

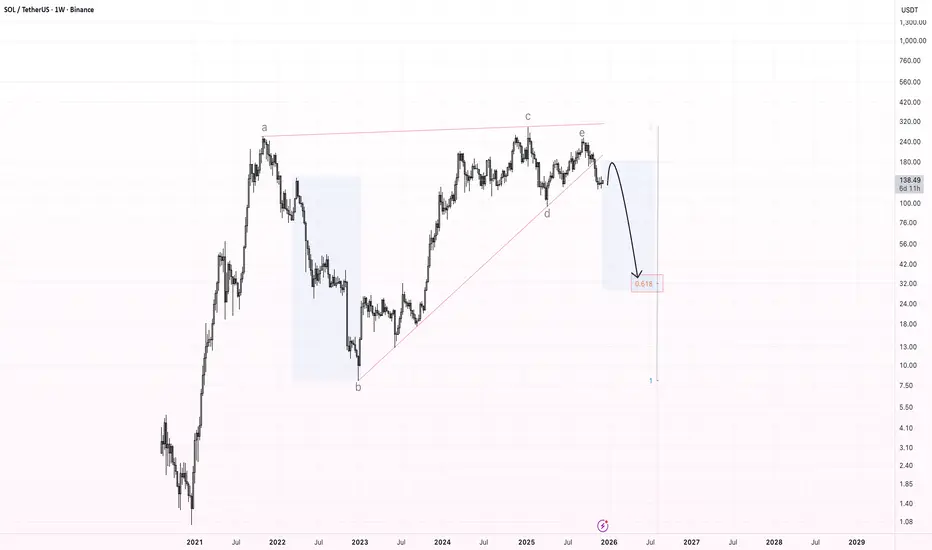
SOL – Bearish Rising Wedge Breakdown (Weekly Chart)The chart shows a large multi-year bearish rising wedge , which has now been broken to the downside. This wedge has been forming since the 2022 bottom and consists of clear wave structure (a–b–c–d–e), with the final wave e rejecting at the upper boundary and triggering the breakdown.
After this kind of pattern, the market often provides a relief bounce back into the broken support , which should now act as resistance . For SOL, the expected retest zone is located around $170–$190.
If price confirms resistance there, I expect the beginning of a larger downward wave , targeting the main Fibonacci zone near the 0.618 retracement, which aligns with a long-term target around $30–$40.
This zone marks the primary downside target for a full wedge breakdown.
Key Points:
Multi-year bearish rising wedge has broken.
Expected retest: $170–$190.
Major downside target: $30–$40 (0.618 zone).
Potential start of a macro corrective wave.
SOL at a Major Turning Point — Big Move Ahead#SOL
SOL is sitting right on its major weekly support, a zone that has held the chart together multiple times. This area is still acting as the main foundation for the current structure 🧱
If SOL can bounce from here and push back into the resistance zone above, the chart opens the door for a larger continuation toward the upper distribution area 🚀
We can already see how clean the structure becomes once price reclaims that mid-zone.
But if this major support fails to hold, SOL could slide into the deeper accumulation zone — a long-term area where strong buyers usually step in 👀
Right now, SOL is at a critical point. How it reacts here will shape the next big weekly move. Stay patient and follow the reaction, not the prediction ⚡
#SOLUSDT

SOL in descending channel ready for jump 28% gain toward 170$Hi the support and resistances on the chart are based on the previous data and weekly candlesticks if BINANCE:SOLUSDT holds this last support the potential of 28% gain is logical toward 170$

SOLUSDT – Gains Limited, Price Faces a Key Decision ZoneHello everyone, SOL experienced an impressive upward move over the past weekend, but the current momentum has noticeably weakened as the price hits the EMA 89 (blue), an area that has previously created strong selling pressure last month.
After bouncing around the 145 USD mark, SOL retraced to test both EMA 34 (red) and EMA 89, forming a critical convergence zone to determine the next direction. Recent candles show long upper wicks accompanied by decreasing volume, indicating that buyers are losing strength compared to the previous breakout while profit-taking pressure is rising. The market structure has yet to confirm an uptrend, as SOL has only slightly broken local highs without forming a clear higher-high, explaining why the price was rejected at EMA 89.
From a macro and capital flow perspective, over the past 48 hours, the Solana ecosystem has shown a positive recovery, with several DeFi projects and memecoins rallying. However, capital inflows into altcoins have paused as investors await updates from the Fed and US economic data. Bitcoin is currently moving sideways, meaning the primary market momentum supporting altcoins, including SOL, is insufficient to drive a breakout. Therefore, even positive news is not yet strong enough to establish a new trend.
Wishing everyone successful trading!

Big Money Is Pouring Into SOL – Is a Breakout Coming?When large capital starts flowing into Solana , SOLUSDT is no longer just another altcoin — it’s becoming a new safe haven for risk-on liquidity. Forward Industries recently announced that it now holds over 6.9 million SOL , making it one of the largest Solana treasuries in the world — a clear sign that institutional players are not just talking, but actually deploying capital.
On the technical side, the chart shows that SOL has broken away from its bottom structure and is now holding beautifully above the Ichimoku cloud. The area around 138 USDT has emerged as a new support zone: price has retested it multiple times without breaking, turning it into a solid base for accumulation. The current structure of higher lows confirms that buyers are still in control of the trend.
The most bullish scenario: SOLUSDT continues to consolidate above 138, compressing like a spring, before making a push toward the 153 USDT resistance area — exactly as projected on the chart. As long as price stays above 138 and the Ichimoku cloud remains below, the priority remains to buy dips, not to fight the trend.
In short, institutional inflows combined with a strong technical structure suggest that SOLUSDT is in a healthy, sustainable uptrend , and the current pullback looks more like an opportunity to enter, rather than a sign of weakness.

SOL 1W – FVG Cleared/Fib Reset Tagged, Is the Reversal Starting?SOL has reached a major confluence area on the weekly chart, tagging the broader Fib Reset Zone and reacting directly from long-term Trendline Support. This is the same structural level that launched previous multi-month rallies, making this an important point for potential reversal.
Price is also sitting just above the 0.618 retracement — historically one of SOL's strongest reaction levels — while the weekly Stoch RSI is emerging from oversold conditions, a signal often seen near macro turning points.
The declining 50/100 EMAs still create overhead pressure, but reclaiming these EMAs would confirm a shift in weekly trend structure and open the door for a broader recovery leg.
If the trendline fails, the lower demand zone becomes the next logical retest. But as long as SOL continues to defend this diagonal and build higher closes inside the Fib Reset Zone, the case for reversing the multi-month downtrend strengthens.
This is one of the most important weekly levels SOL has approached all year.

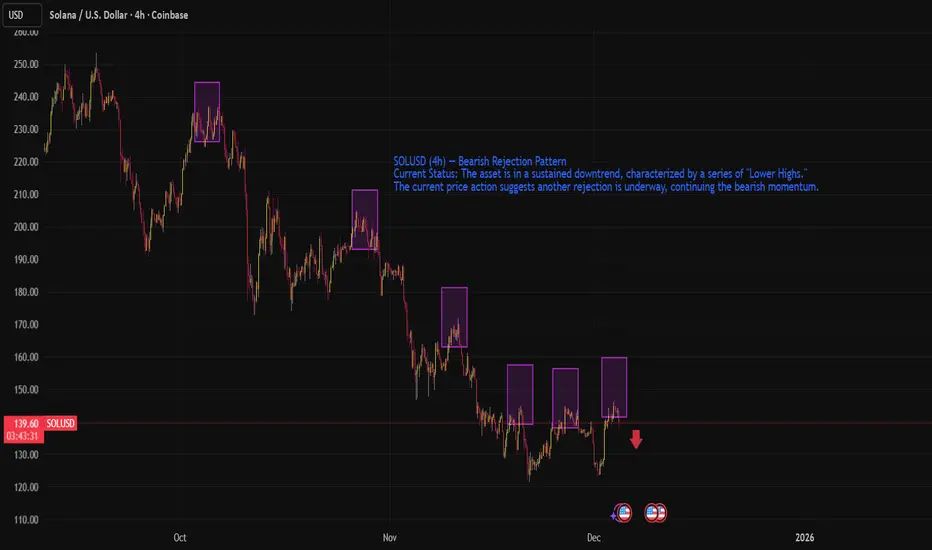
SOLUSD (4h) — Bearish Rejection PatternSOL/USD is in a sustained downtrend, characterized by a series of "Lower Highs." The current price action suggests another rejection is underway, continuing the bearish momentum.
1. Price Action: The "Lower High" Structure
The chart visually highlights (via purple boxes) a classic bearish market structure. Since the high near $240, SOL has failed to reclaim previous peaks.
The Pattern: Each rally attempt (purple box) runs out of momentum at a lower price point than the previous one ($240 -> $210 -> $180 -> $160 -> $140).
Current State: The price recently rallied into the $150-$160 zone (the right-most purple boxes) and is currently reacting negatively, dropping to $139.83.
The current setup suggests a short opportunity as the price rejects off the most recent lower high.
SOLUSD: Breakout from Bottom Structure Inside Downtrend ChannelHi!
SOL has been trading inside a descending channel, consistently respecting both upper and lower boundaries. Recently, price formed a clear Inverse Head & Shoulders at the bottom of the channel, signaling potential bullish reversal momentum. The neckline breakout aligns with the break of the minor descending trendline, strengthening the shift in structure.
If price holds above the neckline, the pattern projects a move toward the 160–165 USD zone, which also aligns with the channel’s upper boundary, a strong confluence area and natural target for bulls.
However, failure to sustain above the neckline could lead to a pullback toward the right-shoulder region, though the setup remains valid as long as price stays above the head level.
Overall, SOL is showing a bullish reversal signal, with upside continuation favored while above the breakout zone.

SOL for $79?Greetings to all 😊
Many people in their personal messages asked about the possible further movement of the SOL coin, after it reached the previously designated goals (see the last review)
💡 I can say one thing: while the asset is trading under the important level of $189.31 , it is not worth considering purchases for a long time, since the context is short
◾️ The global picture looks like this: we have a 12M chart that shows the reaction from the zone of interest and the price moving below the support level
◾️ I would like to note that we also have the min of last year, which has accumulated liquidity - 79$
⚡️ All timeframes are in a descending structure
▫️ If the price does not recover its values > 180$ this month, then I will expect a decrease to low (79$)
▫️ on the chart of the month , the price is trading sideways
▫️ We have removed the nearest liquidity on the weekly chart and are showing a corrective movement
▫️ On the daily timeframe, the price came to trend support and is trading sideways
Here we are interested in two zones between which the price is squeezed:
resistance of $ 145 - $ 151
and support of $133.74 - $ 137.76
📌 While the price is in uncertainty between sellers and buyers, it is better to wait for the manifestation of one side and then make a decision.
📍 And remember: not every deal is your deal.
Good luck to all ☘️

The Convergence and Evolution of AI and BlockchainThe Convergence and Evolution of AI and Blockchain: Reconstructing Productivity and Production Relations in the New Digital Economy Paradigm
Authors: SanTi Li, Chunfeng Jun, Lisa, Nahida
Abstract: Current market discussions regarding the relationship between Artificial Intelligence (AI) and Blockchain (Crypto) are often limited to a zero-sum game perspective focusing on liquidity fragmentation. However, in-depth industry analysis and technological evolutionary paths suggest that the two are, in fact, complementary and symbiotic. Against the backdrop of AI driving exponential productivity growth and trending digital content supply toward infinity, the reconstruction of production relations and ownership mechanisms based on blockchain is not merely "icing on the cake," but a fundamental necessity. This article aims to deeply analyze—from the dimensions of reshaping trust mechanisms, establishing ownership systems, shifting economic paradigms, the importance of Tokens as value carriers, and risk control—why the widespread adoption of AI will become the core driver and accelerator propelling blockchain technology from fringe experiments to large-scale application.
1. The Digital Trust Crisis in the Wake of the AI Explosion
With recent breakthrough advancements in AI technology, particularly the widespread application of Large Language Models (LLMs) and Generative AI (AIGC), the core economic significance lies in reducing the marginal cost of content production to near zero. While this has tremendously unleashed social creativity and productivity, it also poses an unprecedented challenge to the existing internet ecosystem, leading to drastic changes in the information environment.
Entropy Increase and Distortion in the Digital Information Ecosystem: With the proliferation of Synthetic Media and Deepfakes, the internet faces the tangible risk of the "Dead Internet Theory." Under this theory, the vast majority of network traffic and content will be generated by bots. When the cost of forging video, audio, and text is extremely low and can achieve pixel-level realism,⚡ the traditional cognitive argument of "seeing is believing," which sustains social operations, faces a total threat of failure in the digital realm. Political elections could be disrupted by forged scandal recordings, and financial fraud can be perpetrated against individuals via real-time face-swapping. These are no longer sci-fi scenarios from Black Mirror, but imminent realities.
Exacerbated Information Asymmetry and Cognitive Overload: When the rate of machine-generated content exceeds human creation by several orders of magnitude, high-quality authentic information risks being submerged. Humans face exponentially rising screening costs when ensuring the veracity of massive amounts of machine-generated information that may carry specific biases or misleading data. This information overload not only reduces decision-making efficiency but may also lead to a tearing of social consensus. In particular, 👼t he new generation growing up with AI will have a much higher degree of trust in AI than the generation that invented AIGC, thereby increasing the probability of being misled or blindly following algorithms.
The Scarcity of Human Inspiration Amidst AI Convenience: It is well known that a significant part of the value distinction between humans and robots lies in human inspiration, which is difficult for AI to mimic. However, human laziness is also a driver of technological progress. Due to the immense increase in convenience, reliance on AI may make future inspiration an absolute "luxury." Meanwhile, the intellectual property of these inspired creators is being ruthlessly plundered and diluted by the extreme speed of AIGC (much of current secondary creation involves unauthorized "content spinning"). Without technical means of protection, the motivation for original human creation will dry up.
In this context, the primary systemic risk facing digital society is not the awakening or rebellion of AI, but the complete collapse of the bedrock of social trust. Building a verification mechanism that can effectively distinguish truth from falsehood, establish information sources, and remain tamper-proof has become a necessary condition for maintaining a healthy digital ecosystem—and this is precisely where blockchain technology finds its purpose.
2. Blockchain Ownership: Evolving from "Optional Component" to Digital Infrastructure
In the "infinite supply" model constructed by AI, scarcity will become the core anchor of digital asset value. Without scarcity constraints, the value of digital content will approach zero as supply increases infinitely, much like a flood of diamonds.💎 Blockchain technology, as a decentralized distributed ledger, functions essentially to establish digital scarcity and ownership attribution through cryptographic means, thereby re-imbuing digital assets with value.
Institutionalization of Data Provenance: As the barrier to content generation lowers, distinguishing between "human creation" and "AI generation" becomes crucial. In 2022, a custom hand-drawn cartoon could sell for hundreds of dollars💵💴(I bought it 🥹), whereas in 2025, similar non-high-precision custom content can be completed in seconds. The on-chain storage of high-value data (such as news reports, artistic creations, legal contracts, academic papers, and identity information) will become an industry standard. Every digital file will need to carry an unforgeable "birth certificate" and "chain of custody." Digital content lacking a Cryptographic Signature and on-chain timestamp will face a severe "trust discount." The combination of C2PA (Coalition for Content Provenance and Authenticity) standards and blockchain technology will build a trusted verification layer for digital content, making the source and modification history of content transparent to all.
Proof of Personhood and Anti-Sybil Attacks: In an era where automated bots can pass the Turing Test and flood the network, the economic and social value of verifying a user's "human identity" is increasingly prominent. Traditional CAPTCHAs are gradually failing and cannot stop advanced AI Agents. Identity verification systems combining biometrics and Zero-Knowledge Proofs (ZKP) will become key infrastructure for distinguishing human users from AI agents. This is not only to prevent airdrop farming but also to prevent online voting and public opinion manipulation by zombie botnets.
In summary, AI creates an infinite supply of productivity, while blockchain provides trusted scarcity constraints and identity anchors. Logically, the two constitute indispensable complementary gears in the digital economy loop: AI makes the world "faster," and Blockchain makes the world "truer."🚀
3. Reconstruction of the Commercial Paradigm: Autonomous Agent Economics
The combination of AI and blockchain heralds a brand-new mode of economic interaction—the rise of the Machine-to-Machine (M2M) economy. This is not just a change in payment methods, but a fundamental transformation in the nature of economic entities.
Future internet interaction subjects will no longer be limited to humans; billions of Autonomous AI Agents will become natives of cyberspace. Traditional financial infrastructure (such as bank accounts, KYC processes, credit card payment networks) is designed for humans; it does not possess the capability to serve non-human subjects, nor can it meet the demands of high-frequency, micro-amount, 24/7 machine transactions.
Machine-Native Currency Systems: Cryptocurrency is a medium of value exchange naturally adapted to machine logic. AI agents cannot walk into a bank branch to open an account, but they can instantly generate wallet addresses via code and manage private keys. They can utilize stablecoins (like USDC) or specific utility tokens for data procurement, API calls, or computing power leasing. This payment method is not constrained by the intermediary barriers, business hours, or high cross-border fees of traditional finance.
Agent-to-Agent (A2A) Economic Networks: The future commercial landscape will evolve beyond B2B and B2C models toward an A2A (AI Agent-to-AI Agent) 🤖model. For example, an AI Agent responsible for itinerary planning may need to purchase real-time data from another Agent responsible for weather forecasting and pay a deposit to a third Agent responsible for ticket booking. These service exchanges involving micropayments and high-frequency transactions are only economically feasible when relying on high-performance, low-friction blockchain networks. Smart contracts will automatically execute these complex business logics without human intervention.
Synergy with Decentralized Physical Infrastructure Networks (DePIN): The operation of AI requires massive amounts of computing power (GPUs) and data. Through DePIN networks (such as io.net, Render, Gensyn), AI Agents can directly lease idle personal or corporate computing power globally and settle in real-time using Tokens. To a certain extent, this breaks the monopoly of centralized cloud service providers (AWS, Google Cloud), reducing the operational costs of AI. It also provides real utility scenarios for blockchain (although initially, the core source of computing power may still come from traditional giants, in the long run, this model will empower market autonomy and gradually dismantle absolute monopolies).
It is foreseeable that while human users conduct daily mobile payments, AI Agents will automatically complete massive value exchanges on backend blockchain networks, forming a colossal and efficient shadow economy.
4. Crypto: The Value Carrier and Symbiotic Engine of Ownership in the AI Era
Blockchain is not just a database; it is a value network. After clarifying the technical level of anti-counterfeiting/provenance (Section 2) and the commercial level of agent interaction (Section 3), we must delve into the core of assets and finance. Property Rights are the prerequisite for transaction and pricing. In the "infinite supply" model constructed by AI, relying solely on technical means for "anti-counterfeiting" is far from sufficient. We can use Crypto to truly Tokenize and Financialize these rights, giving rise to the RWA (Real World Asset) concept.
The Token, as the granular carrier of ownership and the lifeblood of equity circulation, constitutes the indispensable digital property rights cornerstone of the AI era. This upgrades AI and Crypto from a simple "tool stacking" to a deep "symbiotic evolution."
Tokenization🪙: Transforming abstract rights into programmable digital assets. Crypto uses NFT (Non-Fungible Token) and SFT (Semi-Fungible Token) technologies to transform abstract intellectual property (IP), ownership, copyright📜, unique datasets, fine-tuned model parameters, or even the ownership of an AI Agent itself into unique, immutable on-chain assets.
IP-NFTs as Value Anchors: Every unique style or original work of a human creator can be minted as an NFT. When AI needs to access these works for training or style transfer, it is no longer a traceless plunder but must obtain NFT authorization through on-chain protocols. Here, the Token is not only a copyright certificate but also proof of the right to earnings. For example, RWA music projects like Opulous and Audius tokenize artists' album rights to share revenue with fans in advance.
Data Assetization (Data Tokens): High-quality data from individuals or companies is no longer a static file but an asset that can be encapsulated into Tokens for trading. Every time an AI model calls upon data, it essentially consumes the rights represented by that Token, thereby generating refined revenue and rights protection.
Crypto: Realizing Immediate Settlement and Circulation of Ownership Value Ownership is meaningless if it is not linked to value distribution. Digital currency provides the only execution layer for equity ownership in the AI era.
Micropayments and Streaming Payments: In the high-speed operation of AI, ownership verification often occurs at the millisecond level (e.g., AI quoting a sentence or generating an image). Traditional fiat currency systems cannot handle such extremely small amounts ($0.0001) and high-frequency copyright revenue sharing. Digital currency (Crypto) enables smart contracts to automatically "stream" revenue to Token holders the instant ownership is verified, realizing a closed loop of "use equals ownership verification, ownership verification equals settlement."
Construction of the Incentive Layer: Why would humans spend energy verifying the authenticity of AI content? Why would nodes contribute computing power to maintain network consensus? Because there is Crypto as an incentive. Tokenomics rewards participants who maintain the ownership system through digital currency, thereby building a self-running trust network resistant to AI attacks. This is also the core value of public chain systems and corresponding projects; the internal circulation or local circulation models of consortium chains and private chains are difficult to generalize to a larger scale.
The Co-Evolution of AI and Crypto: A Double Helix Ascent
AI Needs Blockchain/Crypto: Without the ownership and payment facilities provided by blockchain systems, AI creators and users will easily fall into a dead end of rampant piracy, data exhaustion, and inability to monetize. The smarter the AI, the more it needs clear property boundaries to avoid disputes. The current freshness of AI creation exists because of the accumulation of data and creative sharing over the past decades; when these accumulations are exhausted, whether new creativity can fill the gap depends heavily on the meticulous protection of rights.
Crypto Needs AI: AI creates massive amounts of digital assets and high-frequency trading scenarios, providing unprecedented Utility and liquidity for Crypto.
This symbiotic relationship indicates that Crypto is the "Physics" and "Economic System" of the AI era. The combination of the two will reconstruct the production relations of the digital world, allowing the productivity dividends of AI to be fairly returned to every participant through ownership mechanisms.
5. Risk Governance: The Paradigm Shift from "Moral Self-Discipline" to "Technical Constraint"
Current AI development is highly concentrated in a few tech giants (like OpenAI, Google, Meta), continuing the centralized black-box logic of the Web 2.0 era. In this model, the public can only hope that companies maintain a moral self-discipline of "Don't be evil." However, historical experience shows that centralized power is often accompanied by risks of monopoly, data abuse, and algorithmic bias.
Blockchain technology introduces a governance logic of "Can't be evil," strictly constraining system behavior through open-source code, cryptographic proofs, and mathematical contracts:
Zero-Knowledge Machine Learning (ZKML): As an important branch of privacy computing, ZKML allows verifying through mathematical proofs that the inference process of an AI model was executed according to a set algorithm and has not been tampered with, without revealing underlying sensitive data (such as medical records, financial transactions) or core model parameters. This ensures the transparency and auditability of algorithmic decisions, which is crucial for AI applications in high-risk fields like medical diagnosis and credit assessment, solving the "black box trust" problem.
Moreover, public chains that have experienced multiple bull and bear cycles offer a degree of reputational assurance. #NEAR has fully pivoted to AI as the first AI public chain, while projects like Render have transformed from game rendering to AI computing power. BINANCE:ETHUSD ETH, BINANCE:BNBUSDT BSC, #Solana, Cardano, BINANCE:AVAXUSDT #Avalanche, Algorand, Hbar, BINANCE:CFXUSD #Conflux, and others all have their own unique domain advantages, technical characteristics, and deficiencies. Emerging public chains like #Monad BYBIT:MONUSDT are also facing a new round of tokenomics examinations. Addressing the "VC long-cliff" unlock model that has plagued the primary market in the past two years—where institutional chips are locked, but project ecosystem incentives and airdrops circulate early, leading to heavy selling pressure—the market still needs 1-2 years to verify the balance between their token release curves and ecosystem value capture.
Data Sovereignty and Value Distribution: Addressing the widespread issues of data infringement and "data harvesting" in large model training, blockchain projects can return data ownership to users, allowing them to selectively authorize data for training and receive earnings. This reconstructs production relations, enabling data contributors to receive reasonable value returns through Token economic models, thereby incentivizing a higher quality data supply and avoiding the "tragedy of the commons" regarding data exhaustion.
6. Conclusion: Digital Civilization's Dialectic—Reshaping the Future in Chaos and Order
The essence of Artificial Intelligence tends toward entropy increase—it brings about an explosive generation of information, rapid expansion of boundaries, and future uncertainty. The essence of Blockchain, however, tends toward entropy reduction—it strives to establish immutable contracts, anchor unique factual truths, and solidify execution rules.
A robust digital world cannot be composed solely of vibrant "chaos" or absolutely stable "order." The deep integration of AI and Blockchain is not a simple technological stacking, but the inevitable result of the digital ecosystem seeking dynamic equilibrium. If AI is the nuclear power engine driving digital civilization forward, then Blockchain is the navigation system and safety foundation ensuring it does not derail.
For investors and industry practitioners, understanding this "Double Helix" evolutionary trend means grasping the underlying code of digital economic development for the next five to ten years. Our gaze should not be limited to the AI computing power race but should also extend to the Web3 infrastructure layers that provide payment settlement, property definition, and value circulation for silicon-based life.
The future has arrived. This great convergence, beginning with technology and ending with institutions, is on the eve of explosion.
Disclaimer: This article is for educational purposes only. Projects mentioned are for relatively objective description and do not constitute investment advice. Please perform your own research (DYOR).

SOL / USDT : Accumulation zone for upcoming rallySol / USDT is currently trading at an attractive discount and is looking promising for a strong rally once the market stabilizes and shows bullish momentum.
This zone can offer a good opportunity for accumulation, but patience and confirmation are important.
Do your own research before investing. This is just my opinion.

SOL/USDT: Bearish Structure Intact Below 155 Confluence ZoneSOL/USDT is approaching the 150–155 resistance cluster, where key technical levels—including the descending trendline, horizontal supply, and local upward trendline—converge. Despite a sharp rebound, the overall trend remains bearish, with lower highs dominating the structure. Recent price action appears corrective, not impulsive, suggesting this move may be a retracement rather than a true reversal.
If price gets rejected from this confluence zone, the bearish continuation toward 133 becomes the base case. Deeper downside could follow toward the mid-channel support unless bulls reclaim ground decisively.
➡️ Primary scenario: Rejection from 150–155 → drop toward 133
❗️ Risk scenario: Break and close above 155 would flip bias short-term bullish.

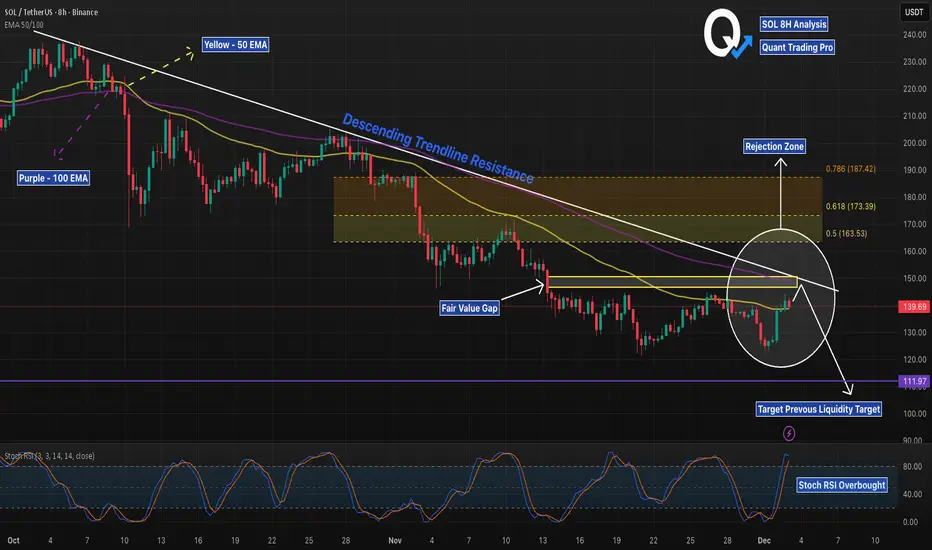
SOL 8H – FVG + EMA Rejection, Liquidity Next?SOL has tapped a clean multi-confluence rejection zone: the descending trendline, the 50/100 EMA cluster, and a filled Fair Value Gap all stack at the same price level. This area has acted as a strong pivot throughout November, and today’s reaction is consistent with prior trendline rejections.
The Stoch RSI is already in overbought territory on the 8H, adding momentum exhaustion to the setup. Bears will watch for continuation toward the major liquidity level around $111.97, which remains untested below.
For bulls to regain control, price must break and hold above the EMA cluster and FVG, flipping the trendline into support. Until then, the path of least resistance remains down toward liquidity.
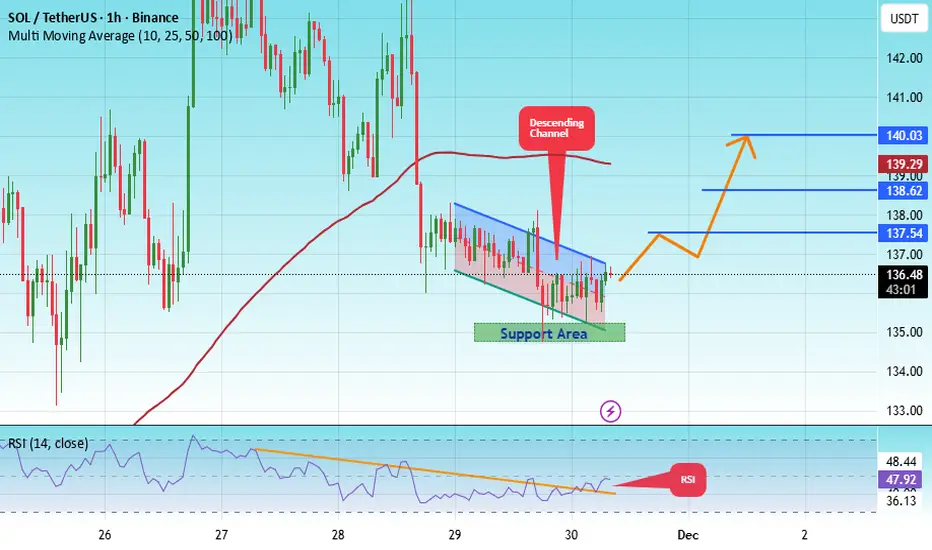
#SOL/USDT Final Liquidity Zone Before Expansion?#SOL
The price is moving in a descending channel on the 1-hour timeframe. It has reached the lower boundary and is heading towards breaking above it, with a retest of the upper boundary expected.
We have a downtrend on the RSI indicator, which has reached near the lower boundary, and an upward rebound is expected.
There is a key support zone in green at 135. The price has bounced from this zone multiple times and is expected to bounce again.
We have a trend towards stability above the 100-period moving average, as we are moving close to it, which supports the upward movement.
Entry price: 136.60
First target: 137
Second target: 138
Third target: 140
Don't forget a simple principle: money management.
Place your stop-loss below the green support zone.
For any questions, please leave a comment.
Thank you.
FireHoseReel | All Eyes on Solana at This Critical Level🔥 Welcome to FireHoseReel!
Let’s jump into the Solana (SOL) market structure.
👀 SOL – 4H Overview
After breaking its descending curve structure, SOL faced strong resistance at $144 but failed to break it, leading to a sharp rejection.
Price then formed a double bottom and pushed back toward the same resistance. SOL is now trading near this critical zone once again.
📊 Volume Analysis
Volume increased significantly during the formation of the double bottom, driving a sharp move back toward resistance.
If buy volume remains sustained, the probability of a breakout above $144 increases.
✍️ SOL Trading Scenarios
You can use the following scenarios alongside your own trading strategy:
🟢 Long Scenario (Breakout Setup)
A confirmed breakout above $144, supported by a strong increase in buy volume, could provide a solid long opportunity on SOL.
🟢 Long Scenario (Aggressive Risk Setup)
Wait for price to consolidate, then enter during the pullback with decreasing volume, followed by the first signs of renewed buying pressure.
This setup allows for a tighter stop-loss and faster R:R, suitable for higher-risk traders.
🔴 Short Scenario
A loss of the key support at $124, accompanied by strong sell pressure, could activate a valid short setup for SOL.
❤️ Risk Management & Emotional Discipline
Crypto trading is highly risky. Without proper risk management and emotional control, trading is no different from gambling.
Logic must always come before emotions. Learn to manage your trades, and enjoy the process of trading with control and discipline.

SOL Near Inflection PointCRYPTOCAP:SOL is holding well above the mid S/R zone and showing solid strength. If it continues to rebound from this area, price could push back toward the upper resistance.
But if SOL breaks below this zone, it may slide down toward the $80 levels.
DYOR, NFA
Please hit the like button if you like it, and share your views in the comments section.

Decision time for #SOLAccording to fib channels, since 2020 September we only see one time degradation of SOL in late December 2020 which responded from -0.236 and starts its rally.
Now we are in the same zone . and have two different scenario in hand:
1. Fib 0 is trying to support the price once again. if we lose this support, price will see 75-80 support level around Fib -0.236 .
Do not want to share any worse scenario but it is also be catastrophic if price lose support of Fib -0.236 .
2. As a positive scenario, Until the end of 2027 we will see the price will rush to the Fib 1 (Approx 1K)
We will see which scenario is going to be validated, but just fingers are crossed for the 2nd scenario.
her name was solanagm,
i'm projecting a push up on solana to about $400 into 2026.
this is my most conservative target.
---
from the lows of 2022, solana has seen one of the most beautiful impulses in the whole market,
the only impulse that was cleaner is probably bitcoin.
---
between june 2023, and march 2024 i believe solana played on a 3rd wave
between march 2024, and april 2025, i believe solana played out an expanded flat w4
everything after is building either an ending diagonal for the final 5th,
or
a potential extended 5th.
---
$400 is the low end for the final 5th, especially if we play out an ending diag.
$549 - $876 is the high end, if solana decides to play out an extended 5th

SOLUSDT /// 30NOVSolana has consistently shown resilience across multiple market cycles, repeatedly demonstrating its ability to establish new price structures and reach fresh targets. Despite this long-term strength, the asset is currently under notable selling pressure. With Bitcoin experiencing a 30% decline, interest from investors and smart money toward Solana has also cooled off.
From a structural perspective, the $149 level remains a significant resistance zone, while the $127 support area appears increasingly vulnerable and may be tested or even broken in the near term.
This brings up a key question for many market participants:
Where could Solana become attractive from an investment standpoint?
In my view, the $100 region is where I would personally begin reassessing Solana for potential long-term positioning—depending, of course, on how price approaches that level and the quality of market momentum at that time.
As always, broader market conditions will play a major role in determining whether Solana can regain strength or continues to consolidate under seller dominance.

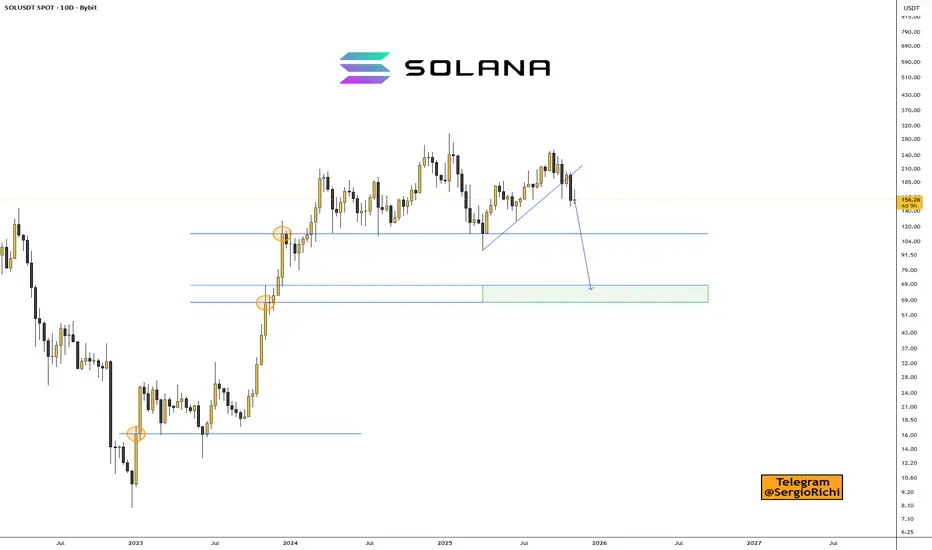
Quick overview for Solana (Nov 12, 2025)CRYPTOCAP:SOL / #Solana Quick overview for Solana (Nov 12, 2025)
We've broken the trendline and are now trading below it on the 10-day timeframe.
No price rebound in sight, so the priority is to wait for a correction with the nearest targets at $60–$70, where we can look for entry points.
Coinglass is sneaky—they won't let you view data beyond a 3-month chart 😡.
➖ Essentially, there's a large order on Coinbase at $52 and on Binance at $79.
➖ We'll focus on $60–$70 and make decisions from there.
Charts:
Solana: Is the Bottom In, or More Downside Ahead? SOL has already climbed more than 15% from last Friday’s low at its peak, potentially signaling the completion of wave ii in orange. For now, however, we’re still keeping open the possibility that this move could dip to a new low—within our green Target Zone ($155.80–$113.20). In any case, once this interim correction wraps up, wave iii in orange should kick off an impulsive rally, only losing steam above resistance at $295.31.

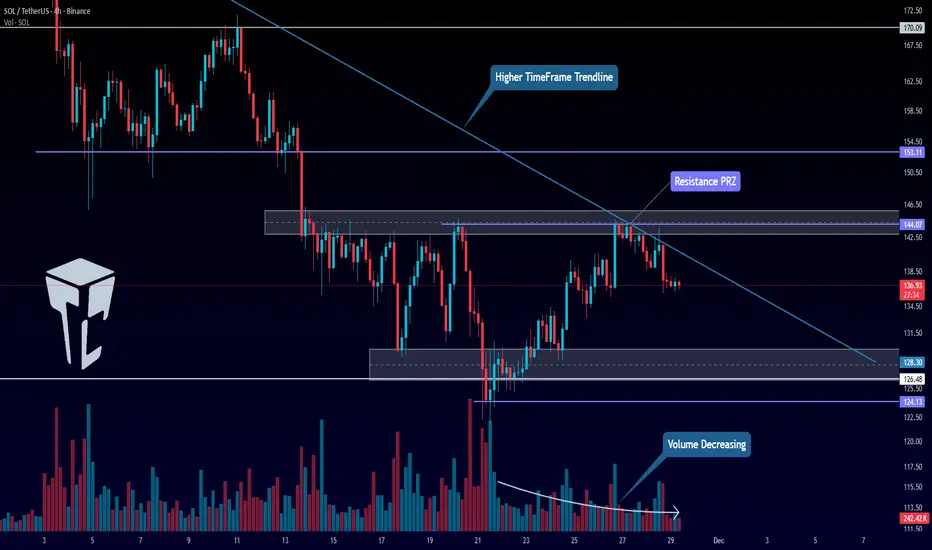
TradeCityPro | SOL Testing Major Trendline for Next Big Move👋 Welcome to TradeCityPro!
In this analysis, I want to review SOL, one of the most popular cryptocurrencies, ranked 6th on CoinMarketCap with a market cap of $76 billion.
⏳ 4-Hour Timeframe
Solana has been respecting a descending trendline coming from higher timeframes. The price has touched this trendline multiple times, and it has interacted with it again recently.
✨ Overall, after completing its previous bearish wave, Solana has formed a range box, and the price has been oscillating between the support and resistance zones I’ve marked for you.
✔️ The top of this box can be identified at 144.07, since the price has reacted to this level twice. However, the entire zone I've highlighted is a significant resistance area.
💡 This resistance overlaps with the descending trendline from the daily timeframe, forming a strong PRZ (Potential Reversal Zone).
💥 On top of that, while Solana was moving from the bottom of the box toward the top, market volume was decreasing, and the size of the bullish candles was very small — both clear signs of weak buying pressure.
📊 Once the price reached the PRZ, sellers entered the market again, and the price is now moving downward along the trendline.
🧩 If this trendline does not break, and the price continues moving downward toward the $126 support, the chances of the support failing increase significantly. In that scenario, a short position can be taken on a break of that support.
📈 However, if the trendline does break, then the 144.07 level becomes the best trigger for trendline breakout confirmation.
⚡️ A stabilization above this zone would give us confirmation of a bullish reversal on Solana and provide a clean setup for opening a long position.
📝 Final Thoughts
Stay calm, trade wisely, and let's capture the market's best opportunities!
This analysis reflects our opinions and is not financial advice.
Share your thoughts in the comments, and don’t forget to share this analysis with your friends! ❤️