#SOL/USDT Bullish trend analysis Read The caption#SOL
The price is moving within an ascending channel on the 1-hour timeframe and is adhering to it well. It is poised to break out strongly and retest the channel.
We have a downtrend line on the RSI indicator that is about to break and retest, which supports the upward move.
There is a key support zone in green at the 137 price, representing a strong support point.
We have a trend to stabilize above the 100-period moving average.
Entry price: 141
First target: 143
Second target: 145
Third target: 148
Don't forget a simple money management rule:
Place your stop-loss order below the green support zone.
Once you reach the first target, save some money and then change your stop-loss order to an entry order.
For any questions, please leave a comment.
Thank you.
Solusdt

$SOL Support Siege – Rebound Rocket or Meme Coin Mayhem?BINANCE:SOLUSDT CRYPTOCAP:SOL Support Siege – Rebound Rocket or Meme Coin Mayhem?
Altcoin Pioneers! 🔥 SOL/USDT 1H is grinding down that black descending trendline, now teetering on key support at ~137 after a vicious rejection at resistance 160. DeFi darling holding tough amid BTC bleed, but that red hammer wick screams indecision – volume's key to the breakout.
Hold support? Prime setup for a V-reversal if buyers stack in; RSI dipping to 30 with bullish divergence. Breakout above resistance? Explosive on Solana upgrade news, targeting 165. Deeper dip risk? Oof – crack it and 132 (Fib 0.5) looms, dragging alts lower.
Target: Snapback to 148 if holds, slide to 135 on fail. Watching: Stochastic oversold cross, ATR for vol spike, and SOL/BTC for relative strength. Sol squad, HODL or fold? 🚀📉
#SOL #SolanaAnalysis #CryptoTrading

$SOL Bearish Channel Squeeze Toward Support TestBINANCE:SOLUSDT CRYPTOCAP:SOL Bearish Channel Squeeze Toward Support Test
SOL in tight downtrend channel, eyeing critical support at $124 after breaking lower.
Potential bounce to $140 if holds, targeting $155 resistance breakout; deeper risk to $110 on failure.
Watching RSI oversold for reversal, MACD crossover bearish, volume thinning. 📉⚠️
#SOL #AltcoinTrading #CryptoAnalysis

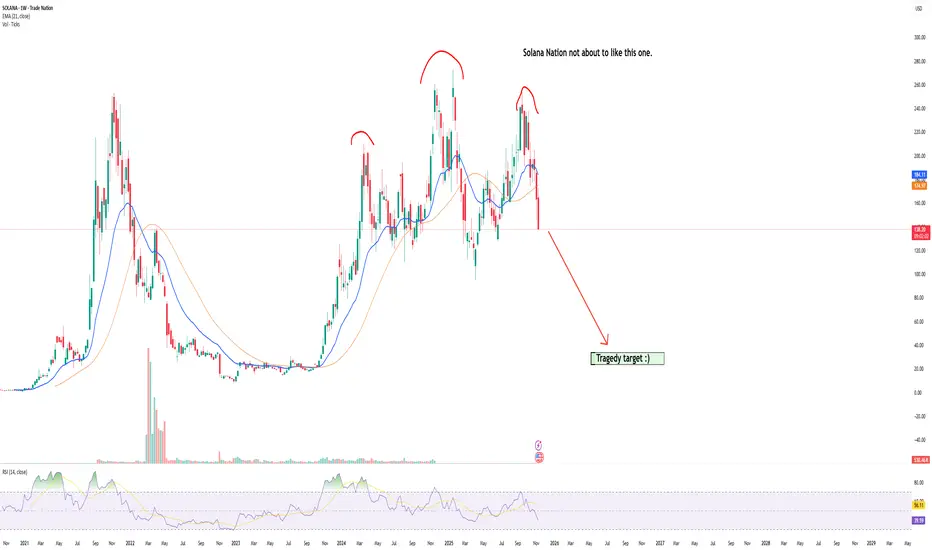
Solana tragedy incomingEvery downfall creates buy oportunities. :) Every tragedy is soil for another flower...
usdt.d 4dHello
I am Mehdi with 4-hour analysis
Based on the analysis, we expect the cryptocurrency market to start a new upward trend
Reasons
1. We are at the ceiling of the daily timeframe channel
2. Accurate harmonic ratios
3. Price action pattern
4 MACD divergence
5 RSI divergence
Resistance level 5.7
Finally, thank you for supporting me by liking, sharing and commenting

SOLANA Sell/Short Setup (2H)A bearish pattern has formed on the chart, and it appears that the first wave of wave E has been completed, which was symmetrical. In the second wave of E, we are looking to enter a Sell/Short position to capture the third bearish wave of wave E.
The stop loss, targets, and entry point have been marked on the chart.
Please note that this is a swing setup and will take some time to reach the target.
Add this setup to your watchlist | we’ll enter if it reaches the entry zone.
For risk management, please don't forget stop loss and capital management
When we reach the first target, save some profit and then change the stop to entry
Comment if you have any questions
Thank You

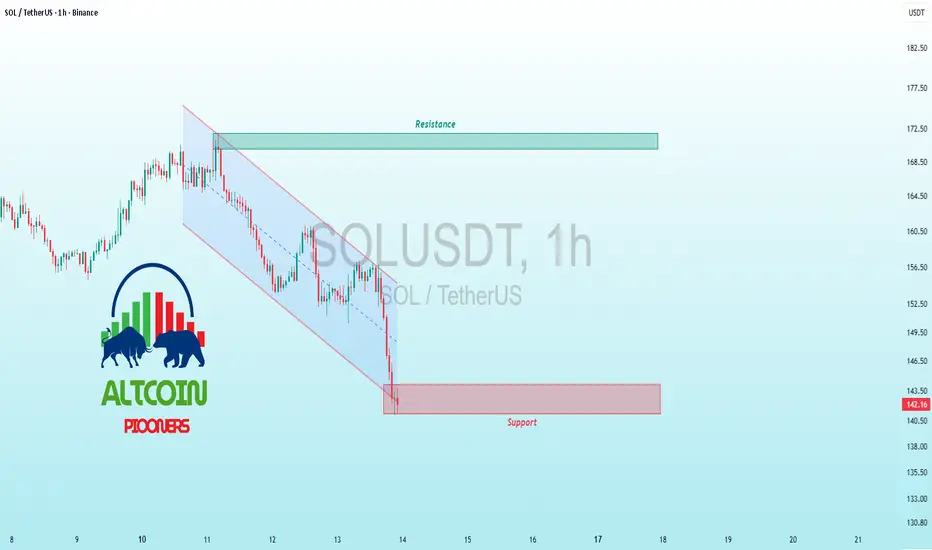
$SOL Channel Test – Bulls Defend or Bears Dominate?BINANCE:SOLUSDT CRYPTOCAP:SOL Channel Test – Bulls Defend or Bears Dominate?
Current trend: SOL's hugging the descending channel lower boundary, dipping to 143.5 support after rejection from 182 highs—classic pressure cooker with thinning red volume signaling possible relief 🛡️.
Hold support? Strong potential yes; hammer candles and prior confluence zone could draw buyers for a squeeze play.
Breakout above resistance? On horizon if 182 flips—igniting 7-10% rally to channel top 🚀.
Dip risk? Moderate to 140 on break, but oversold prevents panic flush.
Target: Upside 160 short-term; downside 138 buffer.
Indicators tracking: RSI (30, oversold bounce), Channel slope, and OBV divergence 📊.
#SOLTrading #CryptoChannel #AltcoinPioneers
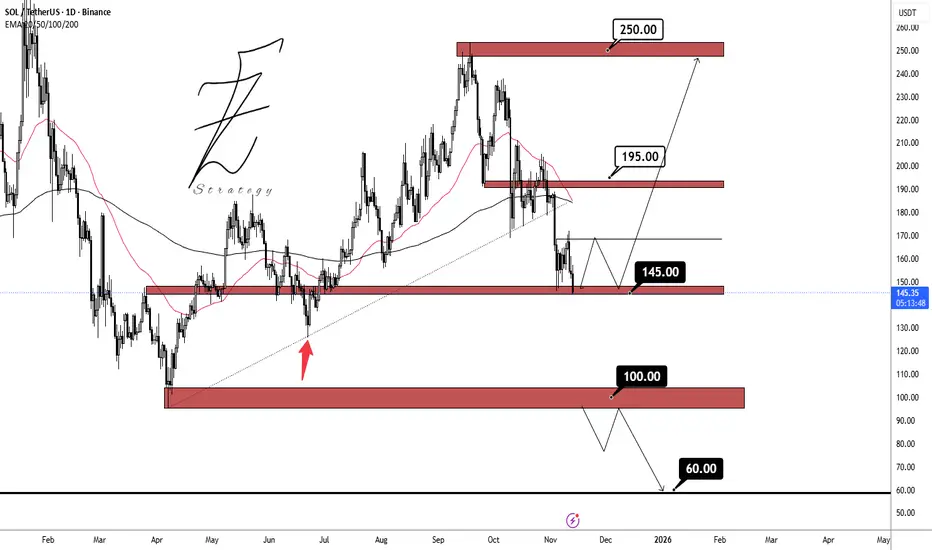
SOLUSDTLast week, the price BINANCE:SOLUSDT showed a positive reaction around the 145.00 dollar support zone, and with weakening bearish momentum, the likelihood of holding above this level has increased. If this support remains intact, the next target will be the 195.00 dollar resistance area.
Support zones: 145.00 dollar, 100.00 dollar, 60.00 dollar
Resistance zones: 195.00 dollar, 250.00 dollar
SOL/USDT: Compression Builds Above $150 as Bulls Eye BreakoutSOL/USDT is testing the lower boundary of structure after repeated failures to break the descending trendline. Price is compressing just above the $150 psychological support, suggesting possible accumulation at this level.
A break above $160 and the trendline could trigger a recovery toward $175 resistance. Momentum favors a bullish bias as long as $150 holds.
❗️ Risks:
– Rejection at $160 may lead to a retest of $147.
– BTC weakness could stall upside.
– Stronger USD or risk-off flows may delay breakout.

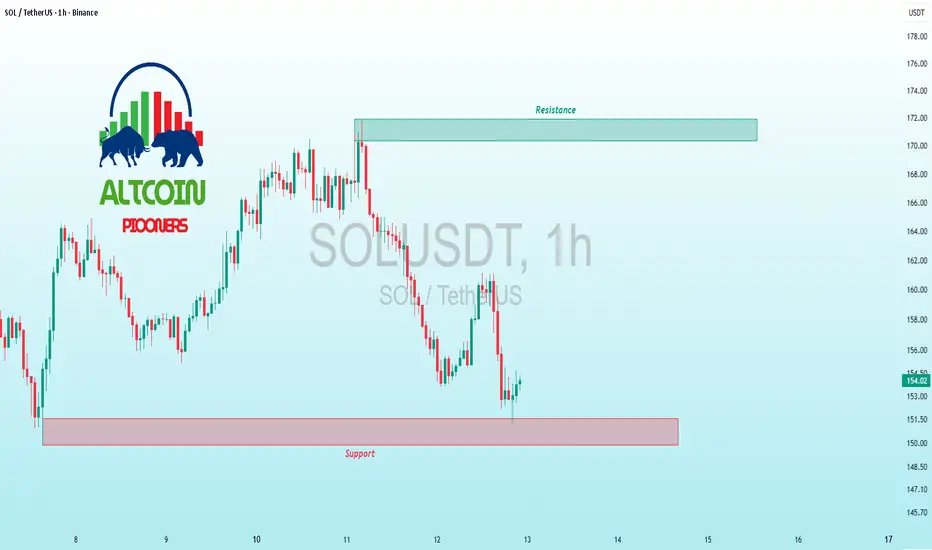
$SOL Support Fortress – Breakout Brewing?BINANCE:SOLUSDT CRYPTOCAP:SOL Support Fortress – Breakout Brewing?
Current trend: SOL's in a resilient base after volatility spike, clinging to 151.5 support amid broader alt weakness—bullish hammers forming, hinting at accumulation phase 🛡️.
Hold support? Very likely; volume clusters below and RSI bounce from 30 scream buyer control.
Breakout above resistance? Eyes on 178 clear for momentum shift—could trigger 8-10% rally if BTC cooperates 🚀.
Dip risk? Capped at 148 if rejection lingers, but low downside conviction.
Target: Initial 180 on flip; extended 190 with conviction.
Indicators tracking: RSI for reversal pops, Volume delta on greens, and Fibonacci 61.8% retrace 📊.
#SOLTrading #AltcoinBase #CryptoRebound
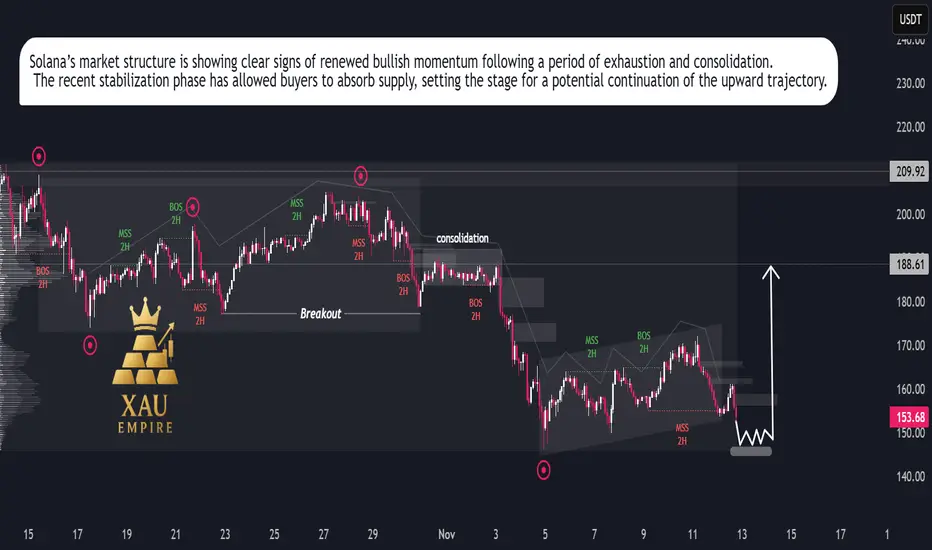
SOL/USDT – Bullish Momentum Rising, Rally Setup in ProgressSolana is showing renewed strength after an extended corrective phase, suggesting that the recent slowdown was a temporary reaccumulation rather than the start of a new downtrend. Price action has begun to stabilize, reflecting growing investor confidence and increasing participation from buyers at discounted levels.
Market flow indicates that selling pressure is fading, while buying volume has started to build up gradually. The recent structure reflects a healthy market rotation, where weaker hands are being replaced by strategic buyers positioning for the next expansion phase.
Momentum appears to be shifting in favor of the bulls, supported by consistent higher reactions after each dip and a clear compression pattern that often precedes strong directional movement. This behavior points toward a potential continuation of the broader uptrend, with expectations for renewed growth as market sentiment strengthens.
Overall, Solana’s current price behavior suggests the market is preparing for another bullish leg. As volatility contracts, the probability of an impulsive upside expansion increases, signaling that the next significant move is likely to unfold in favor of buyers.
#SOL/USDT Bullish trend analysis Read The caption#SOL
The price is moving within an ascending channel on the 1-hour timeframe and is adhering to it well. It is poised to break out strongly and retest the channel.
We have a downtrend line on the RSI indicator that is about to break and retest, which supports the upward move.
There is a key support zone in green at the 154 price, representing a strong support point.
We have a trend to stabilize above the 100-period moving average.
Entry price: 156
First target: 156.80
Second target: 158
Third target: 160
Don't forget a simple money management rule:
Place your stop-loss order below the green support zone.
Once the first target is reached, save some money and then change your stop-loss order to an entry order.
For any questions, please leave a comment.
Thank you.

Solana Battle at 150!Hello, is everyone watching Solana (SOLUSDT) fight?
Currently, SOLUSDT is still under downward pressure after breaking the old support zone (new resistance) and the price continues to be rejected at the main trendline resistance.
The 150-160 zone is acting as an important reaction zone, a short technical recovery may appear before continuing to decrease when it cannot hold this zone.
On the other hand, the market shows signs of altcoin cash flow weakening slightly when BTC is regaining its capitalization advantage.
In addition, the liquidity of the crypto market at the beginning of the week has not clearly recovered, making SOL's recovery difficult to sustain.
In my personal opinion, when breaking through the current support zone, the possibility of going down to the 130-140 zone is quite high.
What do you think, is this zone worth observing for short-term shorts? Or should we wait for a clearer signal in the small frame?
Share your views in the comments below!

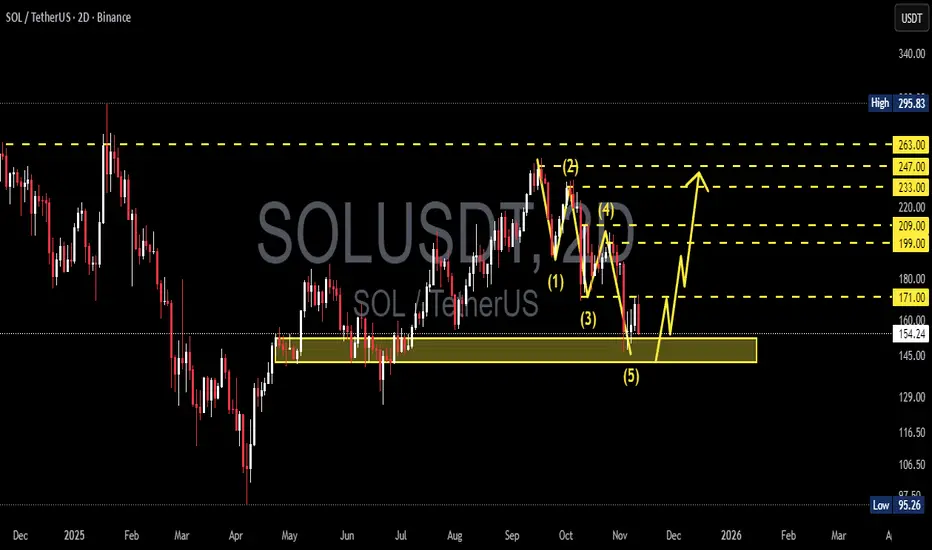
SOL/USDT — Will Solana Start a Major Reversal from Here?Solana (SOL/USDT) is now sitting at a critical turning point, as the market tests a major historical demand zone between 152–142 USDT. After completing a clear 5-wave impulsive decline, sellers appear to be losing momentum, while buyers are starting to react around this key area.
This yellow zone has previously acted as a strong demand base, triggering powerful rallies in the past. Now, it’s once again becoming the battlefield between bulls and bears — and the outcome could define Solana’s direction for the coming months.
---
Pattern & Structure
1. 5-Wave Decline (Elliott Wave Structure):
The chart shows a clean 5-wave downward pattern, often marking the end of a corrective phase. If valid, the next move could be an ABC corrective rally, signaling the start of a broader bullish reversal.
2. Critical Demand Zone (152–142):
This area serves as a strong institutional accumulation zone, where smart money often steps in. A confirmed rebound from here could ignite the next leg higher.
3. Layered Resistance Levels:
Key resistance levels are lined up at
171 → 199 → 209 → 233 → 247 → 263.
Each breakout acts as a step confirming a stronger bullish trend.
4. Fibonacci Confluence:
The 38–61% retracement levels align with 199–263, strengthening the case for this region as a natural recovery target zone in the next upward phase.
---
Bullish Scenario — “The Reversal Zone Awakens”
If price holds above 152 and forms a strong bullish reversal candle (engulfing / hammer on the 2D chart), we could see:
Target 1: 171 → first confirmation of trend reversal.
Target 2: 199–209 → mid-level recovery zone.
Target 3: 233–247 → full corrective phase.
Extended Target: 263 → upper resistance and profit-taking zone.
This scenario represents the potential end of a multi-month bearish phase and the beginning of a fresh bullish cycle.
A 2D close above 171 would strongly confirm the reversal structure.
Additional confirmation: bullish divergence on RSI, increasing buy volume, or formation of higher lows on the 2D timeframe.
---
Bearish Scenario — “Breaking the Floor”
If the price closes below 142, the current demand zone will flip into resistance, signaling continuation of the downtrend toward:
First target: around 116 (minor demand).
Main target: 95 (previous historical low).
A breakdown below 142 would suggest that wave (5) may not yet be complete, indicating one final capitulation wave before a potential long-term bottom forms.
---
Strategy & Outlook
Conservative traders: Wait for a confirmed 2D close above 171 before entering any bullish setups.
Aggressive traders: Consider gradual accumulation near 152–142 with tight SL below 142.
Risk management: Maintain a minimum R:R of 1:2, and avoid averaging down blindly without confirmation.
Multi-timeframe confirmation: Watch daily and 3D candles for stronger conviction signals.
---
Market Psychology
This current phase represents a “capitulation zone” — where retail confidence fades while smart money starts positioning quietly.
Historically, major trend reversals are born from such exhaustion zones. If SOL can defend this support area, it could be the beginning of a powerful new uptrend toward 200+ and beyond.
---
Conclusion
Zone 152–142 = critical buyer defense line.
Reaction in this zone will determine the next macro trend for Q4 2025 – Q1 2026.
Breakdown → downside target 95.
Reversal → upside potential up to 263.
---
#Solana #SOLUSDT #CryptoAnalysis #TechnicalAnalysis #SupportResistance #ElliottWave #CryptoReversal #SwingTrade #PriceAction #AltcoinSeason #SolanaAnalysis
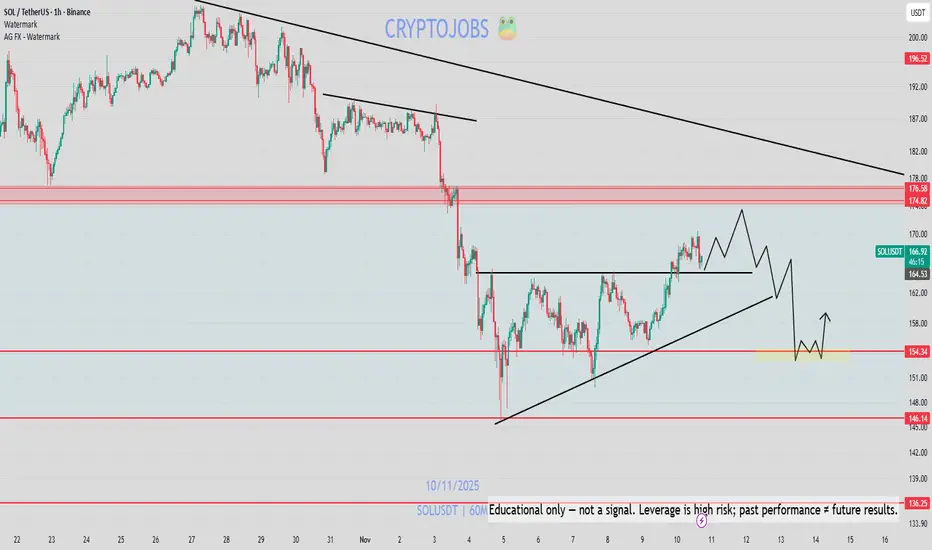
SOLUSDT – When Buyers Start to Lose MomentumAfter an exciting short-term rally, Solana is beginning to show signs of losing steam , as buying pressure weakens around the $167–$170 zone — an area aligning with the long-term descending trendline .
The technical picture is tilting slightly in favor of the bears: price has been repeatedly rejected near $170, forming a pattern of lower highs, while trading volume continues to decline. This indicates that buyers no longer have enough strength to break through the current downtrend structure.
If this scenario persists, Solana could pull back toward the $153 support zone, where buying activity previously emerged. Holding above this level will be crucial in determining whether the market can consolidate again or extend its decline further.
Overall, the short-term bearish trend remains dominant. Unless a strong catalyst or fresh liquidity enters the market, Solana may continue to drift lower within the current descending channel — a necessary “step back” before the next potential bullish phase begins.

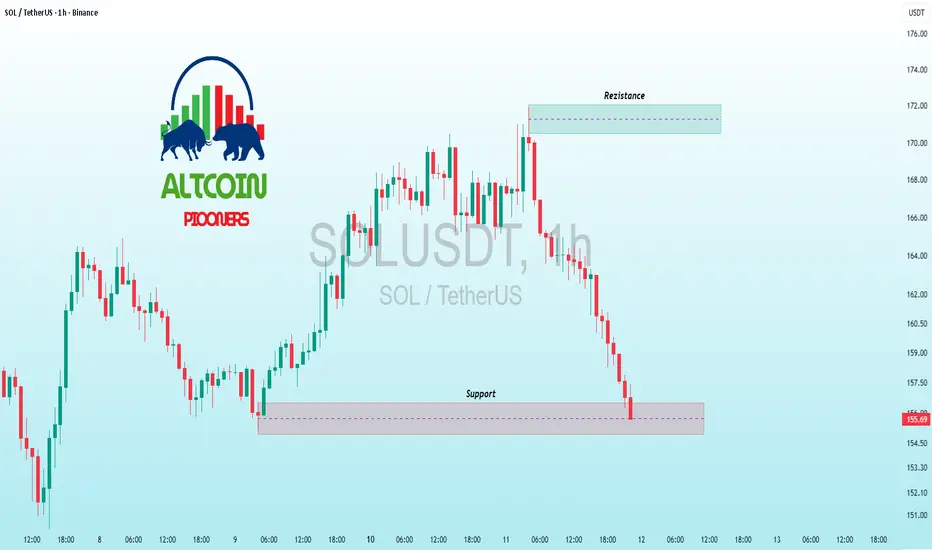
$SOL Rebound from Support, Breakout Potential?BINANCE:SOLUSDT CRYPTOCAP:SOL Rebound from Support, Breakout Potential? 📊🌊
SOL's 1H trend turns bullish, snapping back from core support at ~155 with increasing volume—buyers defending hard!
High odds of holding, pushing for breakout above 170 resistance toward 185 target.
Deeper dip unlikely (watch 150), but secure stops.
Monitoring RSI at ~53 (rising), 50 EMA bounce, and MACD flip positive.
Solana surge incoming! 🚀
#SOL #CryptoTrading #AltcoinBull
#SOL/USDT is going to breakout from descending channel 18% gain#SOL
The price is moving within an ascending channel on the 1-hour timeframe and is adhering to it well. It is poised to break out strongly and retest the channel.
We have a downtrend line on the RSI indicator that is about to break and retest, which supports the upward move.
There is a key support zone in green at the 162 price, representing a strong support point.
We have a trend to stabilize above the 100-period moving average.
Entry price: 164
First target: 166
Second target: 168
Third target: 171
Don't forget a simple money management rule:
Place your stop-loss order below the green support zone.
Once the first target is reached, save some money and then change your stop-loss order to an entry order.
For any questions, please leave a comment.
Thank you.

$SOL Bull Run Testing Resistance?BINANCE:SOLUSDT CRYPTOCAP:SOL Bull Run Testing Resistance?
SOL's 1H chart roaring bullish, surging to 166.87 highs and eyeing resistance at 170—breakout could target 175 quick, but pullback to support 155 risks if momentum stalls.
Strong uptrend vibes!
Key indicators: RSI overbought at 70 (watch divergence), 50MA rising, volume spiking. 🌊🚀
#SOL #Solana #AltcoinPioneers

SOL - UPDATE: CRYPTOCAP:SOL - update: 🟥
Remember, I posted this view few days ago.
Prices retested exactly the previous breakout (key support) around 170 - 175$.
If this level act as resistance, we could see another dump & lower low! 📉
Prices could move sideway for a while, but:
My initial outlook called for the 130$ level as bottom.
Judging by my weekly & daily view, For now this setup is valid under key resistances.
Daily = Bearish
Weekly = Neutral
At the opposite:
155$ must hold on daily basis to expect a downtrend reversal & breakout📈.
A downtrend breakout would surely lead to a push toward 180$ or even 200$+ 🟩
More infos & data in my charts! #dyor - H1 possible setup
SOLUSDT Breaks Out and Aims for $200!BINANCE:SOLUSDT is trading above the 50 EMA on the 4H chart. a strong sign for short-term momentum. If you look closely, it has also broken out of an ascending triangle pattern and is moving upward with solid volume.
We’re expecting a potential upmove from here, with a short-term target around $200.
Always remember to set your stop loss and manage your risk wisely.
BINANCE:SOLUSDT Currently trading at $167
Buy level : Above $165
Stop loss : Below $154
Target 1: 175
Target 2: 200
Max leverage 3x
Always keep stop loss
Follow Our Tradingview Account for More Technical Analysis Updates, | Like, Share and Comment Your thoughts

#SOL/USDT — Critical Retest at Demand Zone vs Long-Term Downtr#SOL
The price is moving within an ascending channel on the 1-hour timeframe and is adhering to it well. It is poised to break out strongly and retest the channel.
We have a downtrend line on the RSI indicator that is about to break and retest, which supports the upward move.
There is a key support zone in green at the 158 price, representing a strong support point.
We have a trend to stabilize above the 100-period moving average.
Entry price: 159
First target: 161
Second target: 164
Third target: 168
Don't forget a simple money management tip:
Place your stop-loss order below the green support zone.
Once you reach the first target, save some money and then change your stop-loss order to an entry order.
For any questions, please leave a comment.
Thank you.

SOL is going to breakout from descending channel 18% gain,to198$Hi the support and resistances on the chart are based on the previous data and weekly candlesticks if BINANCE:SOLUSDT holds this last support the potential of 18% gain is logical toward 198$
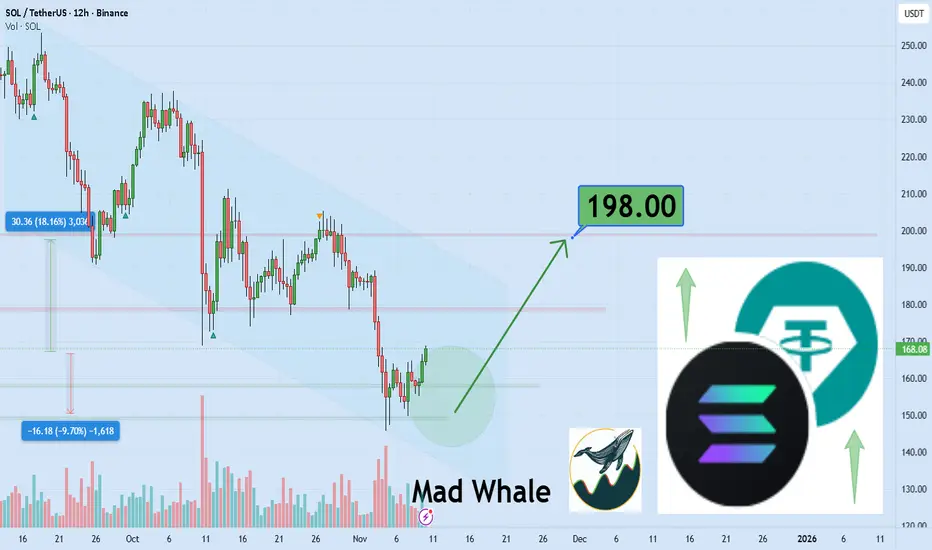
Important range: 161.79-163.73
Hello, traders!
Follow us to get the latest information quickly.
Have a great day!
-------------------------------------
(SOLUSDT 1D chart)
The HA-Low indicator, the DOM(-60) indicator, and the M-Signal indicator are forming around 161.79-163.73.
Therefore, the key is whether the price can break above the 161.79-163.73 level.
To continue the uptrend by breaking above this key point or level, the StochRSI, TC (Trend Check), and OBV indicators must show upward trends.
- The StochRSI indicator should not have entered the overbought zone.
- The TC (Trend Check) indicator should remain above zero.
- The OBV indicator should remain above the High Line.
Currently, the OBV indicator is near the Low Line, and is in a reversed state with OBV < EMA 2 and EMA 1.
Therefore, if the price breaks above the 161.79-163.73 level, we need to watch for a reversal where OBV > EMA2 and EMA1.
The StochRSI indicator appears to be rising from the oversold zone, and appears to have shifted to a K > D state.
The TC (Trend Check) indicator is trending upward, but since it's below the 0 level, we can see that selling pressure still dominates.
Therefore, if the TC indicator breaks above the 161.79-163.73 level, we should also check to see if it can rise above the 0 level.
If it fails to rise above the 161.79-163.73 level, we should check for support around 126.36.
Since the HA-Low indicator has been created, even if it shows a stepwise downward trend, it is expected to eventually turn upward.
Therefore, we should focus on finding the right time to buy.
-
Thank you for reading to the end.
I wish you successful trading.
--------------------------------------------------
