SOL is going to breakout from descending channel 18% gain,to198$Hi the support and resistances on the chart are based on the previous data and weekly candlesticks if BINANCE:SOLUSDT holds this last support the potential of 18% gain is logical toward 198$
Solusdt
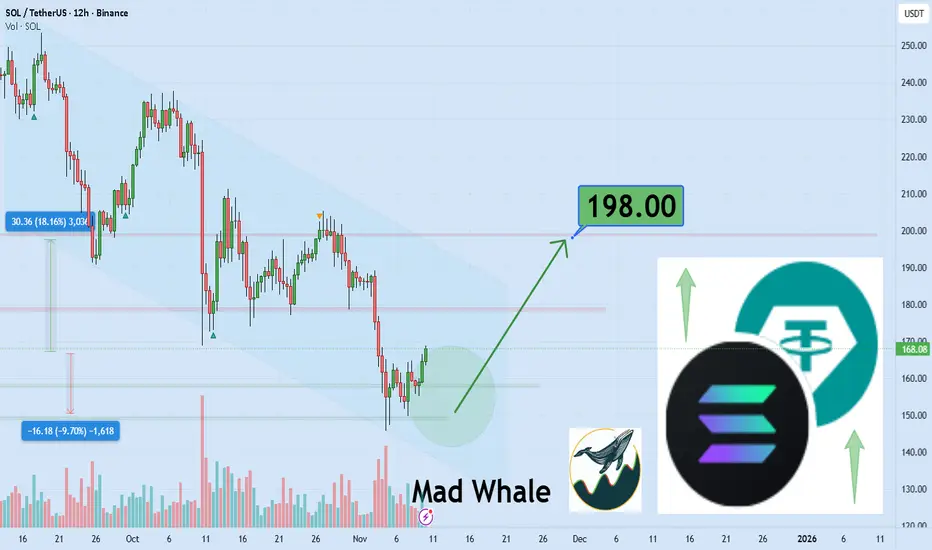
Important range: 161.79-163.73
Hello, traders!
Follow us to get the latest information quickly.
Have a great day!
-------------------------------------
(SOLUSDT 1D chart)
The HA-Low indicator, the DOM(-60) indicator, and the M-Signal indicator are forming around 161.79-163.73.
Therefore, the key is whether the price can break above the 161.79-163.73 level.
To continue the uptrend by breaking above this key point or level, the StochRSI, TC (Trend Check), and OBV indicators must show upward trends.
- The StochRSI indicator should not have entered the overbought zone.
- The TC (Trend Check) indicator should remain above zero.
- The OBV indicator should remain above the High Line.
Currently, the OBV indicator is near the Low Line, and is in a reversed state with OBV < EMA 2 and EMA 1.
Therefore, if the price breaks above the 161.79-163.73 level, we need to watch for a reversal where OBV > EMA2 and EMA1.
The StochRSI indicator appears to be rising from the oversold zone, and appears to have shifted to a K > D state.
The TC (Trend Check) indicator is trending upward, but since it's below the 0 level, we can see that selling pressure still dominates.
Therefore, if the TC indicator breaks above the 161.79-163.73 level, we should also check to see if it can rise above the 0 level.
If it fails to rise above the 161.79-163.73 level, we should check for support around 126.36.
Since the HA-Low indicator has been created, even if it shows a stepwise downward trend, it is expected to eventually turn upward.
Therefore, we should focus on finding the right time to buy.
-
Thank you for reading to the end.
I wish you successful trading.
--------------------------------------------------

SOL Short SOL Short 📉
In the medium term, I am bearish.
Rebalancing the bearish inefficiency (POI) is likely to lead to continued aggressive markdowns, which can be used to open a short position.

SOL aint looking that goodYes, the market structure isn't really broken and it hasn't lost any major support
Yes, it can go higher, a lot higher,
and yes it's been one of the best performers of this cycle .
Which makes it rather risky to short it. But it doesn't change the fact that it:
- Failed to beat critical levels
- By being one of the best performers, retail is loving it.
- Everyone is too comfy in longs.
The level i had for SOL back in last year happened to be the exact bottom, so I'm being cautious here.

Long SolanaTrading Fam,
Received a buy signal from my indicator on Solana the other day. Inside a nice liquidity block, above the 200/350 SMA, and inside a bullish triangle. I'll easily take this trade all day. But with the crypto market continually disappointing, I am not going to risk more than an 8% loss here. Shooting for a target of around 32% profits brings my rrr to a 1:4. Best of luck!
✌️Stew

SOLANA’S SWING — BEARS TAKE WINGHey guys! How was your trading week? Hope you made some great profits!
Solana has completed only half the way to my target at 167 and then reversed — and now I don’t see any signs of continuation to the upside.
In my previous Solana post, I mentioned that my next downside targets are 144 and then 124.
I believe we’ve just finished the correction and are heading toward 144 — at least, that’s what all the signs on the chart are showing me right now.
However, first I expect a dip to 147, as there might be a short-term bounce before further decline.
🎯 Targets:
1️⃣ 147
2️⃣ 144
3️⃣ 124
❌ Invalidation: 158.53
📈 Follow me to stay updated on Solana’s next moves and other crypto setups — don’t miss my updates!
⚠️ Disclaimer:
This is not financial advice. I share my personal market view for educational purposes only. Always do your own research before making trading decisions.

Solana’s pause after the causeHi friends!
How are you doing after the recent Bitcoin–Solana drop?
I hope you didn’t lose anything — and maybe even managed to make some profit instead! 💪
📉 My next targets on the downside are around $144 and $124, but at the moment, Solana seems to be taking a breather from the fall.
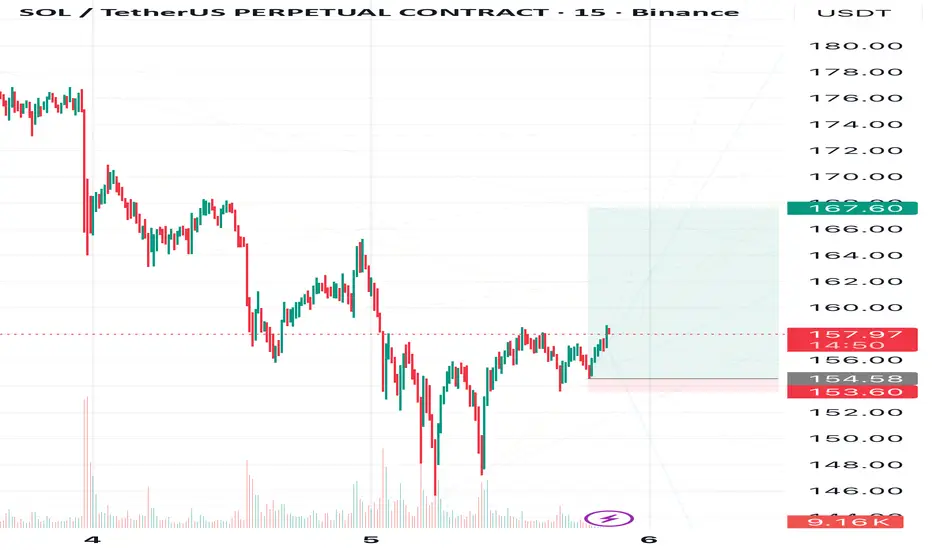
After a long and deep decline, even below my earlier expectations, Solana is finally showing some signs of a small correction to 167,60 📈
🎯Target - 167,60
❌Invalidation zone are marked on the chart - 153,60
💬 What do you think — is this the start of a reversal, or just a short pause before another move down? Share your thoughts in the comments. I always enjoy reading your views!
🔔 Follow me to stay updated on Solana and other crypto market analyses.
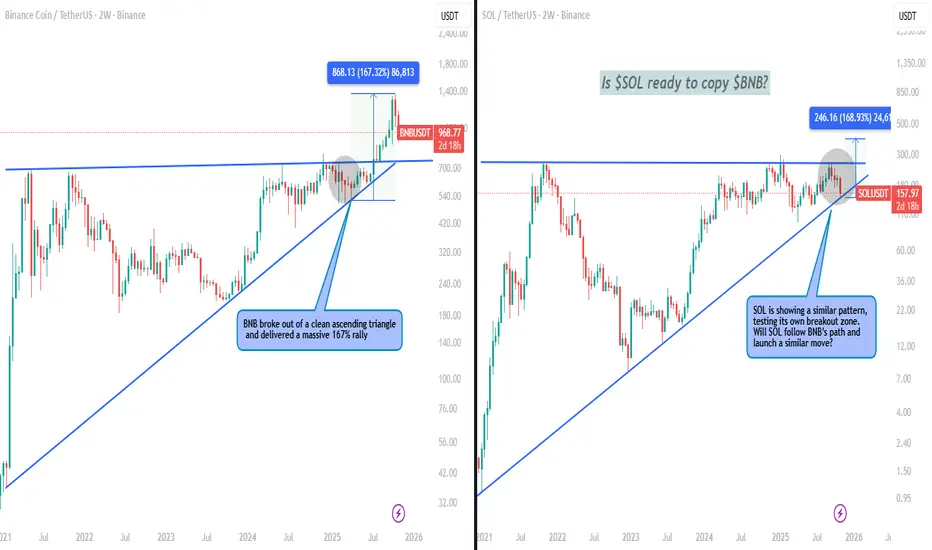
$SOL vs $BNB – History repeating?CRYPTOCAP:BNB broke out of a clean ascending triangle and delivered a massive 167% rally. Right now, CRYPTOCAP:SOL is showing a similar pattern, testing its own breakout zone.
Will SOL follow BNB’s path and launch a similar move? A structure like this could set the stage for a big run if support holds. Share your views—is CRYPTOCAP:SOL ready for its breakout moment?
Solana, more down side to see? SOLUSDT / 1D
Hello Traders, welcome back to another market breakdown.
SOLANA is currently trading within a down trend, maintaining a bearish structure. I'll be looking for a short pull-back higher to get a position.
If the pullback holds and sell mode confirms, the next leg higher could target new lows.
Stay disciplined, wait for the market to come to you, and trade with confidence!
Trade safely,
Trader Leo.

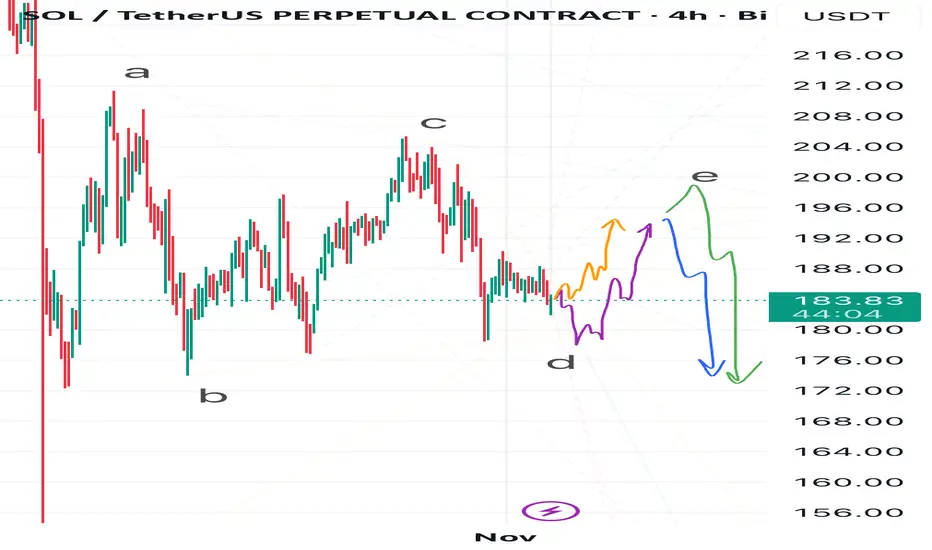
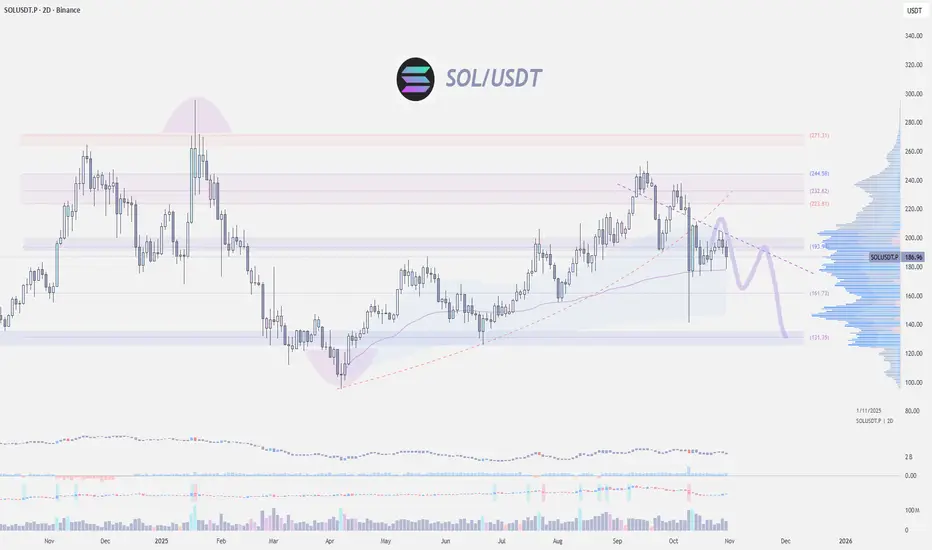
Solana Swing — D or E in the Ring?I see several possible scenarios for Solana at the moment.
In my view, either wave D of the corrective ABCDE triangle has already formed, and the price will follow the orange path, starting to build wave E —
or wave D isn’t complete yet, and Solana might still drop toward 178 or even lower, following the purple path, before beginning wave E.
As for wave E, I also see two possible outcomes:
• The green path, where wave E extends up to around 200,
• Or the blue path, where wave E ends near 194–196, followed by a downside breakout from the triangle, sending Solana toward ~170 or even lower.
💬 Which scenario do you find more likely? Share your thoughts in the comments!
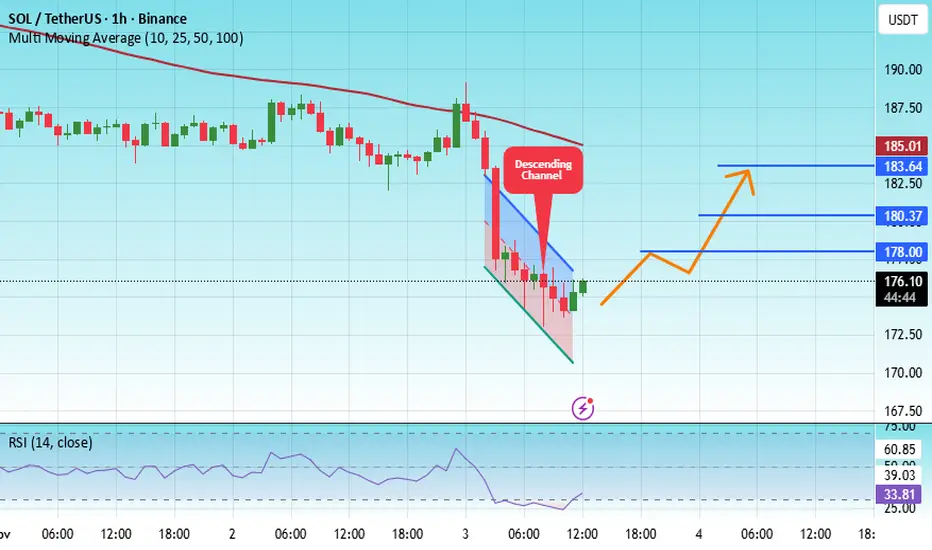
#SOL/USDT The Next Explosion, Hidden Clues in Price Behavior
#SOL
The price is moving within an ascending channel on the 1-hour timeframe and is adhering to it well. It is poised to break out strongly and retest the channel.
We have a downtrend line on the RSI indicator that is about to break and retest, which supports the upward move.
There is a key support zone in green at 172.80, representing a strong support point.
We have a trend to stabilize above the 100-period moving average.
Entry price: 175.50
First target: 178
Second target: 180
Third target: 183
Don't forget a simple money management rule:
Place your stop-loss order below the support zone in green.
Once the first target is reached, save some money and then change your stop-loss order to an entry order.
For any questions, please leave a comment.
Thank you.
Solana — Triangle Tale Before the Pale As you might remember from my previous publications, I’m expecting Solana to decline toward 164 and possibly even lower.
At the moment, I’d like to see it around 178, and depending on how the move toward this level develops, I’ll decide on my next steps — which you’ll see in my upcoming updates.
I have a thought that after reaching 178, Solana might move upward first, forming a corrective triangle, and only later drop to 164 or even below.
The invalidation zone for the current plan is marked in red on the chart.
📉 Follow me so you don’t miss my next analyses and scenario updates

SOLANA Pullback - DailyThis crypto coin has been bearish on the past few days, but it seems as it is a slight pullback towards the demand zone at 160 and 130, before it shoots upwards.
Let us wait and see if we can have a selling opportunities, aiming towards those zones.

Solana Price Action Turns BearishSolana’s market structure shows a gradual weakening of bullish momentum after an extended upward phase earlier in the month. The asset experienced a breakout that temporarily fueled optimism among traders, but recent sessions indicate a loss of strength as sellers began to dominate. The volume profile suggests that market participants are shifting focus from accumulation to potential distribution, reflecting caution ahead of broader market developments.
Price movements over the past few weeks show that Solana has transitioned from impulsive bullish waves into a corrective environment. This phase reflects uncertainty and potential repositioning by large holders. The consolidation seen mid-cycle indicates a period of balance before a directional move resumes. Current activity implies that short-term liquidity adjustments are occurring, and volatility may expand in the coming sessions.
Market sentiment remains sensitive, with investor confidence depending largely on macroeconomic flows and digital asset liquidity trends. Solana’s performance continues to mirror broader crypto risk appetite, where speculative behavior is being tempered by cautious profit-taking. If momentum continues to decline, extended corrective movement could unfold as participants await new catalysts.
Overall, the report indicates that Solana is entering a controlled phase of distribution where institutional participants may be preparing for another medium-term adjustment in valuation.

SOL/USDT: Bearish Channel Holds as Price Faces Mid-Range ResistSOL/USDT is consolidating inside a downward channel, with a clear sequence of lower highs and impulse legs defining the structure. Price is currently hovering near mid-range resistance, showing hesitation below the descending trendline.
A rejection at this level could lead to a move back toward the $169 support, completing the projected downside leg. The broader tone remains bearish while channel boundaries continue to guide and limit momentum.

Solana at a Make-or-Break LevelSolana couldn’t sustain momentum above $200 and now holding the critical level $170.
CRYPTOCAP:SOL is sitting at a make-or-break level — failure to reclaim the $200 zone or a clean break below $170 would be a concerning signal for bulls.
A decisive breakdown below this area could trigger a deeper retracement toward $150, with the worst-case scenario being a full retest of the $130 range — aligning with the previous demand zone and high-volume node.
PENGUUSDT : BUY LIMITHello friends
Given the good growth we had and the entry of buyers, now that the price is correcting, there is a good opportunity to buy with risk and capital management and in steps at the specified supports and move with it to the specified targets.
*Trade safely with us*

$SOL Solana is sandwiched between the nearly 4-year resistance level of 2021's ATH and the approaching 3-year uptrend.
A squeeze lasting this long typically ends not with a minor breakout but with a major blowout.

Solana is still within range... SOL just got some bullish news with a Western Union relationship. Could this be a catalyst that will allow the PA to exit the range? The current upward channel has been respected on the D1, although the trend has been our friend; trendline liquidity has been building. Regardless, the SOL price is at an important POI.

SOLUSDTI think have this chart of BINANCE:SOLUSDT buy because breakout trendline and i see order-block in 194$. Target is end measured move (2-Leg) from low latest swing in 208$.
Please control your risk in any position.

SOLUSDT – Bullish Trend Supported by Technical Structure and NewAfter a brief correction, SOLUSDT is showing strong signs of a continued upward movement. The ascending triangle pattern on the H4 chart indicates that SOL is building a solid base, with higher lows and testing the resistance at 200.00 USD. The price is currently above the EMA34, signaling strong buying momentum.
Notably, the price has recently broken through the important 200.00 USD resistance and is now approaching 216.00 USD. If SOL continues to hold above the 200 USD mark and confirms further upward movement, the next target would be 216 USD.
With positive news surrounding Solana and increased investment interest, SOL is likely to maintain its bullish momentum in the short term.
Strategy: Buy around 200.00 USD, target 216.00 USD, stop loss below 195.00 USD.
Summary: The short-term bullish trend remains strong, and SOLUSDT may reach the 216 USD target if it holds above the 200 USD support level.

Solana Still ChillsSolana continues its correction phase. I am expecting a move toward 190 now
The invalidation zone for this scenario is marked on the chart

SOLANA - SHORT - THE WICK AND THE WHISPERTraders,
This is how I see SOL.
1. The level I care about
For me the key area is 205 to 207. Call it VAH, call it range high, call it supply. It is the place where price got stuffed before and where a lot of trapped memory lives.
What I expect is simple.
Wick it. Slip it. Fade it.
In other words I am looking for SOL to run into that 205 to 207 pocket, spike through it, clean the liquidity resting above those highs, and then fail to hold. That failure after the wick is the trigger for me. That is where I want to be heavy.
If SOL trades above that range high and then instantly falls back inside, that is a swing fail pattern at the high of the range. That is the same story I am hunting on BTC at 117.5k. Liquidity first, conviction second.
2. The downside path
If the wick and slip happens, my downside path is not small. My next meaningful target sits all the way down at 150 to 155. That zone is not just a guess.
It is where the last real demand block sat before we impulsed higher.
It is also where liquidity was never fully re balanced after the violent breakout.
Call it unfinished business. Call it imbalance that still needs to close.
The market eventually comes back to drink from the well it skipped.
3. Now we look under the hood
Price has pushed up into 200 again, yes. But the flow behind the move tells a different story than the candles.
Spot CVD
Spot CVD is bleeding down hard. Real buyers paying cash are not supporting this move. Spot is distributing into strength, not accumulating under it.
Stablecoin margined CVD
Stablecoin perp flow is also down. That means most of the USDT perp side is either taking profit into this move or outright selling into it. They are not chasing it. They are leaning against it.
Coin margined CVD
This is the biggest one. Coin margined CVD is aggressively down. That tells me coin collateral traders are smashing into the bid, basically leaning short into this push.
So ask yourself. If spot is selling, and perp flow is selling, and coin margined flow is selling, then why is SOL still pressing up
4. Open Interest is the answer
Stablecoin OI is grinding up.
Coin margined OI is going vertical.
That means positions are being added at the top, not closed. New size is entering into this level.
When coin margined OI spikes like that while coin margined CVD is negative, the usual read is this. People are opening fresh short exposure using SOL itself as collateral, hitting the bid all the way up, and still not getting the breakdown.
They are trying to fade the move. The move refuses to die. That is short fuel.
This is why SOL can still squeeze into 205 to 207. Shorts are stepping in early, and if you squeeze them one more time you get the wick.
But here is the catch. After the wick and slip, once that last round of shorts is blown and once fresh late longs FOMO in above VAH, there is nothing under price.
Spot buyers did not build a floor.
Perps did not build a floor.
The whole thing is hollow.
That is how you get air pockets.
5. How I am trading this
I am not here to wave a bull flag or scream bear. I am not interested in labels.
I am here to execute around the level.
My plan is to stalk shorts on a failed breakout of that 205 to 207 key. I do not need to nail the exact top tick. I want to see the wick into VAH, and then the rejection back inside the range. That is my trigger to build size.
Will I hold it all the way to 150 No blind loyalty. But that is where I believe the next true re balance sits, and that is the map I am working with.
If SOL breaks through 207, accepts above, and starts building structure above VAH, then this idea is invalid. I step aside. No ego. Survival first.
6. Summary
SOL is approaching a thin ceiling where liquidity sits. I believe we get a final run of that high near 205 to 207, a wick and slip, and then rotation lower. The flow supports that view.
Spot is not bidding.
Perps are selling into the move.
Open Interest is exploding at the highs.
That is the recipe for a squeeze candle into resistance, followed by a rug.
My destination if this plays out is 150 to 155, the next pool of imbalance where the market still owes a visit.
The chart is loud, but the flow is louder.
The candles brag.
The data whispers.
I listen to the whisper.
