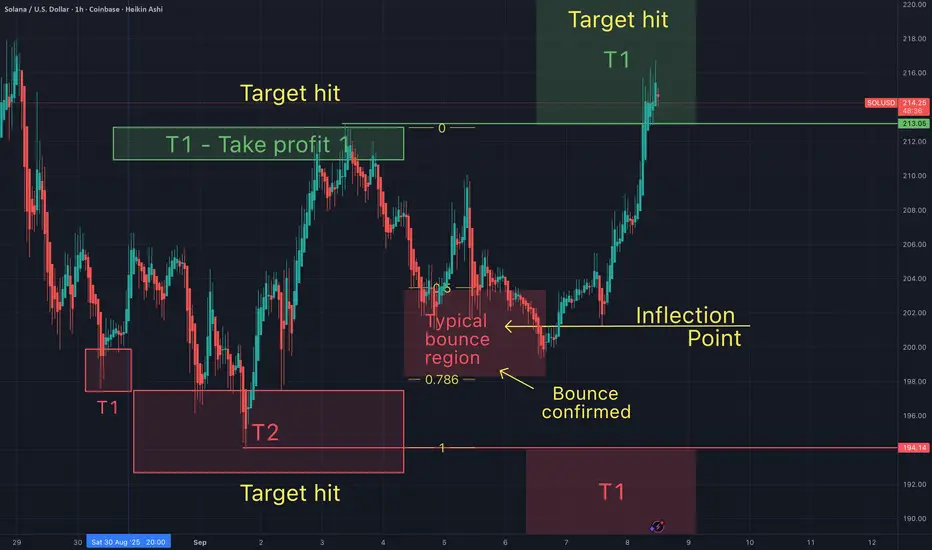
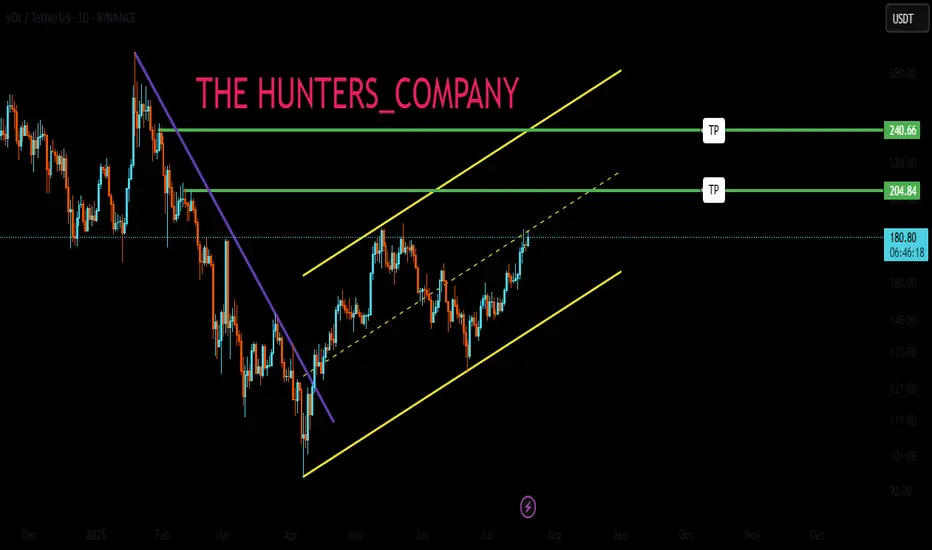
You will ask yourself how did he know Sol would bounce & hit T1?In my previous chart I suggested that Sol was approaching an inflection point, in a typical bounce region. That anticipated bounce would lead Sol to climb up to T1 above the preivous local high. That has now been confirmed.
What do you think Sol will do from here? I 'd ike to here your thoughts?
Solusdtshort
#SOL/USDT → Stronger than the market. Correction before growth#SOL
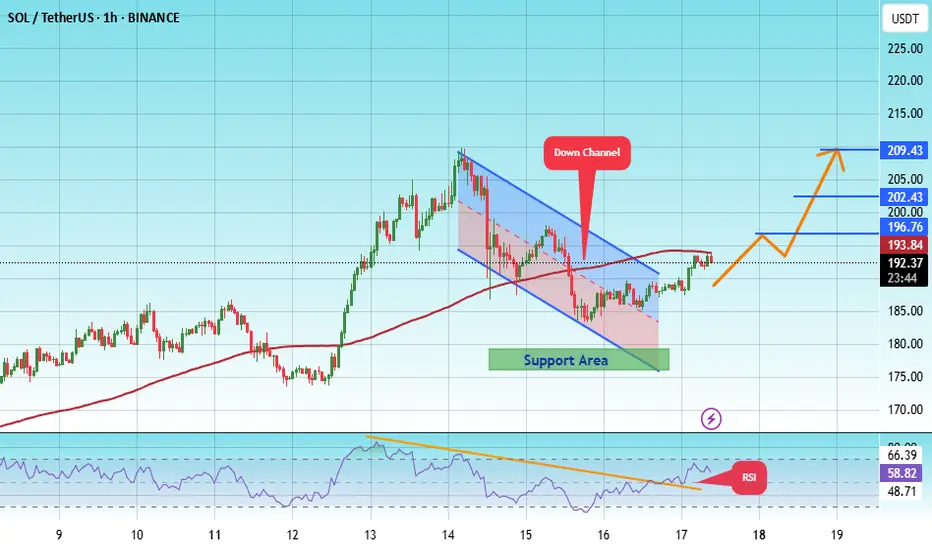
The price is moving within a descending channel on the 1-hour frame and is expected to break and continue upward.
We have a trend to stabilize above the 100 moving average again.
We have a downtrend on the RSI indicator that supports the upward move with a breakout.
We have a support area at the lower boundary of the channel at 207, acting as strong support from which the price can rebound.
We have a major support area in green that pushed the price upward at 205.
Entry price: 210.
First target: 214.
Second target: 219.
Third target: 225.
To manage risk, don't forget stop loss and capital management.
When you reach the first target, save some profits and then change the stop order to an entry order.
For inquiries, please comment.
Thank you.

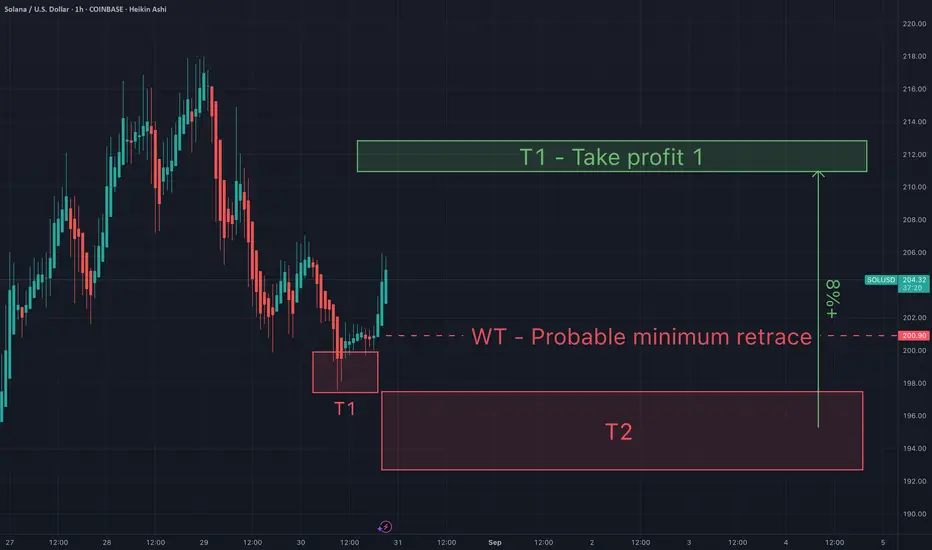
You will ask yourself "how did he know Sol would do that"?On Aug 30th I suggested that Sol was approaching my ideal buy zone at T2. I anticipated a bounce to my take profit target soon after. That played out perfectly.
Question remains...will T2 remain support? What do you think? I'd love to hear your thoughts.
May the trends be with you.

Up or down?Hello friends
Well, considering the growth we had, the analysis of which we have already given you and it was full target, now we needed to go for another update.
Well, considering the price growth, there is an important resistance area on our way that they have determined for us.
If this resistance is validly broken, the price can move to the specified targets, but what if the price cannot break the resistance?
Well, don't worry, we have another scenario where if the price fails to break the resistance and falls, we have identified good support areas that if reached, the price can grow well to the set targets. Finally, it must be said that given the large number of buyers and the buying pressure we have in Solana, sooner or later, I think this resistance will be broken and we will see higher numbers.
*Trade safely with us*

From Rocket to Rock: Solana’s Gravity CheckCRYPTOCAP:SOL may reach $262 as network adoption accelerates and throughput metrics hit new highs, but market dynamics are rarely linear. Cyclical retracements below $100 remain a distinct possibility, reflecting the interplay between speculative sentiment, ecosystem development, and the inherent volatility of high-performance blockchain networks.

Sol - Support and resistance & take profit targetsSol - Support and resistance & take profit targets. Ideally Sol gets a retrace this weekend to my T2 so I can load up even more. Either way I'm taking profits at my green T1.
May the trends be with you.
maybe dropThe market may fluctuate greatly in the short term but
the pattern is so bad and show me strong drop . save your money and good luck
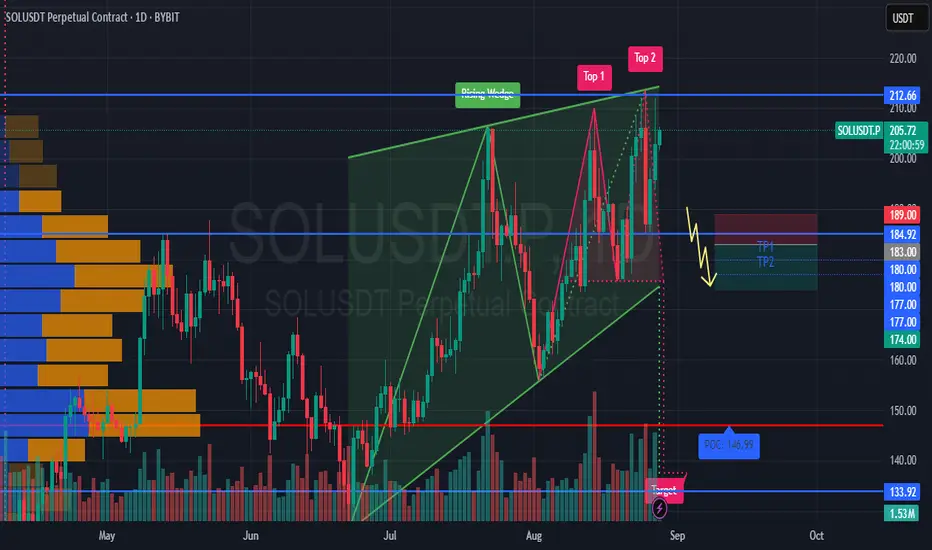
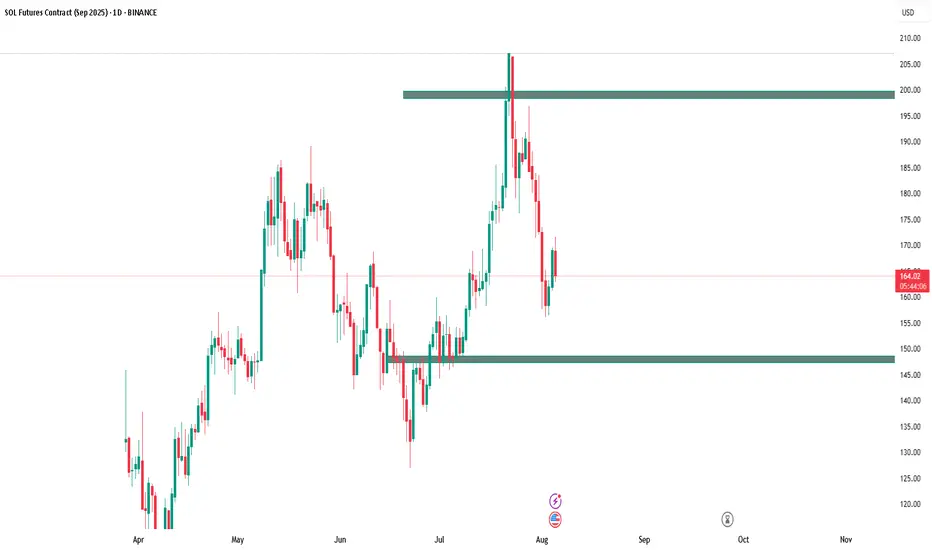
#SOLUSDT maintains a bearish setup📉 SHORT from $183.00
🛡 Stop loss $189.00
🕒 Timeframe: 1D
❗ If the price consolidates above $189, the setup becomes invalid.
⚡ Overview:
➡️ On the daily chart, a Rising Wedge has formed — a bearish pattern signaling potential reversal.
➡️ The $183.00 level is the key zone where the short scenario gets activated.
➡️ The POC at $146.99 remains a strong long-term magnet for price.
➡️ Increasing volumes on red candles confirm seller interest.
🎯 TP Targets:
💎 TP 1: $180.00
💎 TP 2: $177.00
💎 TP 3: $174.00
📢 Short entry is optimal from $183 with a clear stop at \$189.
📢 Focus on holding below $183 — this will confirm the bearish continuation.
📢 In the long term, if $174 breaks, the target could extend to the $147 (POC) zone.
🚀 #SOLUSDT maintains a bearish setup — as long as price holds below $183, expect a move toward $174 and potentially further downside.
SOL : I want to shop in these areas.Hello friends
Well friends, after a few hunts for the channel, the buyers finally broke the channel and the task was clear.
Now, with the price growth and correction we had in the areas identified as channel price pivots, I want to buy and move with it to the specified targets.
*Trade safely with us*

#SOL/USDT Golden Pocket Retest ?#SOL
The price is moving within an ascending channel on the 1-hour frame, adhering well to it, and is on its way to breaking strongly upwards and retesting it.
We have support from the lower boundary of the ascending channel, at 174.85.
We have a downtrend on the RSI indicator that is about to break and retest, supporting the upside.
There is a major support area in green at 173, which represents a strong basis for the upside.
Don't forget a simple thing: ease and capital.
When you reach the first target, save some money and then change your stop-loss order to an entry order.
For inquiries, please leave a comment.
We have a trend to hold above the 100 Moving Average.
Entry price: 181.
First target: 183.
Second target: 186.
Third target: 190.
Don't forget a simple thing: ease and capital.
When you reach the first target, save some money and then change your stop-loss order to an entry order.
For inquiries, please leave a comment.
Thank you.

#SOL/USDT Is This the Perfect Time for a Solana Bullish Heist?#SOL
The price is moving within an ascending channel on the 1-hour frame, adhering well to it, and is on track to break it strongly upwards and retest it.
We have support from the lower boundary of the ascending channel, at 180.
We have a downtrend on the RSI indicator that is about to break and retest, supporting the upside.
There is a major support area in green at 178, which represents a strong basis for the upside.
Don't forget a simple thing: ease and capital.
When you reach the first target, save some money and then change your stop-loss order to an entry order.
For inquiries, please leave a comment.
We have a trend to hold above the moving average of 100.
Entry price: 192.
First target: 196.
Second target: 202.
Third target: 209.
Don't forget a simple thing: ease and capital.
When you reach the first target, save some money and then change your stop-loss order to an entry order.
For inquiries, please leave a comment.
Thank you.
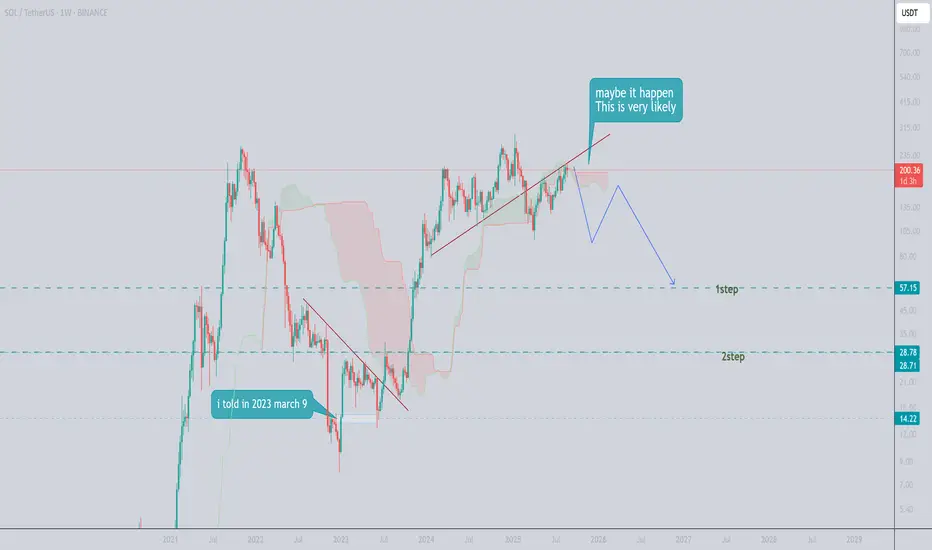
SOLUSDT ling term"🌟 Welcome to Golden Candle! 🌟
We're a team of 📈 passionate traders 📉 who love sharing our 🔍 technical analysis insights 🔎 with the TradingView community. 🌎
Our goal is to provide 💡 valuable perspectives 💡 on market trends and patterns, but 🚫 please note that our analyses are not intended as buy or sell recommendations. 🚫
Instead, they reflect our own 💭 personal attitudes and thoughts. 💭
Follow along and 📚 learn 📚 from our analyses! 📊💡"

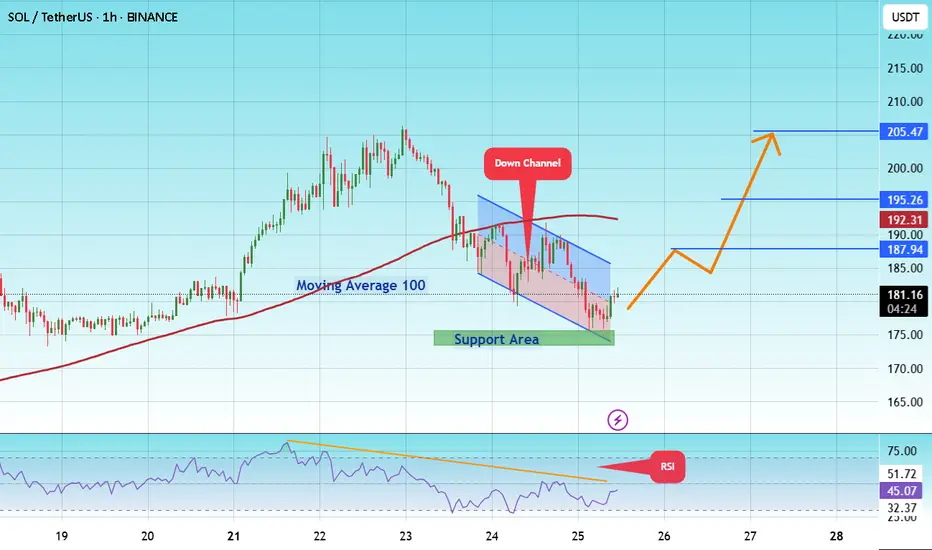
#SOL/USDT coin market structure analysis#SOL
The price is moving within a descending channel on the 1-hour frame and is expected to break and continue upward.
We have a trend to stabilize above the 100 moving average again.
We have a downtrend on the RSI indicator that supports the upward move with a breakout.
We have a support area at the lower boundary of the channel at 175, acting as strong support from which the price can rebound.
We have a major support area in green that pushed the price upward at 174.
Entry price: 181.
First target: 187.
Second target: 195.
Third target: 205.
To manage risk, don't forget stop loss and capital management.
When you reach the first target, save some profits and then change the stop order to an entry order.
For inquiries, please comment.
Thank you.
SOLANA CRYPTO THE RESULT
Follow for more Simple And accurate swing analysis on Indices, Currency, Commodities.
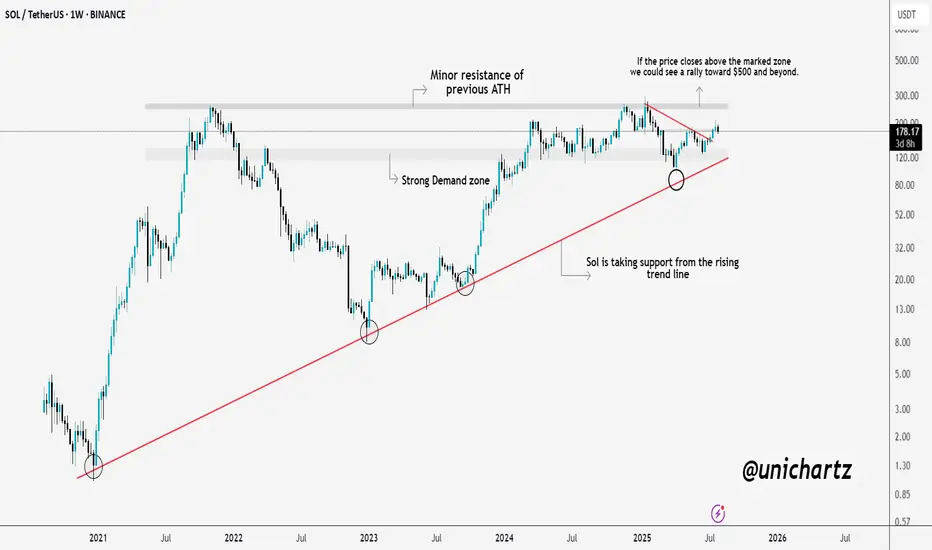
Massive Move Loading? $SOL Prepping for a BreakoutSolana is showing real strength here.
CRYPTOCAP:SOL consistently taking support from the long-term rising trendline, a sign that buyers are defending key levels. We're also approaching a critical resistance zone, which was the previous ATH area.
If SOL manages to close above this zone, we could witness a strong rally towards $500 and beyond. Until then, it’s a crucial level to watch, a breakout here could set the stage for the next leg up.
DYOR, NFA
SOLANA UPDATEHello friends🙌
📉Given the decline we had, you can see that buyers came in and supported the price and were able to change the trend and create an ascending channel.
📈Now, considering that the price is hitting higher ceilings and floors, we can expect an ascending wave until the ceiling of the channel.
Don't forget risk and capital management.⚠
🔥Follow us for more signals🔥
*Trade safely with us*
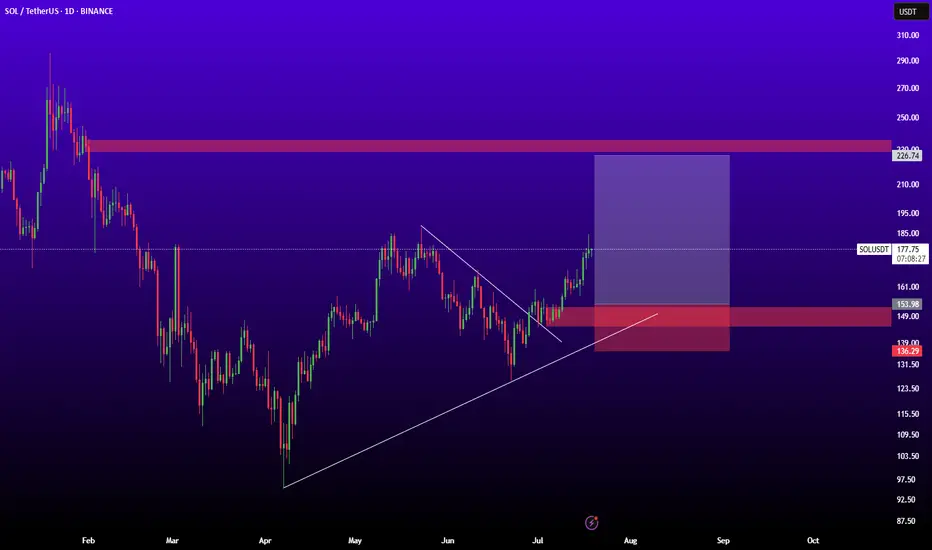
SOLUSDTThis signal for bull-trend because breaked trendline and higher high higher low.
best entry: 154
stop: 136
traget: 226
SOLUSDTThis chart BINANCE:SOLUSDT say to me that change of character. But we need to best confirmations for buy for example: pollback to 143 - 147 $ and higher high next pollback to level.
Support: 147 - 143 - 131.50
Resistance: 158 - 170 - 177 - 183
⚠️Please Control Risk Management in trades.

Solana UpdateHello friends🙌
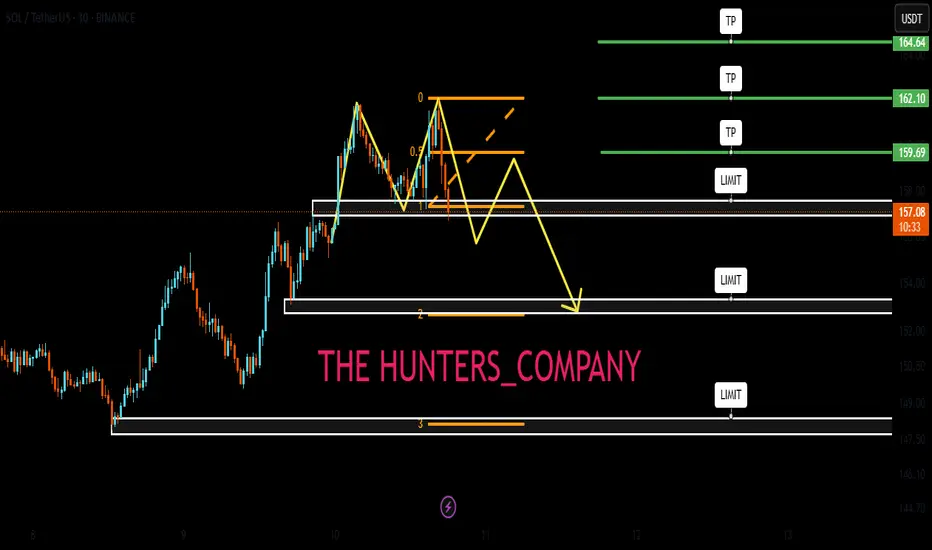
After the price growth we had, the price hit the resistance level of $160 twice and failed to break it, which caused a double top pattern to form, which if confirmed, there is a possibility of falling to the specified areas.😉
The specified areas are good prices for buying in steps, of course, with capital and risk management.✔
🔥Join us for more signals🔥
*Trade safely with us*
#SOL/USDT Loves THIS Pattern | BULLISH#SOL
The price is moving within a descending channel on the 1-hour frame, adhering well to it, and is on its way to breaking strongly upwards and retesting it.
We have a bounce from the lower boundary of the descending channel. This support is at 143.
We have a downtrend on the RSI indicator that is about to break and retest, supporting the upside.
There is a major support area in green at 142, which represents a strong basis for the upside.
Don't forget a simple thing: ease and capital.
When you reach the first target, save some money and then change your stop-loss order to an entry order.
For inquiries, please leave a comment.
We have a trend to hold above the moving average of 100.
Entry price: 149.
First target: 153.
Second target: 156.
Third target: 159.
Don't forget a simple thing: ease and capital.
When you reach the first target, save some money and then change your stop-loss order to an entry order.
For inquiries, please leave a comment.
Thank you.

#SOL/USDTSOLANA →
The price is moving within a descending channel on the 1-hour frame and is expected to break and continue upward.
We have a trend to stabilize above the 100 moving average once again.
We have a downtrend on the RSI indicator that supports the upward move with a breakout.
We have a support area at the lower limit of the channel at 142, acting as strong support from which the price can rebound.
Entry price: 144
First target: 146
Second target: 149
Third target: 152
For risk management, please don't forget stop loss and capital management
When we reach the first target, save some profit and then change the stop to entry
Comment if you have any questions
Thank You

Is SOLANA SOL Ready for a Breakout? Bounce from Falling Channel?
🔍 Chart Pattern and Price Structure Analysis
This chart illustrates a well-formed descending channel (parallel falling channel) that has been developing since mid-January 2025. Currently, the price is approaching the upper boundary of this channel — a key decision area.
🟡 Technical Pattern
Descending Channel: This pattern is characterized by a series of lower highs and lower lows, representing a medium-term bearish trend.
The price is now testing the upper resistance of this channel, a crucial point that could either trigger a breakout or result in another rejection.
📈 Bullish Scenario
If the price successfully breaks out above the upper trendline (around $152–$154), several resistance targets come into play:
1. $164.5 — A minor horizontal resistance and key psychological level.
2. $182.2 — A strong historical resistance zone.
3. $210–$217.8 — A previous consolidation/resistance zone.
4. $237.7, then $261–$280 — Key bullish targets if momentum sustains.
5. Ultimate target near $295.1–$295.7 if broader market sentiment remains strong.
📌 Bullish Confirmation:
Valid daily candle breakout above the channel.
Strong breakout volume.
Successful retest of the breakout area as new support.
📉 Bearish Scenario
If the price fails to break above the channel and gets rejected, we may see a continuation of the downtrend with potential moves to these support levels:
1. $140–$138 — Current minor support zone.
2. $128 — Recent consolidation support.
3. $115.5 — Major support from April.
4. $95.2 — The lowest support zone on the chart.
📌 Bearish Confirmation:
Strong rejection candle (e.g., bearish engulfing) from upper channel.
Weak breakout attempt with declining volume.
Break below the lower channel support or creation of a new lower low.
📊 Conclusion
The current setup is a classic descending channel, indicating a strong mid-term bearish structure.
Price is now at a make-or-break zone — a breakout could signal a trend reversal, while a rejection could extend the current downtrend.
Traders should wait for a confirmed breakout or clear rejection before entering a position.
#SOLUSDT #Solana #CryptoAnalysis #TechnicalAnalysis #DescendingChannel #BreakoutAlert #CryptoTrading #BullishScenario #BearishScenario #Altcoins #CryptoTA

sol updateentry price 169.14
stop loss update 169.14
take profit
160.1
145.1
131.5
result full target
