XAUUSD · M15 · 24-Aug —Long Idea — Post-Spike LPS into 200 EMARetest the Launchpad
Long Idea — Post-Spike LPS into 200 EMA
Global Context: After a strong spike (Wyckoff SOS), look for the backup/LPS to the breakout block where the EMA200 (white) and Donchian trend (green) cluster below price.
Entry: 3,353 – 3,359 (first touch or bullish rejection)
Stop-Loss: 3,332 (below M15 base / green Donchian shelf)
Take Profits:
TP1: 3,378 (spike high) — scale partial, move SL→BE
TP2: 3,392 (momentum extension)
TP3: 3,### (measured move)
RRR (mid-entry 3,356): Risk = 24 → TP2 = 1:1.5, TP3 = 1:2.5 ✅
Triggers: Bullish rejection/engulfing + 8/21 EMA (orange/blue) hold on the pullback above EMA200 (white).
Risk: Max 0.5–1.0% per trade. Trail under the 8 EMA after TP2.
Invalidation: M15 close below 3,332.
Trade Confidence: ⭐⭐⭐⭐ (High-probability if the retest holds above EMA200 + 8/21 confirmation)
⚠️ Trading involves risk. Manage exposure and trade responsibly.
💬 What do you think of this setup? Share your thoughts!
SOS

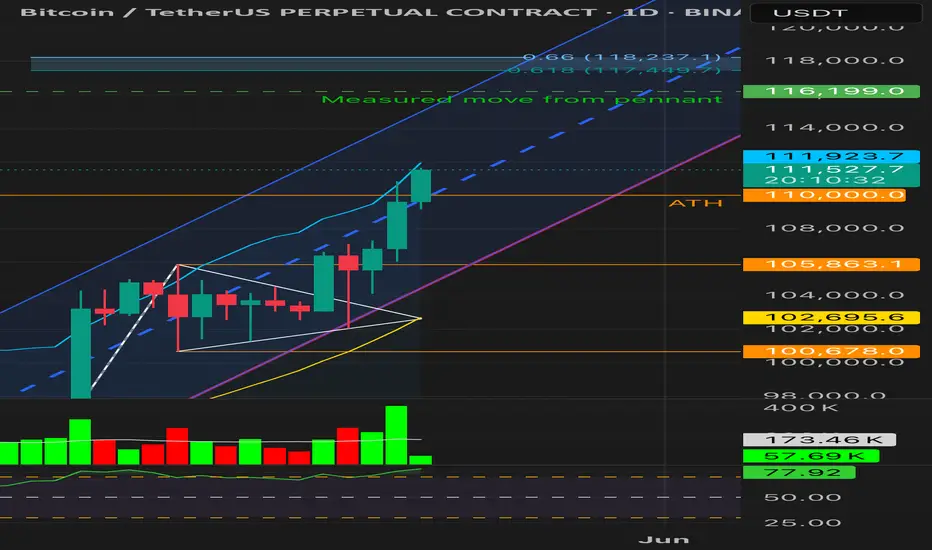
BTC | Testing ATH — Breakout or Trap?Daily close just under ATH at 109,609
We had only 1H confirmation above ATH, with the first 4H close above ATH likely in 30 minutes. The breakout volume is well above average (Volume MA: 172.89k), but daily candle still below resistance.
This could be:
• A Sign of Strength (SOS) transitioning into Phase E markup,
• Or a premature breakout without higher timeframe validation.
⸻
Breakout Validation Checklist:
1. 1H Close Above ATH (~110k) ✅
▸ Initial signal confirmed, but not sufficient alone.
2. 4H Close Above ATH (Pending ~30 mins)
▸ Must close above 110k, with no strong upper wick.
▸ Confirms intermediate-term strength.
3. Daily Close ≥ 110k
▸ Still missing. Required for macro breakout confirmation.
▸ Watch for candle body, not just wick.
4. Throwback & Support Hold at 109.6–110k
▸ Ideally after 4H confirmation, a retest and bounce = textbook
SOS → BU → Markup pattern.
5. Invalidation Risks:
▸ Daily close <109k with high volume
▸ RSI divergence on 4H
▸ Rejection from 114k–116k Fib cluster
▸ Large bearish engulfing below ATH
⸻
Wyckoff Context:
We’re likely in Re-Accumulation Phase D, testing the breakout.
No signs of UTAD or distribution — but low conviction breakouts at ATH are known trap zones.
⸻
What’s Next?
If 4H + Daily confirm, momentum may push toward:
• TP1: 114,449 (Fib 0.618)
• TP2: 116,199 (Measured move)
• TP3: 118,237 (Upper Fib extension)
⸻
Follow for real-time BTC setups based on structure, RSI, and volume — no hopium.
Like & share if this helps clarify the levels you’re watching.
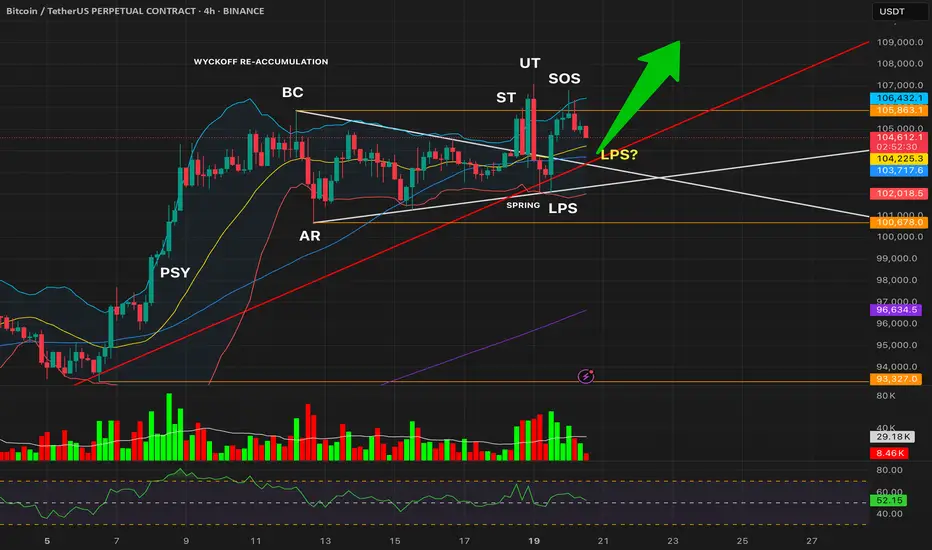
Wyckoff Re-Accumulation – LPS in Play (BTC 4H)
After weeks of sideways action, Bitcoin shows classic **Wyckoff Re-Accumulation** behavior:
### 🧱 Phase Breakdown:
🔹 **Phase A**
* **PSY**: Initial supply surge
* **BC**/**AR**: Range boundaries established
🔹 **Phase B**
* **ST**: Testing top of range
* **UT**: Upthrust above resistance, followed by rejection
🔹 **Phase C**
* **Spring**: Trap move below major trendline
* Cleared liquidity, shook out weak hands, rebounded fast
🔹 **Phase D**
* **LPS**: First higher low after spring
* **SOS**: Breakout from resistance on strength
* **LPS?**: Ongoing retest, holding higher low structure
---
📈 If current LPS holds, this confirms Phase D and opens the path to **Phase E (markup).**
💡 A valid Spring + LPS combo can be one of the highest R/R setups in Wyckoff methodology.
#Wyckoff #BTC #ReAccumulation #Spring #CryptoTrading
Tim's Fundamental View LayoutHere is the way that I view any stock for an initial analysis to get an idea of what the market is valuing and viewing the company.
I first look at the free cash flow, so that is directly under the price chart. Free cash flow is the life-blood of the company and can be used to pay dividends and to reinvest in the company to grow the top line or to buy back stock.
Next I look at the PSR or Price-To-Sales-Ratio. This ratio is paramount for me since the top line shows up first for companies and is the starting point for analysis. Companies with low or no sales growth get priced very differently from companies with high growth. Start with sales growth in your analysis. There are many great books on the topic written by Kenneth L. Fisher, the creator of the tool.
Next "Avg Basic Shares Outstanding" to see if the company is constantly diluting investors and raising capital or hiding expenses by giving out stock options each year. Old companies in slow growth industries tend to buy back stock and growth companies grow shares outstanding and is a strong headwind for investors.
Next is "Long Term Debt"... which is another extremely important variable to look at with any company. In the long run, debt is the cheapest capital since you can pay it off cheaply but it can also drag down a company when the future is uncertain and unpredictable. Companies with predictable sales and growth often load up on debt which enhances returns for equity owners, but increases the risk long term. Jet Blue NASDAQ:JBLU is case in point for this as in 2000 before the pandemic it had a $5 billion market cap with $1 billion in debt and now it has over $8 billion in debt and the market cap is down to $1.5 billion. It is very difficult to get out from under such a heavy debt load. Debt can be "death" for any company if overused.
Next is "Revenue" graphed annually. Essential to see if inflation impacts sales growth or if it can't keep up with inflation. The last 5 years was between 20%-50% inflation depending on the industry so if a company doesn't have higher revenues by at least 20% since 2019, then this reveals a weakness in their pricing power which is a very competitive market with likely declining or low margins.
Last is "Market Cap". It is always good to know the market capitalization of any stock that you own. It is the foundation for understanding if any investor would ever want to buy the whole company and what would it cost to buy it and what are the "returns" from owning the whole company.
I hope you can copy this layout for your own so you too can have a one-page view of the history of a company to help you get your mind around its valuation and potential along with understanding the risks all in one, easy picture.

$SOS ANALYSIS!NYSE:SOS is approaching the red resistance zone 🟥.
⚠️ Be aware! There is a possibility of rejection at this level. Watch for confirmation before taking any position.

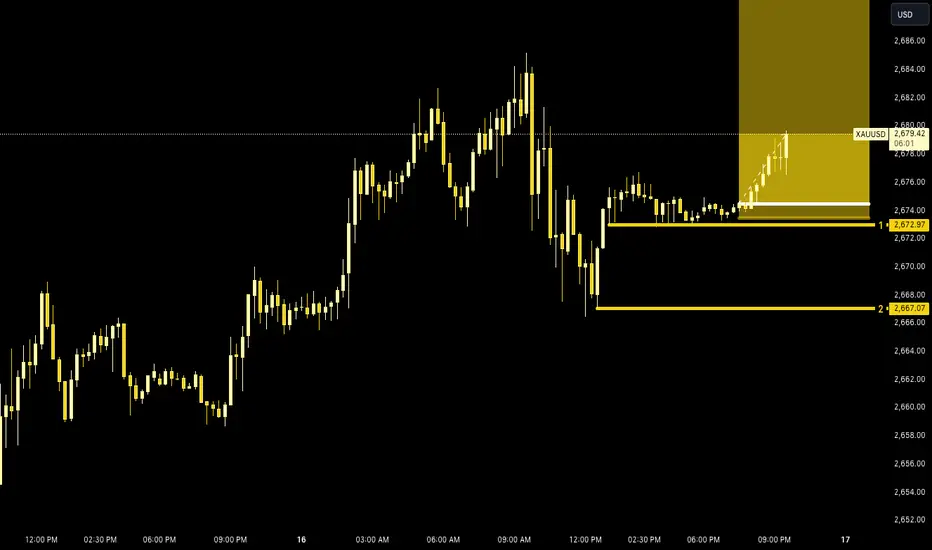
Trading With Harbmayg: Ep. 2PEPPERSTONE:XAUUSD
1. Mode! via 4H
Which mode is the market currently in?
—Buy Mode!
2. Execute! via 15M
Entry— 2674.48
SL— 2673.48
TP— 2704.48
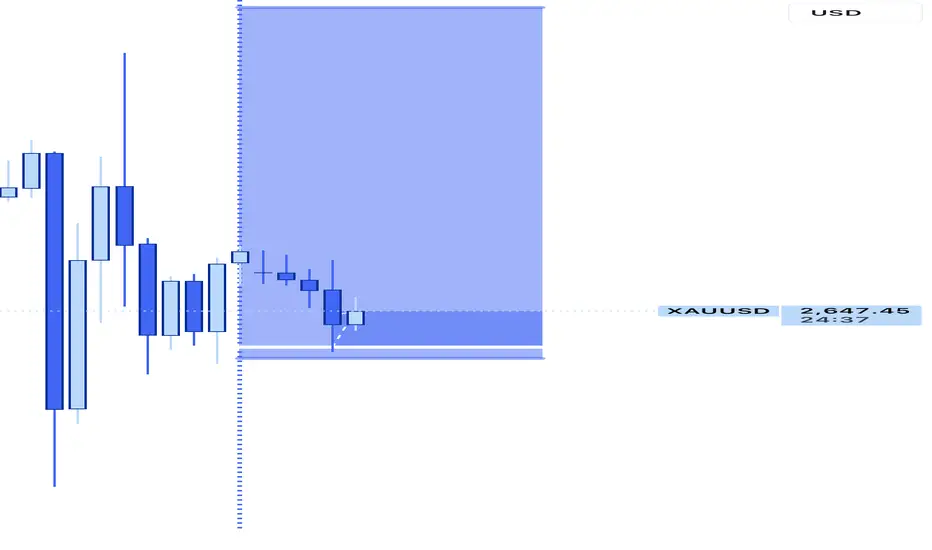
Trading With Harbmayg: Ep. 1XAUUSD “Gold”
1. Mode!
Which mode is the market currently in? via 1H
—Buy Mode!
—Sell Mode!
2. Execution! via 5M
Once entry candle prints via 1H, prepare to enter the position with the SL in optimal placement!
______
Position: Buyer
Limit: 2644.25
SL: 2643.25
TP: 2674.25
Currency Wars: Ep. 2I have identified new structure printed. I have thus decided to execute a buy position at the lower extreme of the price range. With the candle now closing bullish at the low, there is probability that price will hold. I aim to hold this position to as far as Friday, if able.

1:10Thesis: Price broke above from the previous price level marked as “12”. Subsequently, there is to be a pullback and in this case it occurred Friday. Friday formed a head and shoulders pattern to which I waited for another minor pullback before executing.

LINK - Beautiful V Shaped Recovery, w/Volume + SOS & LPS #LINK
This is a textbook stairstep up after a V shaped recovery from a Wyckoff Spring as seen in the left chart where ETH did the same.
Breakthrough volume followed by consolidation volume while stair stepping up.
Mikey Likey

MATIC - Wyckoff Reaccumulation Schematic#MATIC
This looked like a simple flag initially, which is a great bullish continuation pattern, but since has evolved into a #Wyckoff Reaccumulation Schematic. The latter is actually a healthier option, and one which usually warrants less pullbacks vs the simple flag, that very often comes with sharp retraces.
The Volume is perfect, the OBV is perfect, the pattern is perfect, the timing during Trad Fi market close and end of year standard low volume is perfect...
Have you placed your bets?


Look at the chart and become RichBi* ;)With a potential to skyrocket 10-100-300% soon, SOS is the coin that could change your financial future.
So don't wait - get in on the action now and watch your portfolio soar to new heights.

IS OPENDAO (SOS) ABLE TO RETURN TO 4x0The big question is, is OPEDAO able to return to the price action of All Time High
Dec 25, 2021 (a year ago) $0.00001154
DAO trends becoming more interesting with time, but we expect it needs some time and confirmation to make this able to go there.
At this moment on a low time frame it shows interesting, and with confirmation in follow coming time it will confirm that this coin is able to make new gains.
We will take as follow coin to see coming time how this coin will effect the markets.
There is no guaranty in markets.

Wyckoff accumulation + gartley pattern We can notice an accumulation phase in the market. Pay attention at the spring, if you zoom in the chart you can see that the low of the spring has broken the low of selling climax and that is a perfect liquidity grab used by istitutionals to open their big long positions.
Then you can see the gartley pattern that worked perfectly, now I expect a retracment and a continuation of the new uptrend


sos reversal if 2700 hold we will push upward
all depend on btc
but a interesting trade possible breakout fom a bullish wedge
and oversold rsi

SOS Great buying oppurtuintysos looks to be giving one of the best buying opportunity atm
if we break the down trend and hit the first target you could make a great return


SOSBreakout could happen soon i have buy order @ $0.00000299 bought some @$0.00000355. Theres posibility it could go lower but its holding its bottom straight. I have a feeling it will might look something like $COPE. I dont have much experience with air drop tokens. I would be cautious.

$SOS Bullish despite recent news SOS recently had an offering, so i get it if you are done with the company. However, when trading with technicals , it is best to avoid focusing on fundamentals and feelings about a certain stock. I see SOS currently in a huge buy zone around $.50. RSI is currently approaching a similar level when SOS ran last year. CM Williams VIX also indicates a change in buyer sentiment, which combined with a strong support zone, can help us determine when SOS may begin to reverse within this buy zone.
*Disclaimer - I do not own or trade BTC personally. I do trade BTC related stocks and alt-coins. This is only my opinion based on technicals I see.

SOS PREDICTIONSI believe that SOS in the short term is bearish and is bullish in the long term. Apologies for the messy chart, I created it on phone.

SOS gearing up to gap fill Not a financial advisor.
SOS has been beaten down tremendously in the market.
It has been making progress with a reversal. Another thing to point out is that the company hasn't had any updates in quite some time. It may be a time to address the holders here soon.
Once SOS gains a little traction there is a gap to fill to $2.05 Which would get us above the 200 MA
RSI curling up
MACD cross bullish already
TSI crossing bullish to signal strength as well.
Likely the last time you see SOS under a $1 in Feb.
