Will Soybeans Stall Out Against Technical Resistance? Soybeans
Fundamentals: This morning’s weekly export sales report showed net sales of 317,200 MT for 2021/2022 were down 26 percent from the previous week and 16 percent from the prior 4-week average. Net sales of 407,600 MT were reported for 2022/2023.
Technicals: Soybeans are firm in the early morning trade, retracing the losses from the previous two sessions. Previous support is now resistance, the significant pocket comes in from 1720-1728. A breakout and close back above here could spark a run higher with new contract highs on the table. From the risk/reward perspective, this wouldn’t be a bad pocket for hedgers to consider selling.
Bias: Neutral/Bearish
Previous Session Bias: Neutral/Bearish
Resistance: 1720-1728***, 1757 ½-1760**, 1775 ½-1784**
Pivot: 1710
Support: 1690**, 1673-1679 ½***
Futures trading involves substantial risk of loss and may not be suitable for all investors. Trading advice is based on information taken from trade and statistical services and other sources Blue Line Futures, LLC believes are reliable. We do not guarantee that such information is accurate or complete and it should not be relied upon as such. Trading advice reflects our good faith judgment at a specific time and is subject to change without notice. There is no guarantee that the advice we give will result in profitable trades. All trading decisions will be made by the account holder. Past performance is not necessarily indicative of future results.
Soybeans

Soybeans Struggle to Hold Support Soybeans
Technicals: July soybean futures broke and close below trendline support yesterday which opened the door for additional weakness in the overnight session. Futures have recovered some and trading near unchanged. Previous support is now resistance, we see that first hurdle coming in near 1710. On the support side of things, the 50-day moving average and low end of the range come in near 1675. If that support gives way, we could see the selling accelerate.
Bias: Neutral/Bearish
Previous Session Bias: Neutral/Bearish
Resistance: 1720-1728***, 1757 ½-1760**, 1775 ½-1784**
Pivot: 1710
Support: 1690**, 1673-1679 ½***
Futures trading involves substantial risk of loss and may not be suitable for all investors. Trading advice is based on information taken from trade and statistical services and other sources Blue Line Futures, LLC believes are reliable. We do not guarantee that such information is accurate or complete and it should not be relied upon as such. Trading advice reflects our good faith judgment at a specific time and is subject to change without notice. There is no guarantee that the advice we give will result in profitable trades. All trading decisions will be made by the account holder. Past performance is not necessarily indicative of future results.

CBOT Soybean short opportunity.Soybean daily chart reached swing high and reversed.
With Left shoulder also reversed before and momentum confirmation in daily chart.
A short term bearish momentum may continues.
Disclaimer: This is only for educational purpose and not financial advise.

Daily Soybean Market Update (6.14.22)Soybeans
Fundamentals: Yesterday's weekly crop progress report showed the U.S. soybean crop is 88% planted, 70% emerged, and a Good/Excellent rating of 70%. There were no major surprises here. Yesterday's weekly export inspections report came in at 605,129 metric tons, well above the 365,455 last week and 141,320 we saw in the same week last year.
Technicals: Soybean futures broke through support from 1720-1728, this will now act as resistance. A close back above here opens the door for a potential run back at the contract highs and above. There is some trendline support from May 17th-June 7th that is holding well over the past 24 hours. A break and close below here could spark a drop back below $17.00.
Bias: Neutral/Bearish
Previous Session Bias: Neutral/Bearish
Resistance: 1757 ½-1760**, 1775 ½-1784**
Pivot: 1720-1728
Support: 1690**, 1673-1679 ½***
Futures trading involves substantial risk of loss and may not be suitable for all investors. Trading advice is based on information taken from trade and statistical services and other sources Blue Line Futures, LLC believes are reliable. We do not guarantee that such information is accurate or complete and it should not be relied upon as such. Trading advice reflects our good faith judgment at a specific time and is subject to change without notice. There is no guarantee that the advice we give will result in profitable trades. All trading decisions will be made by the account holder. Past performance is not necessarily indicative of future results.

Event-Driven Strategy on Binary OutcomesCBOT:ZS1!
Last week, I laid the groundwork for a new idea on event-driven strategy. Event-Driven Strategy Focusing on Global Crisis. Three-factor Commodities Futures Pricing Model and Game Theory Matrix were introduced, illustrated with my own experience trading COMEX Gold Futures (GC) during the US-China trade conflict in 2019. My idea was featured on Editors’ Picks, generating over 16,000 views and nearly 800 likes.
Today, I would expand my idea to traders who want to construct their own event-driven strategy, in a 3-step approach.
Firstly, to qualify as a crisis, it needs to have the magnitude to shock the global market. Below is a few examples of global crises in the past five years:
• US-China Trade Conflict (2018): The two countries account for 42% of global GDP and have a combined population of 1.7 billion people, 22% of the world total. New tariffs imposed on thousands of goods with multi-year cumulative amount reaching $2 trillion.
• African Swine Fever (2018): It reportedly wiped out 60% of the pigs in China. Supply shortage from the No. 1 pork producer sent pork price up 300% in China. Global markets from the U.S. to Europe also felt the pain, as meat prices went up across the board, affecting pork, beef, lamb, and poultry.
• Brexit (2019): The withdrawal of Great Britain from the European Union resulted in a loss of 20% of GDP and 13% of population in the world’s third largest economic block. The impact on Britain itself is less than certain, as it would trade less with EU members, and more with countries outside of Europe.
• COVID (2019): The Coronavirus outbreak has turned into a global pandemic, and dramatically changed the world and our lives as we know it.
• Trump defeated in the U.S. presidential election (2020): It put a stop to the “America First” policies. In just four years, U.S. political landscape has once again swung widely.
• Russia-Ukraine Conflict (2022): First major military conflict in Europe since WW2. In addition to the hundreds of thousands of casualty and millions of refugees, the ongoing conflict disrupted the global supply of energy and agricultural products, sending US inflation to a 40-year high.
• Lockdowns in China (2022): Dozens of Chinese cities have been under some form of lockdowns in recent months, affecting a quarter of its population. It also created huge bottleneck in global supply chain, sending rippling effects around the world.
Secondly, analyze the impact of a crisis and attempt to define it in binary outcomes. These outcomes must be mutually exclusive and collectively exhaustive (MECE). If you are unclear of the outcomes, or there are too many of them, it would be difficult to construct a trading strategy around the crisis. Riding on the above examples of crises events, we will have their binary outcomes as follows:
• US-China Trade Conflict: Fight or Talk (alternatively, Tariff or No Tariff)
• African Swine Fever: Contained or Spread Out (Not Contained)
• Brexit: Approved or Not Approved
• US Election: Democrats Win or Republicans Win
• Ukraine situation: Putin Wins or Putin Loses (Peace deal is considered a Loss for Russia)
• China’s Zero-Covid Policy: Shanghai Lockdown or End of Lockdown
Thirdly, search and identify financial instruments that are most affected by the crisis. How do you know which is the right one amid a wide range of financial instruments? A quick test is to observe whether its price change correlates to the binary outcomes of the crisis.
In a classical supply and demand diagram, fundamental drivers move price up or down along the supply and demand lines in a continuous fashion. A crisis event shifts the lines to the left or to the right, pushing sudden price bumps as the event hits the news headlines.
Deep dive into the trade conflicts between China and the U.S., we can deploy the event-driven strategy on a commodity directly impacted by tariff. Interestingly, it was not a Chinese commodity tallied by Mr. Trump, but a U.S. commodity being taxed by China – Soybeans produced by U.S. farmers.
On April 2nd, 2018, the Trump administration announced that it would impose 25% tariffs on about 1,300 industrial, technology, transportation, and medical products made in China. In less than a day, China responded by imposing a 25% tariff on 106 goods in 14 categories, including soybeans, automobiles, and chemicals originating in the U.S.
Following China’s announcement, CBOT Soybeans Futures (ZS) dropped 2.2% and touched a low of $9.83/bushel. In my view, the initial price down was an understatement. I believed that CBOT Soybeans could go a lot lower with the tariff making the U.S. grains less competitive than those from South America. Over the next week, I put in Short ZS Futures positions, mainly on back-month contracts. Here are the logics behind my trades.
As the world’s largest consumer and importer of Soybeans, China imports 85% of its soybeans for domestic consumption to meet the huge appetite in cooking (soybean oil) and animal feeds (soybean meal). United States is the largest producer and exporter of Soybeans, with 68% of its export going to China.
Tariff takes time to impact the market fully. At first, Chinese importers expedited purchase of US soybeans ahead of the tariff deadline. They also increased buying from Brazil and Argentina. Eventually, when the cheap grains were exhausted and inventory was depleted, they would be forced to buy from American farmers again. The higher price with tariff would encourage use of alternative ingredients and reduce the overall Chinese demand on soybeans.
This prediction has been proven to be on the right track, as CBOT Soybean Futures continued to decline in the next three months until it hit $8.00/bushel, down 20% from levels before the tariff.
Let’s rework the Soybean trade using our 3-step approach.
Firstly, Does it have the magnitude to shock the global market? Yes. 40 million metric tons of soybeans, or $15 billion a year, would be taxed by China. It had huge negative impact on U.S. farm incomes.
Secondly, could we define the Soybean tariff as an event with binary outcomes? Yes, it is either “Tariff On” or “Tariff Off”. If the tension escalated, tariff would stick and become a permanent part of soybean cost. On the other hand, if US and China started a trade talk, soybean tariff could be removed later. While the tariff impact on nearby futures is fixed, it is not so on back-month futures prices.
Thirdly, is Soybean Futures the right instrument to use? Let’s apply our three-factor commodities pricing model on soybean, as follows:
Soybean Futures Price = Soybean Cash Price + Market Sentiment + Probability of Tariff
In a “Tariff On” scenario, the probability of tariff increases to 100%. While production cost in the U.S. is not affected, Chinese exporters must pay 25% more to buy. The reduced demand for U.S. soybean has the net impact of pushing futures price down. Therefore, the sign of Tariff Premium should be negative in the case of soybean futures.
In a “Tariff Off” scenario, trade talk could reduce the probability from 100% to 25%, for example. A signal of Chinese demand recovery has the net impact of raising futures price up.
Typically, about 1/3 of US soybean, or 40 out of 120 million metric tons of the grain, is exported to China every year. This sheer size made tariff a dominant factor driving soybean price, outweighing fundamental factors such as planted acreage, weather, and yield.
This concludes the use of US-China Trade Conflict as a case study for applying the event-driven strategy. My next writings would explore new strategies on more recent event shocks such as the lockdowns in China and the Ukraine situation.
Meanwhile, please tell me what you think, either on TV or by email.
Happy Trading.
Disclaimers
*Trade ideas cited above are for illustration only, as an integral part of a case study to demonstrate the fundamental concepts in risk management under the market scenarios being discussed. They shall not be construed as investment recommendations or advice. Nor are they used to promote any specific products, or services.

Soybeans Under Pressure to Start the WeekFundamentals: Soybeans are under pressure to start the week, along with many other commodities and markets as last week's outside market turmoil has poured into this week's trade. This afternoon's Crop Progress report is expected to show the U.S. soybean crop near 90% planted. Good/Excellent conditions are expected to come in near 70%. Last year at this time the crop was rated 62% G/E.
Commitments of Traders Update: Friday’s CoT report showed Managed Money were net sellers of 6,505 futures/options contracts, through June 7th. This shrinks their net long position to 153,654. Broken down, that is 168,458 longs VS 14,804 shorts.
Technicals (July): July soybeans were weaker to round out the week, which gave back just a portion of the sharp rally that we saw on Thursday. 1750 is our pivot pocket, a close above or below here could set the tone for the next 25 cent move. On the resistance side, 1775-1784 is the objective for Bulls. A breakout above there puts the market back in uncharted territory which makes in extremely difficult to find high conviction resistance levels. $16.00 would be the next psychological barrier. On the support side of things, 1720-1728 is the pocket the Bulls want to defend. This pocket was previously resistance and will now act as support. If that gives way, it could spark long liquidation back below $17.00.
Bias: Neutral/Bearish
Previous Session Bias: Neutral
Resistance: 1757 ½-1760**, 1775 ½-1784**
Pivot: 1750
Support: 1720-1728***, 1690**, 1673-1679 ½***
Futures trading involves substantial risk of loss and may not be suitable for all investors. Trading advice is based on information taken from trade and statistical services and other sources Blue Line Futures, LLC believes are reliable. We do not guarantee that such information is accurate or complete and it should not be relied upon as such. Trading advice reflects our good faith judgment at a specific time and is subject to change without notice. There is no guarantee that the advice we give will result in profitable trades. All trading decisions will be made by the account holder. Past performance is not necessarily indicative of future results.

$SOYB / $ZS_F: Weekly and monthly trends are upSoybeans have been consolidating and shorts have been hitting the same level near the invasion day highs for 3 months give or take, today price broke out and confirmed a weekly trend signal. The monthly timeframe indicates beans can rally until October 2022, so, getting lower timeframes to turn bullish again presents us with a massive reward to risk long opportunity here. I bot July futures / $SOYB calls today, aiming to capture the move shown in the continuous chart here. If you want you can join the trade when beans futures open tonight, keep in mind you will need to roll the position to the next contract month 8 calendar days before the expiration date give or take (you'll see volume is high on that day), or, to make it simpler, buy the Nov 18 $31 strike $SOYB calls. If you buy futures, calculate risking a drop under last week's low, if you buy options, calculate risking 1-5% of your capital in call premium. Over time we might be able to bet on higher strikes as well, or trade around the position in shorter term timeframes (often good to delta hedge calls with 15m setups on the short side if you're good at scalping, then use proceeds to add to the call position for increased exposure without increasing risk).
Best of luck!
Cheers,
Ivan Labrie.

Soybean Technical Update (6.8.22)Soybeans (July)
Technicals: July soybean futures were able to defend trendline support in the prior two sessions which helped spark a rally in yesterday’s trade. That rally has led to follow-through buying in the overnight/early morning trade with July futures making new contract highs. The market has been up here a few times in the past few weeks but failed to find more buyers. Time will tell if this time is different. With the market at new contract highs, the task of finding the next meaningful resistance point becomes more difficult. Going off the continuous chart you could use the February 24th high for the March contract, 1759 ¼ and the April 22nd high from the May contract, 1757 ½. Finding meaningful points above that is a game of pin the tail on the donkey.
Bias: Neutral
Previous Session Bias: Neutral
Resistance: 1757 ½-1760**
Pivot: 1750
Support: 1717-1720***, 1690**, 1673-1679 ½***

Soy Bean update - 05/06/2022expecting more upside near 1850 to complete wave (5) of ((3)), key level at 1576.6


SOYBEANS $SOYBEANS High-risk Initial Short SOYBEANS $SOYBEANS High-risk Initial Short . SL and TP on chart. 10-30x leverage. Move SL on TP.

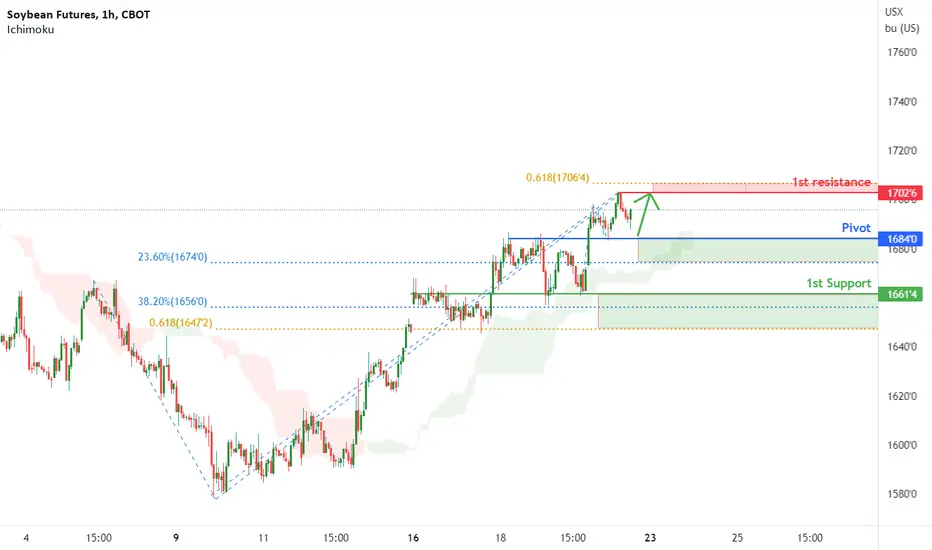
Soy beans Futures ( ZS1! ), H1 Potential for Bullish bounceType : Bullish Bounce
Resistance : 1734
Pivot: 1702
Support : 1687
Preferred Case: With price moving above our ichimoku cloud , we have a bullish bias that price will rise to our 1st resistance at 1734 in line with the 127.2% Fibonacci extension from our pivot of 1702 in line with the horizontal pullback support and 23.6% Fibonacci retracement.
Alternative scenario: Alternatively, price may break pivot structure and head for 1st support at 1687 in line with the horizontal overlap support and 50% Fibonacci retracement .
Fundamentals: No Major News
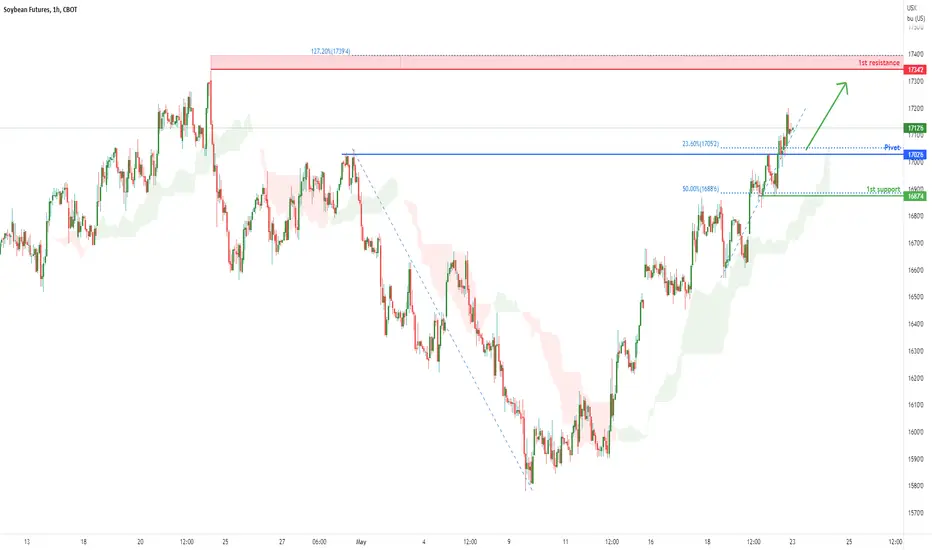
Soy beans Futures ( ZS1! ), H1 Potential for Bullish bounType : Bullish Bounce
Resistance : 1702'6
Pivot: 1684'0
Support : 1661'4
Preferred Case: With price being above our ichimoku cloud , we have a bullish bias that price will rise to our 1st resistance at 1702'6 in line with the swing high resistance and 61.8% Fibonacci projection from our pivot of 1684'0 in line with the horizontal overlap support and 23.6% Fibonacci retracement .
Alternative scenario: Alternatively, price may break pivot structure and head for 1st support at 1661'4 in line with the horizontal overlap support, 38.2% fibonacci retracement and 61.8% Fibonacci projection .
Fundamentals: No Major News
Any opinions, news, research, analyses, prices, other information, or links to third-party sites contained on this website are provided on an "as-is" basis, as general market commentary, and do not constitute investment advice. The market commentary has not been prepared in accordance with legal requirements designed to promote the independence of investment research, and it is therefore not subject to any prohibition on dealing ahead of dissemination. Although this commentary is not produced by an independent source, FXCM takes all sufficient steps to eliminate or prevent any conflicts of interest arising out of the production and dissemination of this communication. The employees of FXCM commit to acting in the clients' best interests and represent their views without misleading, deceiving, or otherwise impairing the clients' ability to make informed investment decisions. For more information about the FXCM's internal organizational and administrative arrangements for the prevention of conflicts, please refer to the Firms' Managing Conflicts Policy. Please ensure that you read and understand our Full Disclaimer and Liability provision concerning the foregoing Information, which can be accessed on the website.
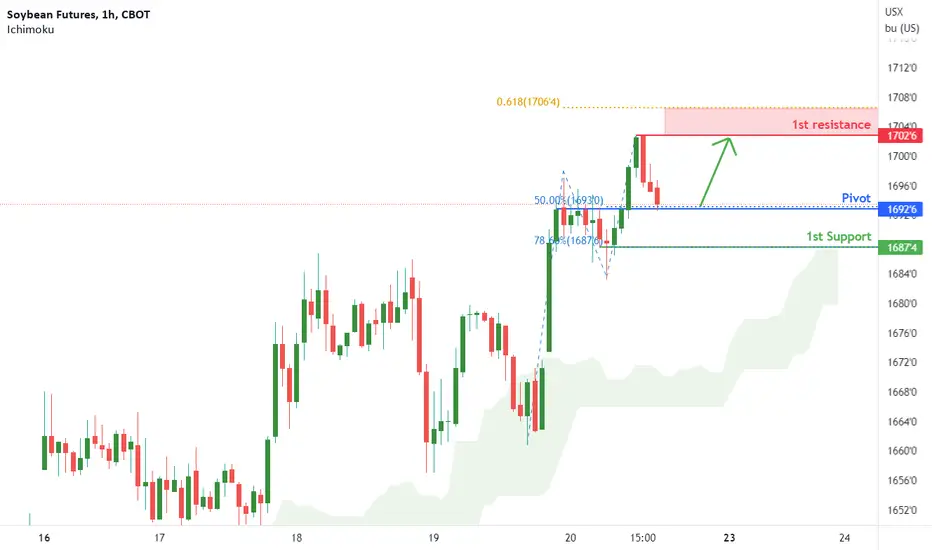
Soy beans Futures ( ZS1! ), H1 Potential for Bullish bounceType : Bullish Bounce
Resistance : 1702'6
Pivot: 1692'6
Support : 1687'4
Preferred Case: With price being above our ichimoku cloud , we have a bullish bias that price will rise to our 1st resistance at 1702'6 in line with the swing high resistance and 61.8% Fibonacci projection from our pivot of 1692'6 in line with the horizontal pullback support and 50% Fibonacci retracement .
Alternative scenario: Alternatively, price may break pivot structure and head for 1st support at 1687'4 in line with the horizontal swing low support and 78.6% Fibonacci retracement .
Fundamentals: No Major News
Any opinions, news, research, analyses, prices, other information, or links to third-party sites contained on this website are provided on an "as-is" basis, as general market commentary, and do not constitute investment advice. The market commentary has not been prepared in accordance with legal requirements designed to promote the independence of investment research, and it is therefore not subject to any prohibition on dealing ahead of dissemination. Although this commentary is not produced by an independent source, FXCM takes all sufficient steps to eliminate or prevent any conflicts of interest arising out of the production and dissemination of this communication. The employees of FXCM commit to acting in the clients' best interests and represent their views without misleading, deceiving, or otherwise impairing the clients' ability to make informed investment decisions. For more information about the FXCM's internal organizational and administrative arrangements for the prevention of conflicts, please refer to the Firms' Managing Conflicts Policy. Please ensure that you read and understand our Full Disclaimer and Liability provision concerning the foregoing Information, which can be accessed on the website.
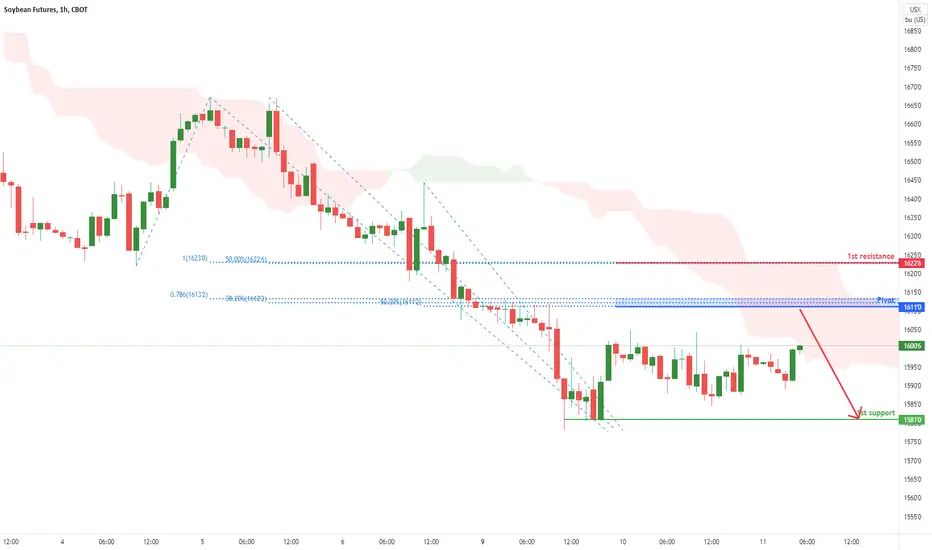
Soy beans Futures ( ZS1! ), H1 Potential for Bearish ContinuatioType : Bearish Continuation
Resistance : 1622'6
Pivot: 1611'2
Support : 1581'0
Preferred Case: With price expected to reverse off the ichimoku resistance and Fibonacci confluence area, we have a bearish bias that price will drop to our 1st support in line with the horizontal swing low support from our pivot of 1611'0 in line with the Fibonacci confluence area.
Alternative scenario: Alternatively, price may break pivot structure and head for 1st resistance in line with the 50% Fibonacci retracement and 100% Fibonacci projection.
Fundamentals: No Major News
Soy beans Futures ( ZS1! ), H1 Potential for Bearish ContinuatioType : Bearish Continuation
Resistance : 1622'6
Pivot: 1611'2
Support : 1581'0
Preferred Case: With the ichimoku indicating some bearish momentum, we have a bearish bias that price will drop to our 1st support in line with the swing low support at 1581'0 from our pivot of 1611'2 in line with the 38.2%, 50% Fibonacci retracement and 78.6% Fibonacci projection.
Alternative scenario: Alternatively, price may break pivot structure and head for 1st resistance in line with the 50% Fibonacci retracement and 100% Fibonacci projection.
Fundamentals: No Major News

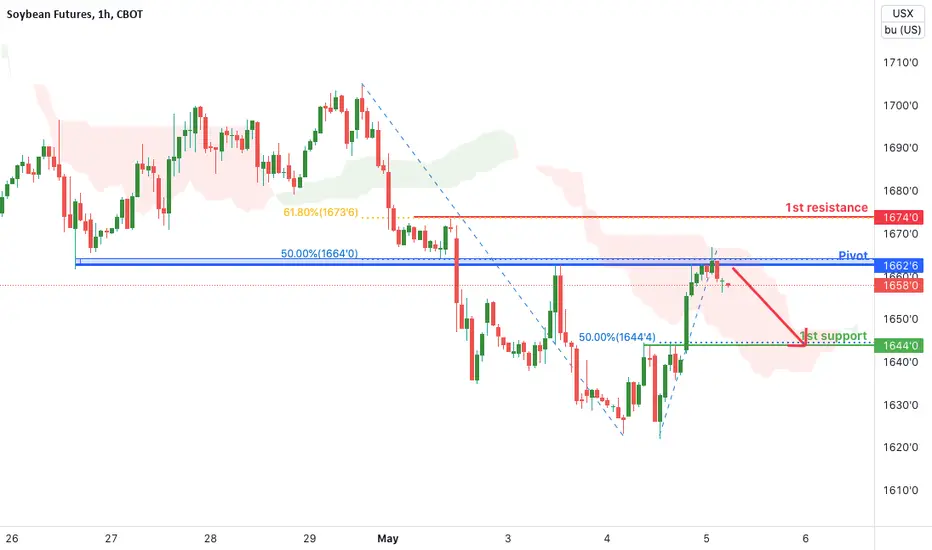
Soybean Futures (ZS1!), H1 Potential for Bearish ContinuationType : Bearish Continuation
Resistance: 1674
Pivot: 1662'6
Support : 1644
Preferred case: With price moving below the ichimoku cloud, we see a potential bearish continuation from our pivot level of 1662'6 which is in line with 50% Fibonacci retracement and horizontal pullback resistance towards our 1st support level of 1644 which is in line with the horizontal pullback support.
Alternative scenario: Alternatively, price may break our pivot structure and head for 1st resistance level of 1674 in line with 61.8% Fibonacci retracement and horizontal pullback resistance.
Fundamentals: No major news.
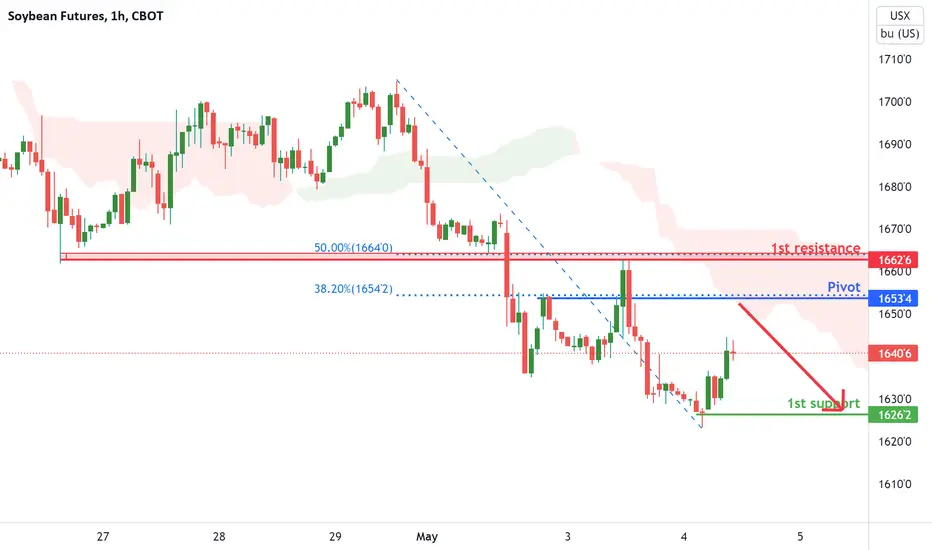
Soybean Futures (ZS1!), H1 Potential for Bearish ContinuationType : Bearish Continuation
Resistance: 1662'6
Pivot: 1653'4
Support : 1626'2
Preferred case: With price moving below the ichimoku cloud, we see a potential bearish continuation from our pivot level of 1653'4 which is in line with 38.2% Fibonacci retracement and horizontal pullback resistance towards our 1st support level of 1626'2 which is in line with the horizontal swing low support.
Alternative scenario: Alternatively, price may break our pivot structure and head for 1st resistance level of 1662'6 in line with 50% Fibonacci retracement and horizontal pullback resistance.
Fundamentals: No major news.
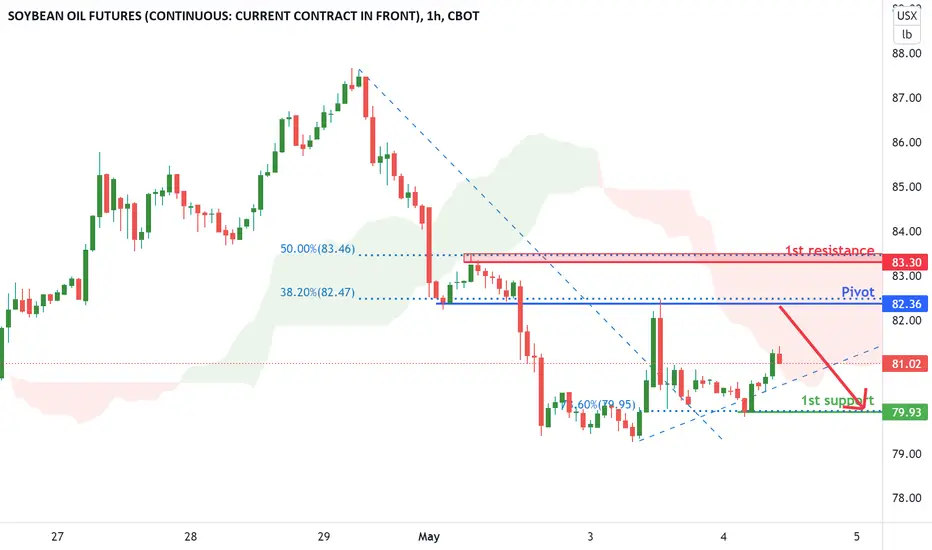
Soybean Oil Futures (ZL1!), H1 Potential for Bearish ContinuatioType : Bearish Continuation
Resistance: 83'30
Pivot: 82'45
Support : 79'93
Preferred case: With price expected to reverse off the resistance of the ichimoku cloud, we see a potential bearish continuation from our pivot level of 82'45 which is in line with 38.2% Fibonacci retracement and horizontal pullback resistance towards our 1st support level of 79'93 which is in line with the horizontal swing low support and 78.6% Fibonacci retracement.
Alternative scenario: Alternatively, price may break our pivot structure and head for 1st resistance level of 83'30 in line with 50% Fibonacci retracement and horizontal swing high resistance.
Fundamentals: No major news.
SoyBeans: Cup & Handle + H&SMain Pattern: Cup & Handle?? a little dirty
Daily Pattern: Confirmation H&S?? a little dirty too
maximum risk 0.50%
long above 1734 first one 0,25%

Soybeans and Rate of Change PotentialBeans – 3mo Continuous: Comparing our current Bull market with the previous major bull markets of the past 50 years. Currently the 24 mo ROC is at 92%.
If beans move to the upper trendline in the $20.00 area it would be a 130% ROC and would “pale in comparison” to the 06-08 and 71-73 bull markets.
A 200% ROC on the charts would look very ugly to some and wonderfull to others with a price area at $26.00
**Disclosure** Do not take this as trading advice. The potential is there for higher markets, but anything could keep us from getting above today’s High.

