S&P 500: Bearish For The Short Term! Sell It!Welcome back to the Weekly Forex Forecast for the week of July 28 - Aug 1st.
In this video, we will analyze the following FX market for the week of Aug 4-8th:
S&P 500 (ES1!)
The S&P 500 rose Friday to fresh highs, following a busy week of tariff updates and earnings. The S&P ended the week with its fifth straight record close, its longest such streak in over a year.
No reason to consider selling. Wait for pullbacks to FVGs for high probability buys.
FOMC and NFP loom. Be careful to avoid new entries during news times.
Enjoy!
May profits be upon you.
Leave any questions or comments in the comment section.
I appreciate any feedback from my viewers!
Like and/or subscribe if you want more accurate analysis.
Thank you so much!
Disclaimer:
I do not provide personal investment advice and I am not a qualified licensed investment advisor.
All information found here, including any ideas, opinions, views, predictions, forecasts, commentaries, suggestions, expressed or implied herein, are for informational, entertainment or educational purposes only and should not be construed as personal investment advice. While the information provided is believed to be accurate, it may include errors or inaccuracies.
I will not and cannot be held liable for any actions you take as a result of anything you read here.
Conduct your own due diligence, or consult a licensed financial advisor or broker before making any and all investment decisions. Any investments, trades, speculations, or decisions made on the basis of any information found on this channel, expressed or implied herein, are committed at your own risk, financial or otherwise.
Sp500analysis

S&P 500 (ES1): Post FOMC, Buyers Pushing Back To The Highs!In this video, we will analyze the following FX market for July 31 - Aug 1st.
S&P 500 (ES1!)
In the Weekly Forecast for the S&P 500, we highlighted:
- price is bullish, and expected to go higher. It did move to ATH before pulling back.
- the sell side liquidity under the ascending lows would draw price.... which it did.
- the Area of Fair Value below the lows, with the Demand Zone as the potential level where a
a high probability long could setup.... which was spot on!
Did you benefit from the forecast? Let me hear from you if you did, in the comment section.
Enjoy!
May profits be upon you.
Leave any questions or comments in the comment section.
I appreciate any feedback from my viewers!
Like and/or subscribe if you want more accurate analysis.
Thank you so much!
Disclaimer:
I do not provide personal investment advice and I am not a qualified licensed investment advisor.
All information found here, including any ideas, opinions, views, predictions, forecasts, commentaries, suggestions, expressed or implied herein, are for informational, entertainment or educational purposes only and should not be construed as personal investment advice. While the information provided is believed to be accurate, it may include errors or inaccuracies.
I will not and cannot be held liable for any actions you take as a result of anything you read here.
Conduct your own due diligence, or consult a licensed financial advisor or broker before making any and all investment decisions. Any investments, trades, speculations, or decisions made on the basis of any information found on this channel, expressed or implied herein, are committed at your own risk, financial or otherwise.

S&P 500 Intraday & Swing Entries H1 entry is close to getting activated for intraday.
If you want a swing trade then wait for H4 entry (you might be waiting a while obviously)
Reason for entries - We have broken out of Balance since July 25th and currently in a trend phase until we establish a new value area, or return to the one we broke out from.
So since Trend and Momentum is UP, then we should find Low Volume Areas to enter in the direction of the trend for a classic pullback entry trade.
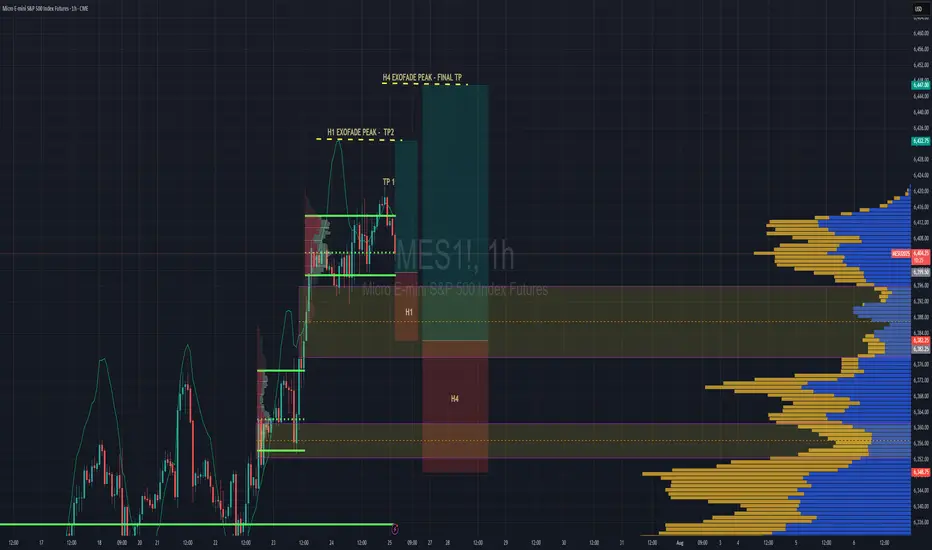
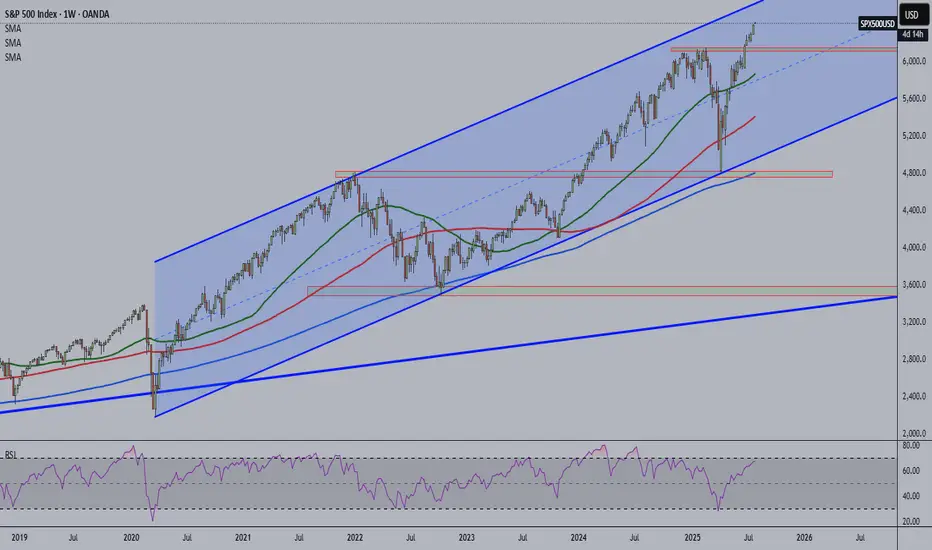
Overbought alert? The S&P500 is nearing weekly and monthly bullish channel resistance. Price has remained within this channel since 2020.
PEPPERSTONE:US500 VANTAGE:SP500
S&P 500 (ES1): Buyers In Control Amid Tariff Deals & EarningsWelcome back to the Weekly Forex Forecast for the week of July 28 - Aug 1st.
In this video, we will analyze the following FX market:
S&P 500 (ES1!)
The S&P 500 rose Friday to fresh highs, following a busy week of tariff updates and earnings. The S&P ended the week with its fifth straight record close, its longest such streak in over a year.
No reason to consider selling. Wait for pullbacks to FVGs for high probability buys.
FOMC and NFP loom. Be careful to avoid new entries during news times.
Enjoy!
May profits be upon you.
Leave any questions or comments in the comment section.
I appreciate any feedback from my viewers!
Like and/or subscribe if you want more accurate analysis.
Thank you so much!
Disclaimer:
I do not provide personal investment advice and I am not a qualified licensed investment advisor.
All information found here, including any ideas, opinions, views, predictions, forecasts, commentaries, suggestions, expressed or implied herein, are for informational, entertainment or educational purposes only and should not be construed as personal investment advice. While the information provided is believed to be accurate, it may include errors or inaccuracies.
I will not and cannot be held liable for any actions you take as a result of anything you read here.
Conduct your own due diligence, or consult a licensed financial advisor or broker before making any and all investment decisions. Any investments, trades, speculations, or decisions made on the basis of any information found on this channel, expressed or implied herein, are committed at your own risk, financial or otherwise.

sp500 up to 6535sp500 with in my pov target to 6535 by a flag created maybe and with this super upside trend for these days

SPY (SP-500) - Rising WedgeYesterday we had a breakdown of the rising wedge on SPY. I draw out some important levels to look out for coming days/weeks. The trendline since april has also been broken. ICEUS:DXY is breaking out to which is increasing the risks for a "Risk off" scenario in tech stocks and crypto.
Nothing here should be interpreted as financial advise. Always do your own research and decisions.

S&P 500 (SPX) 1M next week?The S&P 500 is pulling back from a key resistance after completing a bearish AB=CD pattern on the monthly chart. Price action suggests a potential correction toward the 4662–4700 zone, aligning with the 0.618 Fibonacci retracement level, which may serve as a key area for bullish reaccumulation. Momentum indicators show bearish divergence, hinting at a cooling rally.
Fundamentally, the index remains supported by strong earnings in tech and AI sectors, but risks persist from elevated interest rates, sticky inflation, and potential Fed policy shifts. A pullback into the 4662–4700 zone may offer a medium-term setup for continuation toward 5198 and potentially 5338. A breakdown below 4662 would invalidate the bullish structure and shift focus to lower Fibonacci levels.

**** Market Trading Strategy Idea SP500 ***Key Chart & Economic Insights:
- Current Market Position
- The S&P 500 is around $6000, showing positive momentum (+1.03%).
- Upward trend visible, indicating strong buying interest.
- Economic tailwinds support continued growth.
- Projected Price Movements
- 6800 USD: Key resistance level where selling pressure could emerge.
- Market pullback: A correction after 6800 may create a buyback opportunity.
- Recovery phase: Expected rebound toward 7000-7500 USD, another selling position.
- Economic Context: U.S. Manufacturing Boom & GDP Growth
- The United States is ramping up domestic production, boosting industrial output and reshoring manufacturing.
- This shift is fueling GDP growth, strengthening economic fundamentals and potentially sustaining bullish market momentum.
- Strong consumer spending & investment could drive stocks higher, aligning with the planned trade strategy.
Risk Management & Optimization:
- Entry & Exit Precision: Define stop-loss and take-profit levels.
- Momentum Confirmation: Ensure price action validates expected moves.
- Economic Indicators: Watch manufacturing & GDP data for trend validation.
If you want to refine this analysis or explore other scenarios, I'm here to dive deeper into key points! 🚀 Subscribe! TSXGanG
I hold a CCVM and MNC (Certificate of Competence to become a securities broker anywhere in Canada) and have been working as a trader for five years.
It’s a pleasure for me to help people optimize their trading strategies and make informed financial market decisions.

SP500 Ready to Continue it's Bullish MoveI just bought SP500 for it's bullish move continuation.
Monthly structure is bullish.
Weekly is bullish.
Daily is also bullish.
I entered for a long buy on the daily time frame retracement.

SP500 BEARISH TRADE IDEA Key Observations:
Imbalance Zone Identified (Supply-Demand Gap):
The pink zone is marked as an imbalance — an area where price moved too quickly upward, leaving little trading volume in between.
These imbalances often act like magnets, drawing price back to "fill" them.
Recent Price Action:
Price recently formed a peak and has since started pulling back.
The latest candlesticks show bearish momentum (a series of red Heikin Ashi candles with increasing size).
Projected Price Movement:
A blue arrow projects a further decline into the imbalance zone, suggesting price may retest this level for liquidity or to complete a retracement.
Target Area:
The imbalance zone lies approximately between 5,680 and 5,736, with a midpoint around 5,710.
This is a logical target for a pullback before potentially resuming upward.
📉 Bearish Bias Justification:
Market Structure: A new lower high is forming, possibly signaling a short-term reversal or correction.
Heikin Ashi Candles: Smooth and elongated bearish candles indicate strength in the down move.
Volume Imbalance Theory: Price may need to fill this inefficiency before finding new direction.
✅ Possible Trading Implications:
Short Setup: Traders might look for short positions with targets inside the imbalance zone.
Buy Opportunity: Once the imbalance is filled, if bullish price action confirms, it could become a strong buy zone.
⚠️ What to Watch:
Look for confirmation (e.g., candlestick reversal or support forming) in the imbalance area before assuming reversal.
News/events (such as the economic calendar icons below) might impact price direction sharply.

S&P 500 | Blue Box as Margin of SafetyWhen the index returns to the blue box, it reaches a zone forged by genuine buying interest and technical alignment. In a disciplined, data‑driven approach, this area serves as our first line of defense.
Why It Matters
• Past reactions show price pauses and reversals here, revealing real demand.
• It coincides with key footprint volume clusters where buyers have stepped in.
Entry Criteria
Higher‑Time‑Frame Stability
Confirm price holds within or above the blue box before considering a position.
Lower‑Time‑Frame Confirmation
Wait for clear breakouts or higher‑lows on short‑term charts backed by rising footprint volume.
Strict Risk Control
If price breaks through without retest or volume support, stand aside and seek a clearer setup.
By treating the blue box as our margin of safety and relying on actual volume footprint data, we trade with prudence and let the market’s real signals guide our decisions.
📌I keep my charts clean and simple because I believe clarity leads to better decisions.
📌My approach is built on years of experience and a solid track record. I don’t claim to know it all but I’m confident in my ability to spot high-probability setups.
📌If you would like to learn how to use the heatmap, cumulative volume delta and volume footprint techniques that I use below to determine very accurate demand regions, you can send me a private message. I help anyone who wants it completely free of charge.
🔑I have a long list of my proven technique below:
🎯 ZENUSDT.P: Patience & Profitability | %230 Reaction from the Sniper Entry
🐶 DOGEUSDT.P: Next Move
🎨 RENDERUSDT.P: Opportunity of the Month
💎 ETHUSDT.P: Where to Retrace
🟢 BNBUSDT.P: Potential Surge
📊 BTC Dominance: Reaction Zone
🌊 WAVESUSDT.P: Demand Zone Potential
🟣 UNIUSDT.P: Long-Term Trade
🔵 XRPUSDT.P: Entry Zones
🔗 LINKUSDT.P: Follow The River
📈 BTCUSDT.P: Two Key Demand Zones
🟩 POLUSDT: Bullish Momentum
🌟 PENDLEUSDT.P: Where Opportunity Meets Precision
🔥 BTCUSDT.P: Liquidation of Highly Leveraged Longs
🌊 SOLUSDT.P: SOL's Dip - Your Opportunity
🐸 1000PEPEUSDT.P: Prime Bounce Zone Unlocked
🚀 ETHUSDT.P: Set to Explode - Don't Miss This Game Changer
🤖 IQUSDT: Smart Plan
⚡️ PONDUSDT: A Trade Not Taken Is Better Than a Losing One
💼 STMXUSDT: 2 Buying Areas
🐢 TURBOUSDT: Buy Zones and Buyer Presence
🌍 ICPUSDT.P: Massive Upside Potential | Check the Trade Update For Seeing Results
🟠 IDEXUSDT: Spot Buy Area | %26 Profit if You Trade with MSB
📌 USUALUSDT: Buyers Are Active + %70 Profit in Total
🌟 FORTHUSDT: Sniper Entry +%26 Reaction
🐳 QKCUSDT: Sniper Entry +%57 Reaction
📊 BTC.D: Retest of Key Area Highly Likely
📊 XNOUSDT %80 Reaction with a Simple Blue Box!
📊 BELUSDT Amazing %120 Reaction!
📊 Simple Red Box, Extraordinary Results
I stopped adding to the list because it's kinda tiring to add 5-10 charts in every move but you can check my profile and see that it goes on..

SPY Breakout Watch: Triangle Pressure Builds Above 590SPY has surged in a strong V-shaped recovery from the March low of ~480 to testing major resistance around 595–600. The daily chart shows sustained higher highs and higher lows, but price now stalls at a key supply zone with multiple doji candles—signaling indecision. A rising trendline provides strong support near 570.
Zooming into the 60-minute chart, SPY forms an ascending triangle with flat resistance at 590 and rising support from 584. Volume contraction suggests accumulation, priming a potential breakout. A 60-min close above 590 targets 596, with a stop under 588.
On the 15-minute timeframe, bull-flags form frequently after morning gaps, with breakouts typically launching 4–5 points higher. VWAP and the 20-MA converge near 588.5, making it an ideal pullback entry zone.
Strategy for May 19–23:
Long on a clean breakout above 590 (target: 594–596)
Stop under 587.5–588
Caution if daily closes below 570
Expect early-week upside tests of 590–594, followed by a potential breakout toward 595–600. If a high-volume rejection occurs near that zone, a quick scalp-short may be in play.

US500 bearish 12 May - 16 May 2025S&P 500 Bearish Outlook: Targeting $5,100 Amid Rising Uncertainty
As of May 12, 2025, the S&P 500 (US500) stands at 5,661, reflecting a robust recovery from its April lows. However, I anticipate a bearish shift, projecting a decline towards the $5,100 level in the near term. Several converging factors underpin this outlook:
1. Anticipated Weakness in Core CPI Data
The upcoming release of the April Core Consumer Price Index (CPI) on May 13 is poised to be a pivotal event. While the year-over-year Core CPI is forecasted at 2.8%, matching the previous month's figure, the month-over-month increase is expected to rise to 0.3%, up from 0.1% in March. This acceleration suggests persistent inflationary pressures, potentially prompting the Federal Reserve to maintain or even tighten monetary policy, thereby exerting downward pressure on equities.
2. Deteriorating Market Sentiment and Forecasts
A notable shift in market sentiment is evident, with key indicators turning bearish. A prominent S&P 500 model has signaled its first bearish outlook since February 2022, reflecting growing investor apprehension. Additionally, leading financial institutions have revised their S&P 500 targets downward:
Goldman Sachs: Reduced from 6,500 to 5,700
RBC Capital Markets: Lowered from 6,600 to 5,500
Oppenheimer: Cut from 7,100 to 5,950
Yardeni Research: Adjusted from 7,000 to 6,000
These revisions underscore the mounting concerns over economic headwinds and market volatility.
3. Sectoral Divergence: Opportunities Amidst the Downturn
While the broader market faces challenges, certain sectors may exhibit resilience or even bullish tendencies:
Healthcare: Continues to serve as a defensive sector, with companies demonstrating solid quarterly results and reaffirming full-year guidance despite tariff impacts.
Energy Infrastructure: Firms like Enbridge and TC Energy benefit from long-term structural tailwinds, including rising energy demand and global energy security priorities.
Financials and Technology: Sectors represented by ETFs such as XLK and XLF are highlighted for their strong fundamentals and growth prospects.
Conversely, consumer discretionary sectors are showing signs of strain, with negative revenue surprises and companies like Harley-Davidson withdrawing their 2025 outlooks amid tariff uncertainties.
4. Implications of the US-UK Trade Deal
Recent developments in the US-UK trade agreement further contribute to market uncertainty. While the deal includes exemptions for certain British goods, such as aerospace components and a quota of 100,000 UK-made cars annually, it also maintains a baseline 10% tariff on foreign goods. This policy introduces complexity and potential cost pressures for multinational companies operating across borders.
Moreover, the agreement has faced criticism for being one-sided, with concerns that it may not adequately protect domestic industries or address broader trade imbalances. Such apprehensions can dampen investor confidence and contribute to market volatility.
The convergence of persistent inflation, cautious monetary policy, revised market forecasts, and the complexities introduced by recent trade agreements suggest a bearish trajectory for the S&P 500, with a potential decline towards $5,100. Investors should remain vigilant, monitoring sector-specific developments and macroeconomic indicators to navigate the evolving market landscape.
Disclaimer: This analysis is for informational purposes only and does not constitute investment advice. Always conduct your own research before making investment decisions.

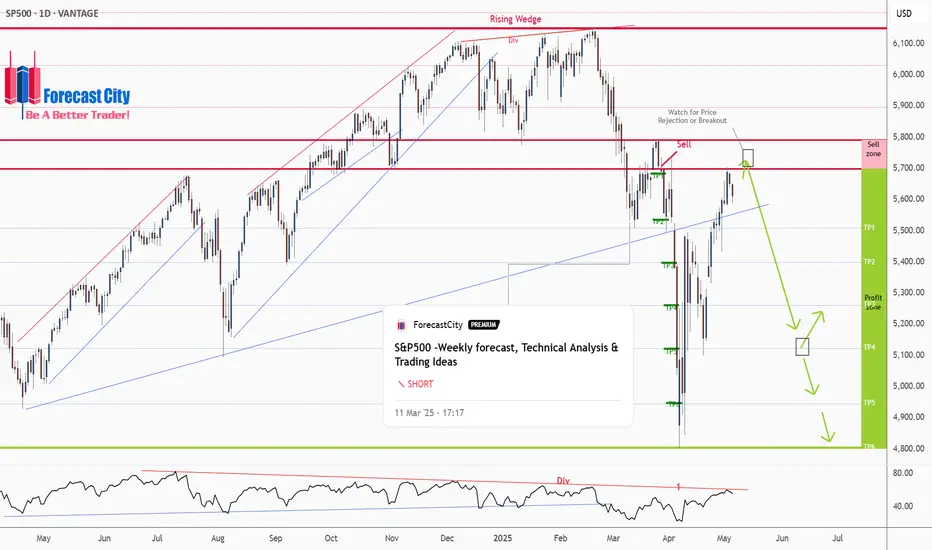
S&P500 -Weekly forecast, Technical Analysis & Trading IdeasPrevious forecast result:
As you can see in the 4CastMachine forecast on 12/03/2025, the price, after rejecting the sell zone, began its sharp decline and touched all TPs.
Midterm forecast:
While the price is below the resistance 6149.57, resumption of downtrend is expected.
We make sure when the support at 4804.01 breaks.
If the resistance at 6149.57 is broken, the short-term forecast -resumption of downtrend- will be invalid. CSEMA:S&P
Technical analysis:
While the RSI downtrend #1 is not broken, bearish wave in price would continue.
A trough is formed in daily chart at 4807.10 on 04/07/2025, so more gains to resistance(s) 5698.65, 5791.00, 5896.50 and maximum to Major Resistance (6149.57) is expected.
Price is above WEMA21, if price drops more, this line can act as dynamic support against more losses.
Relative strength index (RSI) is 55.
Take Profits:
5509.32
5363.90
5261.00
5122.47
4944.41
4804.01
__________________________________________________________________
❤️ If you find this helpful and want more FREE forecasts in TradingView,
. . . . . . . . Hit the 'BOOST' button 👍
. . . . . . . . . . . Drop some feedback in the comments below! (e.g., What did you find most useful? How can we improve?)
🙏 Your support is appreciated!
Now, it's your turn!
Be sure to leave a comment; let us know how you see this opportunity and forecast.
Have a successful week,
ForecastCity Support Team
#ES1! "E-Mini S&P500" Index Market Bullish Robbery Plan🌟Hi! Hola! Ola! Bonjour! Hallo! Marhaba!🌟
Dear Money Makers & Robbers, 🤑 💰💸✈️
Based on 🔥Thief Trading style technical and fundamental analysis🔥, here is our master plan to heist the #ES1! "E-Mini S&P500" Index Market Heist. Please adhere to the strategy I've outlined in the chart, which emphasizes long entry. Our aim is to escape near the high-risk YELLOW MA Zone. It's a Risky level, overbought market, consolidation, trend reversal, trap at the level where traders and bearish robbers are stronger. 🏆💸"Take profit and treat yourself, traders. You deserve it!💪🏆🎉
Entry 📈 : "The vault is wide open! Swipe the Bullish loot at any price - the heist is on!
however I advise to Place buy limit orders within a 15 or 30 minute timeframe most recent or swing, low or high level. I Highly recommended you to put alert in your chart.
Stop Loss 🛑:
Thief SL placed at the Nearest / Swing low level Using the 3H timeframe (5440) Day/Swing trade basis.
SL is based on your risk of the trade, lot size and how many multiple orders you have to take.
🏴☠️Target 🎯: 5730
💰💵💸#ES1! "E-Mini S&P500" Index Money Heist Plan is currently experiencing a bullishness,., driven by several key factors. .☝☝☝
📰🗞️Get & Read the Fundamental, Macro Economics, COT Report, Geopolitical and News Analysis, Sentimental Outlook, Intermarket Analysis, Index-Specific Analysis, Future trend targets with Overall outlook score... go ahead to check 👉👉👉🔗🔗🌎🌏🗺
⚠️Trading Alert : News Releases and Position Management 📰🗞️🚫🚏
As a reminder, news releases can have a significant impact on market prices and volatility. To minimize potential losses and protect your running positions,
we recommend the following:
Avoid taking new trades during news releases
Use trailing stop-loss orders to protect your running positions and lock in profits
💖Supporting our robbery plan 💥Hit the Boost Button💥 will enable us to effortlessly make and steal money 💰💵. Boost the strength of our robbery team. Every day in this market make money with ease by using the Thief Trading Style.🏆💪🤝❤️🎉🚀
I'll see you soon with another heist plan, so stay tuned 🤑🐱👤🤗🤩

Hurst's 4.5 Year cycles is in "Time wise"=Trough is close or notHurst's Cyclic Theory:
The basic tenant behind this theory is that markets achieve significant lows (or troughs) at the beginning (or end) of a cycle. Cycles have varying degrees based on wave length (in time) and are harmonized with the higher level cycles.
- Blue is 4.5 starting the day of the IPO !!!

S&P 500 Analysis Ahead of the Busiest Week of Earnings SeasonS&P 500 Chart Analysis Ahead of the Busiest Week of Earnings Season
Despite the fact that President Trump’s earlier decision to impose tariffs (at higher rates than expected) shook the stock markets, the S&P 500 index (US SPX 500 mini on FXOpen) could still end April without significant losses (currently trading less than 2% below the month’s opening level) or even achieve a positive result.
According to media reports, around 180 S&P 500 companies are expected to release their quarterly earnings this week, including Apple (AAPL), Amazon (AMZN), Coca-Cola (KO), Eli Lilly (LLY), Meta (META), Microsoft (MSFT), and Chevron (CVX).
The share prices of these major companies — some of the largest by market capitalisation — could have a substantial impact on the S&P 500 index chart (US SPX 500 mini on FXOpen), given that their combined weight accounts for approximately a quarter of the index calculation.
Technical Analysis of the S&P 500 Chart
Based on the key price actions marked on the chart, we can identify a descending trend channel for the US stock market, which has been in effect since mid-February.
At the same time, the price has:
→ moved into the upper half of this channel, reaching its upper boundary;
→ found support around the median line (as evidenced by the price action on 21 April).
These are bullish signs, reinforced by the aggressive nature of the rebound from the psychological 5,000-point level, which acted as significant support in the first few days following the tariff announcement. Bears may still see an attractive opportunity to attempt to resume the downward momentum of the S&P 500 index (US SPX 500 mini on FXOpen), but will the fundamental backdrop support such a move?
From an optimistic perspective, sharp impulses driven by corporate news could lead to a breakout above the upper boundary of the red channel. This would likely be facilitated by important announcements (particularly from senior officials in the US, China, and Europe) regarding de-escalation of the tariff situation.
This article represents the opinion of the Companies operating under the FXOpen brand only. It is not to be construed as an offer, solicitation, or recommendation with respect to products and services provided by the Companies operating under the FXOpen brand, nor is it to be considered financial advice.

S&P 500: Key Levels and Potential ScenariosThis analysis of S&P500 will explore both bullish and bearish scenarios, incorporating key levels and considering possible market and crowd psychology.
Bullish Scenario: Potential Uptrend Resumption
From a bullish perspective, if the S&P 500 maintains a position above the 5482 level, it could suggest a potential end to the current correction and a resumption of the major uptrend. A hold above 5482 might reinforce bullish sentiment, encouraging further buying activity, as traders may view this as confirmation of renewed strength. The index could then potentially retest the 5801 level, where it's possible that the index may encounter resistance on the first attempt. A successful break above 5801 would then open the path towards the 6135 zone, which represents a key upside target.
Bearish Scenario: Potential Retest of Support Zones
Conversely, if the S&P 500 fails to hold above the 5482 support level might trigger increased selling pressure, as traders liquidate positions. The index could then potentially retest the 5092 to 4833 support zone. This zone represents a critical area where buyers may step in, but a break below it would signal further weakness.
Concluding Remarks
In conclusion, the S&P 500's price action around the identified key levels will be crucial in determining its short- to medium-term direction. A sustained hold above 5482 could favor a bullish continuation towards 5801 and potentially 6135, while a break below 5482 might lead to a retest of the 5092 to 4833 support zone.

SP500 what to expect next?As a seasoned trader with over a decade of experience navigating the markets, I’ve been closely monitoring the S&P 500’s current price action. The index is presently confined within a well-defined range, with resistance at 5,528 and support at 5,146, based on recent price behavior. We’ve observed a notable deviation below the lower boundary of this range, which often signals a potential reversal or absorption of liquidity before a move higher.
My analysis suggests the next likely target is the upper boundary of the range at 5,528, coinciding with a weekly Fair Value Gap (FVG) that has yet to be filled. Should the price approach this zone, I anticipate a strong market reaction, potentially driven by aggressive order flow as participants defend or challenge this key level. If the weekly FVG is invalidated—meaning price sweeps through this area without significant rejection—the S&P 500 could be poised to break out and target new all-time highs from its current position.

Stock Markets Consolidate Ahead of the HolidaysStock Markets Consolidate Ahead of the Holidays
A lull is expected on the financial markets today due to a shortened trading week related to the Easter holiday celebrations.
It is reasonable to assume that traders will get a “breather” after a news-heavy April, which caused a volatile “shakeout” in the stock markets.
US Stock Markets
On Wednesday, Federal Reserve Chair Jerome Powell was both cautious and somewhat aggressive in his forecasts regarding US monetary policy, stating that Trump’s tariffs could delay the achievement of inflation targets.
In response, US President Donald Trump accused Powell of “playing politics”, hinting at his possible dismissal.
European Stock Markets
On Thursday, the ECB cut interest rates for the seventh time in the past 12 months, and European Central Bank President Christine Lagarde left the door open for further easing.
Analysts had expected a rate cut from 2.65% to 2.40%, so the financial markets reacted relatively calmly to the ECB’s decision.
Technical Analysis of the S&P 500 Chart (US SPX 500 mini on FXOpen)
On the charts of European and US stock indices today, a narrowing triangle pattern is forming, indicating a balance between supply and demand — in other words, price is more efficiently factoring in all influencing elements.
On the S&P 500 chart (US SPX 500 mini on FXOpen), the triangle is highlighted in grey. The ADX and ATR indicators are trending downwards, which underlines signs of consolidation.
From a bearish perspective, the market is in a downtrend (marked by the red trend channel) — but from a bullish point of view, price is in the upper half of the channel.
Although the situation appears “reassuring”, the long weekend may bring a string of high-impact statements from the White House, which could disrupt the balance and lead to a breakout from the triangle.
It is not out of the question that the bulls may seize the initiative and challenge the upper boundary of the channel in an attempt to lay the groundwork for an upward trend (shown in blue lines).
This article represents the opinion of the Companies operating under the FXOpen brand only. It is not to be construed as an offer, solicitation, or recommendation with respect to products and services provided by the Companies operating under the FXOpen brand, nor is it to be considered financial advice.

Trump Delays Tariffs for 90 Days. The S&P 500 Rebounds SharplyTrump Delays Tariffs for 90 Days. The S&P 500 Rebounds Sharply
As shown in the chart of the S&P 500 (US SPX 500 mini on FXOpen), the index is currently trading near the 5,500 level.
This result is highly encouraging, considering that as recently as yesterday morning, the index was hovering around 4,900.
Why Have Stocks Risen?
The strong rebound seen yesterday evening was triggered by a statement from the US President — he announced a 90-day delay in the implementation of wide-ranging global trade tariffs, which had originally been unveiled on 2 April and led to a sharp drop in the index (as indicated by the arrow).
However, this does not apply to China, for which tariffs were not delayed but increased. "Due to the lack of respect China has shown towards global markets, I am raising the tariff imposed on China by the United States of America to 125%, effective immediately," said Donald Trump, according to media reports.
Overall, US stock markets responded positively to the news, and Goldman Sachs economists have withdrawn their US recession forecasts.
Technical Analysis of the S&P 500 Chart (US SPX 500 mini on FXOpen)
Despite yesterday’s sharp rebound, the stock market remains in a downtrend (as indicated by the red channel).
From a bullish perspective:
→ A Double Bottom pattern (A–B) has formed around the 4,900 level;
→ Price has moved into the upper half of the channel.
From a bearish perspective:
→ Bulls must overcome key resistance near the psychological 5,000 level;
→ While tariffs have been delayed, they have not been cancelled. As such, the risk of an escalating trade war is likely to continue putting pressure on the S&P 500 index (US SPX 500 mini on FXOpen) in the coming months.
This article represents the opinion of the Companies operating under the FXOpen brand only. It is not to be construed as an offer, solicitation, or recommendation with respect to products and services provided by the Companies operating under the FXOpen brand, nor is it to be considered financial advice.

Island Bottom CONFIRMED on $SPY IF we GAP up tomorrow!Island Bottom CONFIRMED on AMEX:SPY SP:SPX IF we GAP up tomorrow!
I only believe we can GAP up tomorrow if there is news of China coming to the negotiation table with the U.S. after they raise the Reciprocal Tariffs to 104%.
If this doesn't happen, then this isn't confirmed, and we see a retest of $482, IMO!
I'm not playing this as a trade until we get confirmation! Too dangerous!
Not financial advice
