April 24, 2025 - Not getting fired (yet)Hello everyone, it’s April 24, 2025, welcome back to another wild episode of “Trumponomics: The Market Edition.” For the second day in a row, global markets are on the rise, and yes, it’s all thanks to the Trump playbook: slap tariffs everywhere, terrify the market, escalate tensions, then toss out a gesture of peace and voilà — rally mode engaged.
The key word this morning? Relief. Relief that Trump might chill out on China, and Powell isn’t getting fired (yet). But let’s not pop the champagne too soon — anyone betting against a weekend plot twist from Trump hasn’t been paying attention.
In the US, the Fed’s Beige Book (a.k.a. the economy’s mood diary) painted a picture that’s… let’s say “limp but not lifeless.” Only 5 of the 12 Fed districts saw growth, and even that was more “walker with tennis balls” than Olympic sprint. Inflation? Creeping in slowly, with companies sharpening their price-hike pencils just in case Trump cranks up the tariff heat again. Employment? Not awful, but nothing to brag about. And uncertainty? It was mentioned 80 times in the report. That’s not a joke.
Meanwhile, auto sales are up — not because the economy’s booming, but because Americans are panic-buying ahead of expected price surges from more tariffs. Business travel is tanking, and tourism’s taking a nosedive. Welcome to the “Not-quite-a-crisis-but-definitely-not-fine” States of America.
As for OANDA:XAUUSD , after a brief flirtation with $3,500, it’s cooled down to $3,337. BLACKBULL:WTI is holding at $62.86. And INDEX:BTCUSD ? It’s back in the spotlight at $92,000 and climbing — yes, people are talking about it again, which should tell you something about the vibe out there.
On the politics front, Trump hinted that the tariff moratorium could be revoked for some countries, and he’s back to pestering Powell to cut rates. Classic. Meanwhile, Wall Street is just trying not to get whiplash. NYSE:BA numbers came in better than feared, and NASDAQ:NVDA supply chain via INX looks solid despite wild swings.
Today’s economic calendar includes durable goods data and jobless claims in the CME_MINI:ES1! are down 0.2% — looks like investors are just bracing for the next Trump curveball.
TL;DR: Markets are riding the Trump-coaster, gold cooled off, crypto’s surging, and America’s economy is wobbling but still upright — for now. Keep your helmets on.
SPX (S&P 500 Index)

Narrative Noise vs. System ClarityApparently, the market was “uncertain” today.
Somewhere between Trump retracting his Powell shade, the Fed playing PR dodgeball, and tariffs being simultaneously on and off the table… headlines were doing what they do best: explaining yesterday with confidence.
But the chart?
The chart spoke first.
We came into the session ready for bullish confirmation.
Instead, we got a clean rejection of 5400, with early signs of downside pressure before lunch.
This is why we follow price, not PR.
Today’s action didn’t invalidate the bull bias completely, but it sure made the case that bears aren’t done just yet.
Let’s unpack what we saw and where we’re headed next.
---
Additional images mentioned can be seen on my main blog
---
SPX Market Outlook - Structure Rejected, Futures Rolling
While the headlines continue to spin post-news confusion, the price action remains our guide.
Yesterday, we came into the session prepared for a bullish continuation, but 5400 acted as a firm barrier once again.
The daily chart showed a clear rejection, and despite the bullish lean in the morning, the structure leaned bearish by session’s end.
Now, as I write this before the cash open, overnight futures are pushing lower, indicating potential follow-through.
That doesn’t confirm anything just yet - but it does tilt the bias.
Here’s what I’m watching:
5400 = still key resistance
5300 = GEX flip level - will reassess bearish view if we break and hold below it
5000 remains the target for the Wolfe pattern continuation
Upper Bollinger tag is in - another technical sign of short-term exhaustion
No bear pulse bar yet, but a clean V-shaped reversal is visible on the chart
ADD remains near bull extreme - offering more bear potential than bull in the short term
Bias remains bearish below 5300, and I’ll reassess to add in below that level.
---
GEX Analysis Update
5500 - 5400 - 5350 all look interesitng levels
5300 is the current flip point
---
Expert Insights: React to Price, Not PR
❌ Mistaking news for a setup
Narratives are seductive. They come with headlines, urgency, and lots of confident pundits.
✅ Stick to the chart
Price told us today’s story long before CNBC tried to.
5400 rejection. No pulse bar. Bullish exhaustion on ADD.
That's not confusion. That's confirmation — if you're paying attention.
---
Rumour Has It…
Trump was overheard saying, “Maybe Powell’s alright. Maybe.” Dow gained 0.3% and then shrugged.
5400 is reportedly suing for emotional damages after being rejected for the third time this month.
A Wolfe Wave ghost briefly appeared on the chart, waved, and vanished near 5300.
(This section is entirely made-up satire. Probably.)
---
Fun Fact - News Always Arrives After Price
Markets don’t wait for clarity.
They move first, then the headlines scramble to explain why.
The pattern is timeless:
Price shifts.
Smart traders react.
Media catches up.
Retail says, “Oh, THAT’S why.”
Yesterday was no exception.
So if the news says “flat and uncertain,” but the chart shows a failed breakout, don’t wait for a CNBC blessing to press the button.
The system already said what it needed to say.

$PLTR Trade: Buy $90.86 , Target $101.35Beep Beep. Hope everyone is taking care of their trading accounts during this volatile phase in the markets. I noticed an identical setup on the weekly from back in August 24' and I'm looking to take advantage. We have a trend reversal on the Tom Demark sequential that helps identify trend exhaustion through a 9 Count. Currently on a 2 Count, we're testing the gap while simultaneously testing the 10WMA at 90.86.There is also a weekly gap at 101.35 ... Entry would be the 10WMA. Target the weekly Gap. Trade is as follows:
Trade Idea - Swing NASDAQ:PLTR $95 Calls 4/25
Entry - 10 WMA @ $90.86
Target - Gap on Weekly at $101.35

April 23 Trade Journal & Stock Market Analysis April 23 Trade Journal & Stock Market Analysis
EOD accountability report: +2325 on Eval, didn't trade funded
Sleep: 10 hour, Overall health: :check:
— 9:00 AM Market Structure flipped bullish on VX Algo X3!
— 11:30 AM Market Structure flipped bearish on VX Algo X3!
— 12:30 PM VXAlgo ES X1 Buy signal (triple buy signal) B+ set up
— 1:33 PM VXAlgo YM X1 Sell Signal (triple sell signal) B+ set up
— 1:55 PM Market Structure flipped bullish on VX Algo X3!
— 2:30 PM Market Structure flipped bearish on VX Algo X3!
— 3:31 PM VXAlgo ES X1 Buy signal (double signal)
Next day plan--> Short 48m MOB
Video Recap -->

Nightly $SPY / $SPX Scenarios for April 24, 2025🔮 Nightly AMEX:SPY / SP:SPX Scenarios for April 24, 2025 🔮
🌍 Market-Moving News 🌍
🇪🇺 European Banks Brace for Tariff Impact: European banks are facing a challenging outlook as U.S. tariff hikes raise recession fears. Analysts anticipate slower revenue growth and increased loan loss provisions, with institutions like BNP Paribas expected to report earnings reflecting these pressures.
✈️ Airline Industry Faces Booking Declines: European airlines report a 3% drop in planned summer trips, with leisure travel down 8% compared to 2024. Economic concerns and rising travel costs, particularly among Gen Z travelers, are contributing factors. Airlines like Ryanair and Air France-KLM are considering fare adjustments to maintain demand.
👗 Kering's Revenue Drops Amid Gucci Struggles: Luxury group Kering reported a 14% decline in Q1 revenue, with flagship brand Gucci experiencing a 25% drop. The company attributes the downturn to ongoing brand challenges and macroeconomic factors affecting consumer spending in key markets.
📊 Key Data Releases 📊
📅 Thursday, April 24:
📦 Durable Goods Orders (8:30 AM ET):
Forecast: +2.1%
Previous: +0.9%
Measures new orders for manufactured durable goods, indicating manufacturing sector health.
📈 Initial Jobless Claims (8:30 AM ET):
Forecast: 222,000
Previous: 215,000
Reflects the number of individuals filing for unemployment benefits for the first time, signaling labor market trends.
🏠 Existing Home Sales (10:00 AM ET):
Forecast: 4.14 million
Previous: 4.26 million
Indicates the annualized number of existing residential buildings sold, providing insight into housing market conditions.
⚠️ Disclaimer: This information is for educational and informational purposes only and should not be construed as financial advice. Always consult a licensed financial advisor before making investment decisions.
📌 #trading #stockmarket #economy #news #trendtao #charting #technicalanalysis

A Broader Market Review...As we have all seen within the last month or so, the U.S. equity markets have been getting the worst ass whooping since 2020. And as much as we'd like to forget that absolute disaster, it does bring to thought the idea of buying general market funds (such as AMEX:SPY , NASDAQ:QQQ , or AMEX:DIA ) to gain a nice entry into the next bull market, whenever that may be. However, not everything is all smooth sailing. The unfortunate part of this market downturn is that no amount of technical astrology fortune-telling analysis could have predicted the market's reaction to the tariffs being levied on foreign nations. So we need to put our big-boy pants on and look at the market as if it isn't some automatic wealth generating pattern that points north-east all day long.
Let's start with the tariffs. Firstly, we know there has been a 90 day pause on all conforming countries most notably leaving out China. It's not like that's anything special, just almost all our crap is made there. Unfortunately, we are observing what may be the greatest economic error of our lifetimes.
For those who are lost, foreign governments DO NOT pay for the tariffs in the way we are told. The U.S. Government levies the tariffs on the exporter (Chinese companies in this case), who then pass it on to the buyer of the goods (think Walmart, Target, Apple, etc.), who then pass those charges onto YOU... Enjoy!
So with an attempt at a full blown trade war, which the U.S. cannot win nor even has the industrial strength or infrastructure to compete, we can expect the markets to completely do a Bald Eagle courtship nosedive into new lows as observed a few weeks ago. But what will the Creature from Jekyll Island think of this?
Well miraculously, Fed chairman Jerome Powell claimed that the Fed will NOT allow the tariffs to exacerbate inflation into new highs. Get that, the Federal Reserve will not allow economic movements that raise prices on an importing nation ( that's the United States by the way), to raise prices anymore. While he's at it, how about we just get no inflation ever since it's just that simple?
And as if that wasn't enough, Donald Trump called for Jerome Powell to lower rates for some reason, saying that Powell was too late on his economic movement at the Fed. As it turns out, our plan for strengthening the economy is to.... weaken the dollar? Not sure why that's the case but at least we will be able to borrow more money at a cheaper price, as if the United States doesn't already have a debt problem. The Fed lowering rates would of course open the possibility of getting yet another wave of quantitative easing which will most likely be observed further down the road. Another round of QE, along with rate cuts, will of course send the equity markets to new highs on top of a weaker dollar.
Speaking of a weaker dollar, we should lastly talk about the TVC:DXY which measures the comparative strength of the U.S. Dollar to other currencies. As it turns out in this scenario, the dollar is getting weaker and weaker every day, meaning that people are running from U.S. Debt like it's the plague. If we were going to get a weaker dollar, at least could we have a higher market to offset our inevitable losses? I guess not...
Here is the TVC:DXY 1D looking back into late 2024.
Lastly for what to expect out of the market. If the trade situation will all the tariffs and this neo-cold war cool down, we might see some tariff pauses or lowering which will of course fire the market into new highs. However, if the situation doesn't cool, our debt yields rise, the market is going to go south faster than a Canadian in December. On a positive note, macroeconomic events move slowly, so it should be clear when a turnaround is coming...

Tariff Talks Flip the Tape - 5400 Under FireWolfe Gasping, Bulls Grinning
Well, this is exactly what every bear didn’t want to wake up to…
Overnight, markets surged higher after Trump hinted at easing tariffs and gave Powell a thumbs-up. It’s like watching your opponent trip mid-game, then suddenly recover, score a hat trick, and throw you a smug grin.
That line in the sand we’ve been talking about?
5400.
It’s been the invalidation level for weeks – and now it’s being bulldozed like it never mattered.
This isn’t about guessing the news.
It’s about having a clear point where your bias says, “Okay, I’m out.”
The Wolfe was working… until it wasn’t.
And that’s okay.
Because while the bear swing has been fantastic, we’re now seeing what might be the higher low reversal we flagged a few weeks ago - just without the drop to 5000 first.
Frustrating? A little.
Unexpected? Not really.
Tradable? Absolutely.
Let’s look at how this flips our setup for today.
---
SPX Market View - Bull Bias Activated (Finally)
Well, that escalated quickly.
With the overnight futures surge and 5400 now breached, the Wolfe Wave is officially off the board. Our long-standing bear bias has been invalidated — and we flip bullish for the first time in weeks.
This is the power of having a system.
You don’t need to guess. You just need a line in the sand. Ours was 5400. Price crossed it. The bias flips.
Here’s what I’m watching now:
5400 is now the breakout zone – if it holds at the cash open, bulls have full control
Higher low structure playing out across the daily chart
GEX positioning will be key — I’ll be watching for hedging demand shifts to confirm upside stability
This doesn’t mean we go all-in bull mode with blind optimism.
It means we assess new setups in line with the price action, and if they confirm – we act.
Bull’s got the ball (for now).
Let’s see if he fumbles or scores.
GEX Analysis Update
5300 acting as the updated flip point overnight
SPX prices potentially gaping 100+ points assuming the futures hold their gains.
---
Expert Insights: Know Your Invalidation
❌ Clinging to a bias too long
It’s tempting to hold on to the story. “Wolfe’s still in play,” you tell yourself… even after price says otherwise.
✅ Know your invalidation level
5400 was the line. It’s been clear for weeks. Once price punched through it — the plan said, “That’s it. Game over for the bear.”
No ego. No hoping. No rewriting the script mid-trade.
Your system needs boundaries.
Otherwise, it’s not a system — it’s a story.
---
Rumour Has It…
Trump’s tweet this morning: “Tariffs are dumb. Powell’s alright. Markets UP!” Dow gained 200 in 10 seconds.
CNBC now referring to 5400 as “The Enlightenment Zone.”
The Wolfe Wave was last seen howling into the wind and fading into the distance.
(This section is entirely made-up satire. Probably.)
---
Fun Fact - The 5400 Flip
Here’s a kicker for you…
5400 has flipped bias more times than any other round number level in the SPX this year.
It's the psychological equivalent of a market mood swing.
And every time price hits it, traders start reaching for different narratives:
“It’s resistance.”
“Now it’s support.”
“No wait, it’s just a number.”
“Actually, it’s Fibonacci-magnet-retrograde!”
Sometimes it’s just this:
5400 = The Line Where We Flip.
Meme of the Day - “Wolfe’s Out. Bull’s In.”
IMAGES ON MAIN BLOG
Happy trading,
Phil
Less Brain, More Gain
…and may your trades be smoother than a cashmere codpiece

S&P500 Long and painful but necessary bottom formation.The S&P500 index (SPX) has been trading within a 2-year Bullish Megaphone pattern and the recent 2-month correction completed its latest Bearish Leg, as it reached the Higher Lows trend-line.
The massive rebound that took place there on April 07 may have turned out to be a highly volatile one but as mentioned on the title, it might be long and painful, but a necessary process nonetheless. That's mainly because it is the strongest correction since 2022 and the longest Bearish Leg of the pattern.
The market remains highly volatile until it gets a clear signal, bearish below the current Support of the 1W MA200 (red trend-line) or bullish above the 1D MA50 (blue trend-line). Despite the rather short-term uncertainty, the similarities with the Megaphone's previous bottom are uncanny, both having formed their Low on 1D RSI Double Bottom patterns.
Given that this previous Low initiated a massive +50% 1 year Bullish Leg/ rally, we expect to see at least 7100 on this next one by mid-2026.
-------------------------------------------------------------------------------
** Please LIKE 👍, FOLLOW ✅, SHARE 🙌 and COMMENT ✍ if you enjoy this idea! Also share your ideas and charts in the comments section below! This is best way to keep it relevant, support us, keep the content here free and allow the idea to reach as many people as possible. **
-------------------------------------------------------------------------------
Disclosure: I am part of Trade Nation's Influencer program and receive a monthly fee for using their TradingView charts in my analysis.
💸💸💸💸💸💸
👇 👇 👇 👇 👇 👇

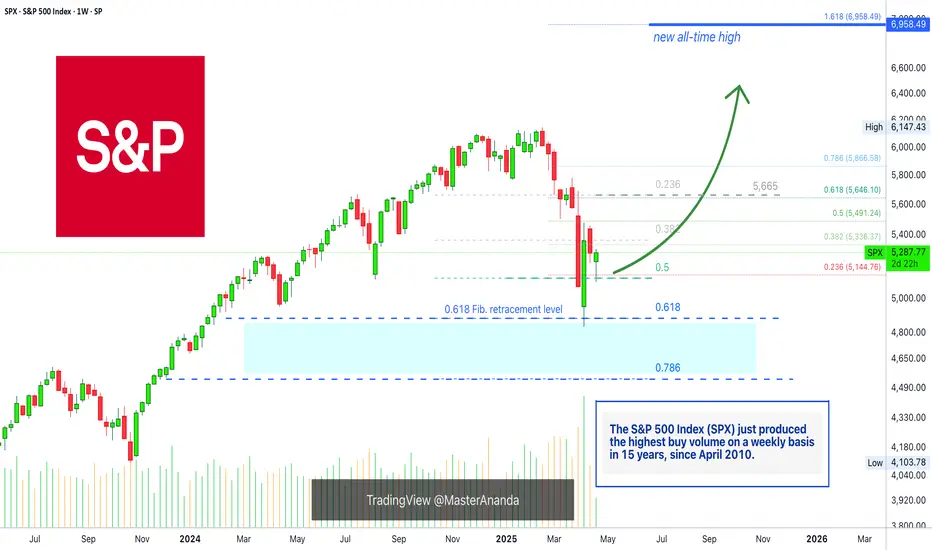
The SPX On Track To A New All-Time High In 2025 (6,958— Soon!)Do not let anybody distract you, do not allow yourself to be deceived. Know that the market is very resilient and this has been true for the longest time ever. The catastrophe that everybody is always expecting and is always due is never true. Ok, there was a correction, but that's it, from now on the market grows. That's just how it works.
Very, very strong bull markets, and the bear markets weak and short.
The S&P 500 Index (SPX) looks great right now and nothing can surpass the wisdom that comes from a chart. A chart cannot lie nor can mislead you in any way.
The charts have pure raw data, you can make your own interpretation of this data but there are no mistakes.
Here the chart shows a very strong higher low. The 0.5 Fib. retracement level was tested and it holds. Now, saying a "new All-Time High" might be speculation, but saying that prices will rise is simply how technical analysis works.
A low first pierced 0.5 and challenged 0.618 fib. The candle closed above and full green, the highest volume since 2010 and that is a clear signal that the correction reached its end.
The SPX is bullish now of course.
The next week we get a red week and this led to the present day, a higher low. A higher low is bullish and notice, the 0.618 level is no longer relevant. The correction that happened was really strong, there is absolutely no need for more.
So a strong correction developed and what comes next?
Prepare for a major rise, a new impulsive bullish wave.
The minimum target starts at 5,665. This is the resistance where the drop got started, this level needs to be tested based on TA. Depending on how this level is handled, we can extract how the market will continue to behave.
» I will make a prediction, the SPX will hit a new All-Time High in the coming months.
Thank you for reading.
Namaste.
April 22st Trade Journal & Stock Market Analysis** April 22st Trade Journal & Stock Market Analysis**
EOD accountability report: +325
Sleep: 3 hour, Overall health: tired
**Daily Trade Signals based on VX Algo System**
— 9:00 AM Market Structure flipped bullish on VX Algo X3!
10:20 AM VXAlgo NQ X1 Sell Signal
10:30 AM VXAlgo ES X1 Sell Signal
10:51 AM VXAlgo ES X1 Sell Signal
11:20 AMVXAlgo ES X1 Sell Signal (Triple signal) C+ set up
1:12 PM VXAlgo NQ X3 Sell Signal (Double X3 signal)
1:30 PM Market Structure flipped bearish on VX Algo X3!
3:00 PM Market Structure flipped bullish on VX Algo X3!
3:10 PM VXAlgo ES X1 Sell Signal (Triple signal) C+ set up

Smart investor strategyS&P 500: Percentage of Stocks Above the 20-Day Moving Average
This indicator shows the percentage of S&P 500 stocks trading above their 20-day moving average. It visually reflects short-term market strength or weakness and helps identify potential reversal points.
🔻 Sell / Open Shorts Zones:
Levels above 85–90% (marked in red) indicate an overheated market — when most stocks are trading above their short-term averages, a correction often follows.
🟢 Buy / Open Longs Zones:
Levels below 20–25% (marked in green) signal an oversold market — pressure is high, and the probability of a rebound increases.
Historically:
Each strong rally towards the 4500–4600 levels in the S&P 500 index was accompanied by overheated indicator values (85–90%).
Declines towards the 3500–3900 levels were marked by deep drops in the percentage of stocks above the 20 MA (below 20%).
Conclusion:
This indicator performs well within a sideways range and can serve as a leading signal for spotting local extremes. Currently, the reading has dropped below 15% — historically, this is a strong zone to look for long opportunities. I also showed the price of bitcoin at the moment in yellow.
Best regards EXCAVO
_____________________
Disclosure: I am part of Trade Nation's Influencer program and receive a monthly fee for using their TradingView charts in my analysis.

S&P 500: This Pattern Could EmergeThey say recession is imminent...
This is how it can emerge on the S&P 500 chart
in shape of Head & Shoulders
Its visual speculation, so let's leave it here and return in 2026-2032
to check if it played out

Spring Loaded Wedge? Let the setup come to you! $SPXLowkey top watch for the next few weeks!
It was a chop zone last week = consolidation? Now zooming out, it’s looking like a loaded wedge/flag forming. A lot of bearish sentiment, tariff talks and unknown lately but this is looking mighty interesting of a formation. Volume also slowly declining, wondering if we’re setting up for once a decision/mutual agreement is made with US, China + others involved.
Green ray is my ENTRY: 5372.44
*Also eyeing 5329.66*
- For potential upside. We have a few gams above to also fill and can magnet upwards if we get news, volume etc.
Looking for the banger* here - of course, things are still brewing. Note this is the HOURLY timeframe. Wait for the setup to come!
Let me know your thoughts! Appreciate any insight. Do your DD! #NFA AMEX:SPY SP:SPX

Nightly $SPY / $SPX Scenarios for April 22, 2025 🔮
🌍 Market-Moving News 🌍:
🚗 Tesla's Q1 Earnings on Watch: Tesla is set to report Q1 earnings after market close. Analysts expect EPS of $0.58 on $23.4B revenue. Investors are focused on delivery guidance, cost-cutting measures, and updates on the robotaxi program and Optimus robot. CEO Elon Musk faces pressure to refocus on Tesla amid concerns over his political engagements.
📉 Market Volatility Amid Tariff Concerns: U.S. markets remain volatile due to ongoing trade tensions. The S&P 500 has declined 14% from its February high, with investors closely monitoring corporate earnings for insights into the economic impact of recent tariffs.
📊 Key Data Releases 📊
📅 Tuesday, April 22:
🏠 Existing Home Sales (10:00 AM ET):
Forecast: 4.20 million
Previous: 4.38 million
Provides insight into the housing market's health and consumer demand.
📘 IMF Global Financial Stability Report (10:15 AM ET):
The IMF will release its latest assessment of global financial markets, focusing on systemic risks and financial stability.
⚠️ Disclaimer: This information is for educational and informational purposes only and should not be construed as financial advice. Always consult a licensed financial advisor before making investment decisions.
📌 #trading #stockmarket #economy #news #trendtao #charting #technicalanalysis

SPY repeat of ladle patternJust presenting what I see. Prices likely to be pulled back up to the LVN looking at good buy volume at close. However the days volume wasn't great because of the Europe holiday
Holidays ar common for whipsaw prices. With european markets open today, I wont be surprised if the market head back up for a day or two watch out for the resistance line
Safe trading

Noise, S&P Scenario, Gold BubbleThank you to the tradingview community for engaging and supporting my content.
After another rough start to the week, we have a bit of a crossroads ahead for the S&P
1) We revisit the April 7 lows and poke lower with bear trap opportunities
2) We hold Monday April 21 lows and grind back up to gap fill and revisit 5400-5500 resistance
3) We go nowhere with a lot of intraday volatility and noise (between the April 7 low and the April 9 high)
The markets are on high alert
DXY
Gold
Bitcoin
US Bonds vs Treasuries (yields rising)
Trump is more vocal about threatening the FED or firing Powell and the concern is truly unprecedented
Trade War pause is still ongoing, China is being vocal as well to make sure countries don't simply line up to support the US. For all of this to calm down, US and China have to play nice. China is likely able to hold the line longer than the US in the near-term
Thanks for watching!!!

Global Supply Chains being Undone could be the cause of a (IV)I have been discussing the potential for a Super-Cycle wave (III) top in the US markets for the last couple years. To experience a wave (IV) of SUPERCYCLE PREPORTION, would be a consolidation of price action back to the 1929 stock market crash. The byproduct of this type of price action would be a decline of 50% or more (likely more) in the value of global stock markets. This type of asset price deflation would make anyone who watches the markets be inquisitive as to what would or even COULD cause such an event.
Would the dismantling of global supply chains, that have been in place since the early 1990’s, be the culprit?
I am starting to think the answer to that question is yes. This is not an indictment of the policy, but more an acknowledgement of the disruption and the possible aftermath.
The obvious concern is how do businesses plan? I would venture a guess business leaders will be challenged, and many may not survive. The cost equation becomes so skewed…how does one make money without passing the costs on to the consumer? That means higher inflation.
If this is the case, it’s possible digital assets become more of a safe haven which would be counter intuitive to hard asset value. This would mean that we will have endure a cycle of higher inflation, higher interest rates, and higher unemployment, coupled with lower economic growth. I cannot say this is how the forecasted price action is justified in the future. What I can say is the resulting price action will look very similar to the below.

S&P500 - The Correction Is Over Now!S&P500 ( TVC:SPX ) is retesting massive support:
Click chart above to see the detailed analysis👆🏻
Over the past couple of days, we have been seeing a quite harsh stock market "crash" with an overall correction of about -20%. However, as we are speaking the S&P500 is already retesting a major confluence of support and if we see bullish confirmation, this drop might be over soon.
Levels to watch: $4.900
Keep your long term vision,
Philip (BasicTrading)

Tears of Liberty. Lets Make America Sell Again.Over the past decade, the U.S. stock market has significantly outperformed global stock markets excluding the United States. This divergence in returns has been one of the defining features of global investing since 2015, with U.S. equities—especially large-cap technology stocks—driving much of the outperformance.
Annualized Returns (2015–2025)
AMEX:SPY , S&P 500 Index(U.S.):
The S&P 500 delivered an average annualized return of 13.8% over the past ten years.
NASDAQ:ACWX , MSCI All World ex U.S. (Rest of World):
Global stocks outside the U.S. returned an average of 4.9% annually over the same period
Year-by-Year Breakdown
Year | SPX | World ex U.S. | U.S. Surplus
2024 23.9% 4.7% +19.2%
2023 23.8% 17.9% +5.8%
2022 -19.6% -14.3% -5.4% (!)
2021 26.6% 12.6% +14.0%
2020 15.8% 7.6% +8.2%
2019 30.4% 22.5% +7.9%
2018 -6.6% -14.1% +7.5%
2017 18.7% 24.2% -5.5% (!)
2016 9.8% 2.7% +7.1%
2015 -0.7% -3.0% +2.3%
Key Drivers of Performance
U.S. Outperformance
The U.S. market’s dominance was driven largely by the rapid growth of technology giants (such as Apple, Microsoft, Amazon, and Alphabet), which benefited from strong earnings growth, global market reach, and significant investor inflows.
International Underperformance
Non-U.S. markets faced headwinds such as multiply choking sanctions and tariffs, slower economic growth, political uncertainty (notably in Europe), a stronger U.S. dollar, and less exposure to high-growth technology sectors.
Valuation Gap
By 2025, U.S. stocks are considered relatively expensive compared to their international counterparts, which may offer more attractive valuations going forward.
Recent Shifts (2025 Trend):
As of early 2025, international stocks have started to outperform the S&P 500, with European and Asian equities seeing renewed investor interest. Factors include optimism over economic recovery in China and strong performance in European defense and technology sectors.
Long-Term Perspective
Historical Context
While the past decade favored U.S. equities, this has not always been the case. For example, during the 2000s, international stocks outperformed the U.S. following the dot-com bust.
Market Weight
The U.S. accounts for roughly 60% of global stock market capitalization and about 25% of global GDP, so its performance has a substantial impact on global indices.
Conclusion
From 2015 to 2025, the U.S. stock market delivered nearly triple the annualized returns of global markets excluding the U.S., primarily due to the outperformance of large-cap technology stocks.
While this trend has persisted for most of the decade, early 2025 shows signs of a potential shift, with international equities beginning to close the performance gap. Investors should remain aware of valuation differences and the cyclical nature of global market leadership.
The main technical chart for U.S./ ex U.S. ratio indicates the epic reversal is in progress.

April 21st Trade Journal & Stock Market Analysis**April 21st Trade Journal & Stock Market Analysis**
EOD accountability report: +9335.75
Sleep: 8 hour, Overall health: tired
**Daily Trade Signals based on VX Algo System**
9:37 AM Market Structure flipped bearish on VX Algo X3
12:01 PM VXAlgo ES X1 Buy signal,
2:16 PM VXAlgo ES X1 Buy signal (double signal)
3:05 PM VXAlgo NQ X3 Buy Signal
3:31 PM Market Structure flipped bullish on VX Algo X3!

S&P500: Bottomed on an Inverse Head and Shoulders.The S&P500 index is bearish on its 1D technical outlook (RSI = 36.973, MACD = -126.240, ADX = 31.007) but long term appears to have bottomed on an Inverse Head and Shoulders pattern. In fact, the Head made a low on the Double Bottom and the bearish outlook is currently due to the Right Shoulder formation. A crossing over the dashed LH trendline and even better the 4H MA200, would aim for the 2.0 Fibonacci extension (TP = 6,280).
## If you like our free content follow our profile to get more daily ideas. ##
## Comments and likes are greatly appreciated. ##

Solid Q1 Earnings amid Tariff Turbulence Spike S&P500 VolatilityAs Q1 earnings roll in, Wall Street is digesting a rare divergence: strong fundamentals across much of corporate America paired with deepening investor anxiety. While companies are largely beating expectations, looming tariff shocks and tech sector fragility are suppressing sentiment—and returns.
Tactical positioning is crucial at times like this. This paper describes the outlook for the coming earnings season and posits options strategies that astute portfolio managers can deploy to generate solid yield with fixed downside.
Resilient Earnings Growth in the Current Season
The Q1 2025 earnings season is underway, and early results show resilient growth despite an unsettled backdrop. According to a Factset report , with about 12% of S&P 500 firms reporting so far, 71% have beaten earnings estimates and 61% have topped revenue forecasts.
Blended earnings are tracking about +7.2% year-over-year, on pace for a seventh-straight quarter of growth. However, only two sectors have seen improved earnings outlook since the quarter began (led by Financials), while most others have faced modest downgrades.
Forward guidance is also skewing cautious – roughly 59% of S&P companies issuing full-year EPS forecasts have guided below prior consensus, reflecting corporate wariness amid macro uncertainty.
Source: Factset as of 17/April
Financials Front-Load the Upside
The first wave of reports was dominated by major banks, which largely delivered strong profits and upside surprises. Volatile markets proved a boon to trading desks: JPMorgan’s equities trading revenue surged 48% to a record $3.8 billion, and Bank of America’s stock traders hauled in a record $2.2 billion as clients repositioned portfolios around tariff news.
Source: Factset as of 17/April
These tailwinds – along with still-solid net interest income – helped lenders like JPMorgan and Citigroup post double-digit profit growth (JPM’s Q1 earnings up 9% to $5.07/share; Citi’s up 21% to $1.96). FactSet notes that positive surprises from JPMorgan, Goldman Sachs, Morgan Stanley and peers have boosted the Financials sector’s blended earnings growth rate to 6.1% (from 2.6% as of March 31), making it a key contributor to the S&P 500’s overall gains.
Even so, bank executives struck a wary tone. JPMorgan’s CEO Jamie Dimon cautioned that “considerable turbulence” from geopolitics and trade tensions is weighing on client sentiment. Wells Fargo likewise warned that U.S. tariffs could slow the economy and trimmed its full-year net interest income outlook to the low end of its range. Across Wall Street, management teams indicated they are shoring up reserves and bracing for potential credit headwinds if import levies drive up inflation or dent growth.
Tech Titans Under Scrutiny
Attention now turns to the yet-to-report mega-cap tech firms, which face a very different set of challenges. Stocks like Apple, Amazon, Microsoft, and Alphabet – collectively heavyweights in the index – have been battered by the escalating trade war, eroding some of their premium valuations.
Apple’s share price plunged over 20% in early April on fears that new tariffs could jack up the cost of an iPhone to nearly $2,300, underscoring these companies’ exposure to global supply chains.
The tech sector’s forward P/E remains about 23 (well above the market’s 19), leaving little room for error if earnings guidance disappoints. With Washington’s tariff barrage and retaliatory threats casting a long shadow, Big Tech finds itself on the front line of the global trade war, suddenly vulnerable on multiple fronts. Any cautious outlook from these giants – which account for an outsized share of S&P 500 profits – could heavily sway overall forward earnings sentiment.
Market Context and Reaction
Despite solid Q1 fundamentals, equity markets have been whipsawed by macro headlines. The S&P 500 slid into correction territory, falling roughly 10% since the start of April and about 14% below its February peak, as investors de-rated stocks in anticipation of tariff fallout and a potential economic slowdown. Consumer inflation expectations have skyrocketed with risk delaying rate cuts in the near-term.
This pullback has tempered valuations somewhat – the index’s forward P/E has eased to ~19 (down from ~20 at quarter-end) – even though consensus earnings estimate for 2025 have only inched down. Notably, the high-flying “Magnificent Seven” mega-cap stocks that led last year’s rally are all sharply lower year-to-date (Alphabet –20%, Tesla –40%), a stark reversal that has dented market breadth and sentiment.
Source: Factset as of 17/April
Investors are rewarding only the strong earnings winners: for instance, Bank of America’s stock jumped over 4% after its earnings beat, and JPMorgan rose 3% on its results. Such reactions imply the market is discriminating – strong execution is being acknowledged even as the broader mood remains cautious.
Source: Factset as of 17/April
Hypothetical Trade Setup
Solid corporate performance is offset by significant macro risks, warranting a nimble and selective approach. While recent positive earnings may provide a short-term boost, downbeat sentiment and concerns over future tech earnings could limit gains.
In this uncertain environment, investors may adopt a fundamentally driven view that the S&P 500 could rise in the near term due to strong earnings. However, the upside appears limited, supporting the case for a bullish call spread.
Earnings release dates for the Super 7
With major tech firms set to report earnings in early May, investors can consider the 2nd May MES Friday weekly options. A narrow bull call spread offers a higher probability of profitability. In this hypothetical setup, the long call is at 5,250 and the short call at 5,390, resulting in a breakeven point of 5,312 at expiry. This position requires net premium of USD 315/contract (USD 62.5/index point x 5). The position returns a max profit of USD 385/contract for all strikes > 5,390 and a max loss of USD 315/contract for all strikes < 5,250.
This strategy is most successful when the S&P 500 rises slowly. A simulation of this scenario using the CME QuikStrike Strategy Simulator has been provided below.
MARKET DATA
CME Real-time Market Data helps identify trading set-ups and express market views better. If you have futures in your trading portfolio, you can check out on CME Group data plans available that suit your trading needs tradingview.com/cme .
DISCLAIMER
This case study is for educational purposes only and does not constitute investment recommendations or advice. Nor are they used to promote any specific products, or services.
Trading or investment ideas cited here are for illustration only, as an integral part of a case study to demonstrate the fundamental concepts in risk management or trading under the market scenarios being discussed. Please read the FULL DISCLAIMER the link to which is provided in our profile description.

Post-Easter Drift: Markets Hit the Snooze ButtonMonday will be the first proper day back in the saddle after a long Easter weekend.
The chocolate coma has almost worn off. Markets will be waking up. Kind of.
These post-holiday opens are notoriously sluggish. Volume’s light. Direction takes a while to reveal itself. And everyone’s pretending to care about macro while waiting for real price action to show up.
But we’ve already got our map.
And the Wolfe Wave that paid us last week? Still unfolding.
I’m sitting tight with a fresh cup of caffeine, watching the 5400 level as our bull/bear toggle… and waiting to see if Trump rage-tweets another black swan into existence before the bell rings.
We’re not here to chase headlines.
We follow the system that pays.
--
SPX analysis 22 April 2025
The Wolfe Wave setup we traded last week hasn’t invalidated and still has room to run. The projected target near 5000 remains in play, and we’re well within the structure for a continued grind lower.
The swing income trade is live. And because this is options – not directional heroism – we don’t need the full drop to get paid. But a fast tag of 5000 will certainly do us a favour on timing.
On the GEX front, things remain bearish:
5400 = resistance + gamma flip level
5250 = highest negative gamma magnet this week
No bullish flips yet, and no major hedging pressure being relieved
That leaves our plan unchanged:
Bear bias holds under 5400
Swings remain on
Be ready to reassess if we bounce or overshoot key levels
Business as usual. Let price confirm. Let the system trigger.
Patience to profits.
---
Expert Insights: (Trading Mindset for Today)
The strategy is simple:
Wait for the setup. Place the trade. Walk away.
The temptation today will be to force something just because it’s the first day back.
Don’t. You’re not paid to predict. You’re paid to follow the rules.
A calm trader with a plan outperforms a hyper trader with opinions.
Common Trading Mistake & How to Avoid It
❌ Confusing movement with opportunity
Just because the market opens doesn’t mean it’s ready to trade.
✅ Let the setup come to you
Rule-based trading means you wait for confirmation – not caffeine.
Fun Market Fact – When Gamma Gets Negative…
Did you know that negative gamma magnifies market moves?
Here’s how it works:
Dealers hedge in the same direction as price
That creates more volatility, not less
Which means… wild swings are more likely when GEX is negative
This is why we’re watching 5250 this week – it’s where gamma says “this way, please” (and dealers cry quietly behind the screens).
---
Rumour Has It…
Trump’s latest tweet simply read: “ SP:SPX = Sad. Bears win.” Futures dipped 0.3% before recovering.
5400 is now being described as “psychological resistance” – which means nobody has a clue but it sounds clever.
GEX models reportedly enrolled in therapy after being ignored all weekend.
(This section is entirely made-up satire. Probably.)

SPX: hard way upThe S&P 500 index tried very hard to sustain a bit of market optimism, however, it ended the trading week at almost the same level, where it started it. Monday was a positive day, where the index managed to open higher from Friday's close, reaching 5.450, however, through the rest of the week, it was traded with a negative sentiment. Thursday closed at the level of 5.282. Friday was a non-working day on Western markets, due to the Easter holiday. It will be closed also on Monday, which might be treated as a positive, considering current sentiment.
Regardless of a drop in the value of the index, the stocks were traded in a mixed manner. Market favourite Nvidia gained almost 3%, supported by its business plan for the next period, increasing their projections for exports to China. This was positive, considering the uncertainties related to trade tariffs between the US and China. Elly-Lilly, a drug maker, gained almost 14%, after posting positive results on a trial of its weight-loss drug.
Generally, US companies continue to provide relatively positive results, considering the ongoing uncertainties related to trade tariffs. The another topic which is bringing uncertainty in investors is a pressure from the US Administration on Fed to cut interest rates. Fed Chair Powell, noted during a speech that tariffs implemented by the US Administration could drive up inflation higher, which is certainly something that the market is not at all happy to hear at these sensitive moments. Increased inflation would imply that the Fed will not be in the position to cut interest rates, as planned, during the course of this year. So, regardless of positive results that US companies are still managing to post, still, the inflation fears are the most critical moment for investors, which continues to drive their sentiment for investments.
