US500 Actionable Long Bullish 5 stack fundamental 6 stacks TechCMCMARKETS:SPX500Z2025
Fundamental: Bullish (5 stacks).
Technical: Bullish (6 stacks, Actionable 6+).
20-word summary: Earnings resilience and easing expectations support bids. EMAs aligned, RSI constructive. Dips bought while above 6675; trend continuation favored highs.
Trade plan (LONG): SL 107.768, TP 280.1968 (ATR method).
All stars align however stay sharp, stay nimble as tariffs loom.
S&P 500 (SPX500)

ORACALE (ORCL) Rally! Cycle 3 → $400, Eyes on Supercycle $6,000🌀 ORACLE (ORCL) – Elliott Wave Supercycle Analysis | Smart Money & Fibonacci Confluence
🔭 Macro Perspective
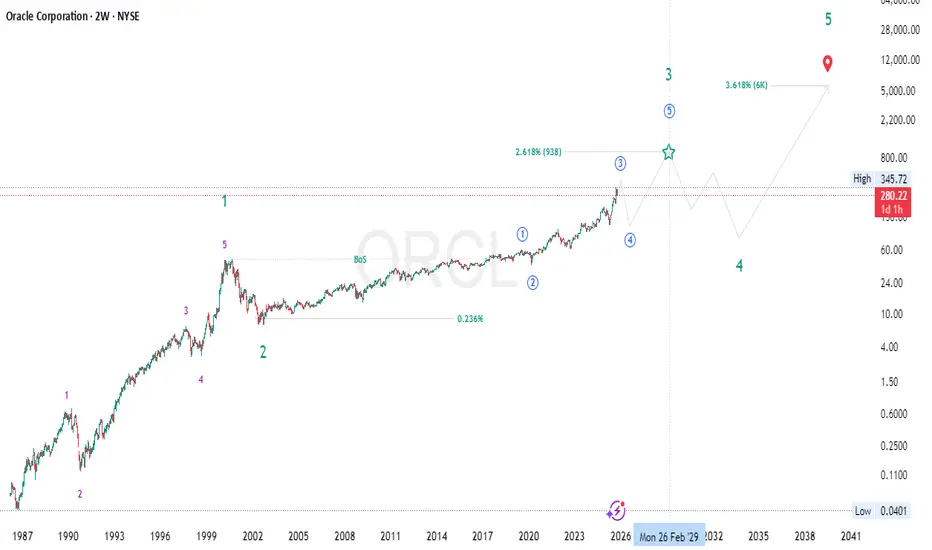
Oracle’s long-term chart (NYSE: ORCL) showcases a powerful Supercycle (III) wave in motion — a multi-decade expansion phase fueled by institutional participation, structural growth, and technological innovation.
The internal Cycle waves (1–5) are clearly defined, with current price action positioned deep within Cycle Wave (3) — the strongest segment of this major bullish leg.
🟢 Supercycle Wave (I) (1987 – 2000)
Elliott Behavior: The first grand impulsive advance, representing Oracle’s rise during the early software and database revolution.
Fibonacci Structure: Wave (3) extended toward the 2.618× of Wave (1), typical of an early institutional growth wave.
SMC Dynamics:
Breaks of structure (BoS) at each impulsive stage.
Liquidity sweeps before rallies — consistent smart money accumulation patterns.
Fundamentals: Explosive earnings growth through enterprise software adoption and global market expansion.
💥 Conclusion: The dot-com peak in 2000 completed Supercycle (I).
🔵 Supercycle Wave (II) (2000 – 2002)
Nature: The sharp, emotion-driven retracement following the tech bubble.
Fibonacci Retracement: Retraced into the 0.236 zone of (I), providing the long-term discount region for accumulation.
SMC Characteristics:
Liquidity grab beneath 1998–1999 structure.
Long accumulation base confirming institutional re-entry.
Fundamentals: Oracle streamlined operations and built the groundwork for enterprise-level solutions.
🧱 Bottom: Wave (II) ended around 2002 — the base of today’s decades-long uptrend.
🟣 Supercycle Wave (III) (2002 – 2030s, ongoing)
This ongoing macro impulsive wave contains five internal Cycle Waves (1–5) .
⚪ Cycle Wave (1) (2002 – 2019)
Elliott Context: A powerful, sustained impulsive leg lasting nearly two decades.
Structure: Clean five-wave advance with strong extensions during 2010–2019.
Fibonacci Note: The move achieved near the 1.618× extension relative to its starting point.
SMC Insight:
Consistent higher highs and higher lows throughout the period.
BoS continuation patterns confirming institutional markup.
Fundamentals: Expansion of Oracle’s business model — cloud transition, data analytics, and enterprise software dominance.
📈 End: Cycle (1) peaked near 2019 , completing the first internal impulsive leg of Supercycle (III).
🔵 Cycle Wave (2) (2019 – 2020)
Nature: A sharp yet shallow correction that coincided with the global market decline (COVID crash).
Fibonacci Retracement: Retraced around the 0.236–0.382 zone of Wave (1).
SMC Dynamics:
Liquidity sweep under 2018–2019 structure.
Fast accumulation pattern — strong re-accumulation footprint.
Fundamentals: Short-term market shock, but Oracle’s fundamentals remained intact and rebounded swiftly.
🧭 Conclusion: Cycle (2) ended in 2020, setting the foundation for the explosive ongoing Cycle (3) rally.
🟢 Cycle Wave (3) (2020 – ~2026, in progress)
Elliott Context: The most powerful internal impulsive wave — currently unfolding.
Target Zone: Projected to complete near $380–$400 , expected around late 2025 to early 2026 .
Fibonacci Extension: The 2.618× extension of Wave (1) perfectly aligns near $400.
SMC & Market Structure:
Continuous BoS and HH–HL formations — clear institutional control.
No macro distribution yet; structure remains intact.
Liquidity inducements near highs suggest ongoing markup phase.
Price Action: Aggressive impulses, shallow retracements, and orderly continuation patterns.
Fundamentals:
Rapid expansion in Cloud Infrastructure (OCI), AI-driven services, and recurring revenue models.
Sustained EPS growth and improved margin performance support wave maturity.
🚀 Expectation: Completion near $400 will likely trigger a Cycle (4) corrective structure before the final impulsive push.
🟠 Cycle Wave (4) (Projected: 2026 – 2028)
Elliott Behavior: A corrective phase — retracing part of the strong Cycle (3) run.
Fibonacci Retracement: Expected correction into the 0.236–0.382 zone of Wave (3), roughly $200–$280.
SMC Insight:
Break of structure (BoS) near top zones to induce liquidity.
Re-accumulation base forming after liquidity sweep below key supports.
Market Psychology: Cooling from euphoria, consolidation, and rebalancing of valuations.
Fundamentals: Period of stabilization after several years of aggressive expansion.
📉 Outlook: Likely forms the structural foundation for the next rally phase (Cycle 5).
🟢 Cycle Wave (5) (Projected: 2028 – early 2030s)
Elliott Context: The final impulsive leg completing Supercycle (III).
Target Zone: Fibonacci 3.618× extension (~$900–$950) of Cycle (1).
SMC Structure:
Final markup phase with strong BoS continuation patterns.
Climax rallies as retail sentiment peaks.
Price Action: Parabolic trend, thin retracements, and expanding volatility.
Fundamentals: Oracle could cement its dominance in global data, AI, and enterprise infrastructure markets.
💎 Completion: Cycle (5) will mark the end of Supercycle (III), leading into the long-term corrective Supercycle (IV).
🔶 Supercycle Wave (IV) (Projected: 2030s – 2040s)
Nature: Major macro correction after decades of expansion.
Fibonacci Depth: Likely retraces into the 0.382–0.5 zone of (III).
SMC Behavior: Distribution → liquidity sweep → re-accumulation.
Market Context: Could align with macroeconomic tightening or sectoral rotation.
📊 Purpose: To reset valuations and build energy for the final Supercycle (V).
🟩 Supercycle Wave (V) (Projected: 2040s – 2050s)
Elliott Context: The final impulsive wave of Oracle’s century-long trend.
Fibonacci Target: 3.618× expansion (~$6,000).
SMC Behavior: Final institutional markup followed by distribution and secular reversal.
Fundamentals: Could coincide with Oracle’s role as a global AI–data infrastructure leader.
🚀 Legacy Wave: The culmination of decades of innovation and expansion.
⚙️ Macro Summary
Accumulation (1980s–1990s) – Smart money foundation.
Expansion (2000s–2020s) – Institutional markup phase.
Distribution (2030s) – Macro correction and rotation.
Re-accumulation (Post-2040s) – Long-term reset for future cycles.
🧠 Technical & Fundamental Alignment
✨ Elliott Structure: Clear impulsive (I–V) sequence with macro rhythm.
✨ Fibonacci Confluence: $400 (2.618× of Wave 1) & $900 (3.618× of Wave 1).
✨ SMC: Institutional control with clean BoS → reaccumulation → continuation.
✨ Price Action: Aggressive bullish order flow with no macro distribution yet.
✨ Fundamentals: Oracle’s AI + Cloud strategy drives sustainable growth.
🌍 Conclusion
Oracle (ORCL) continues to trend within Supercycle (III) — the most powerful long-term wave.
Cycle Wave (3): In progress, targeting $380–$400 by end of 2025 / early 2026.
Cycle Wave (4): Anticipated retracement toward $200–$280 zone.
Cycle Wave (5): Final impulsive run toward $900+ into the early 2030s.
📈 Macro Bias: Long-term bullish — institutional structure intact.
📊 Short-term Outlook: Momentum strong but nearing Cycle 3 completion; prepare for corrective rotation.
💬 Summary: Oracle’s price evolution beautifully mirrors its technological growth story — a near-perfect alignment of Elliott Wave symmetry , Smart Money structure , and fundamental strength . The completion of Cycle 3 near $400 will open the door to an ideal re-entry opportunity for the next macro leg higher.
#ORCL 📈 #Oracle 💼 #ElliottWave 🌊 #WaveAnalysis 🔹 #Supercycle 🚀 #Fibonacci 📊 #SmartMoney 💎 #PriceAction 🕯️ #MarketStructure 🏗️ #LongTermBull 🟢 #StockAnalysis 💹 #TechnicalAnalysis ⚙️ #Investing 💰 #TradingViewIdeas 💡
💬 Respected traders and analysts!
Your insights matter. Share your views, confirmations, or constructive criticism in the comments below. Let’s discuss ORCL’s structural evolution, Elliott Wave setup, and long-term Supercycle potential 🚀📈.
— Team FIBCOS 💎
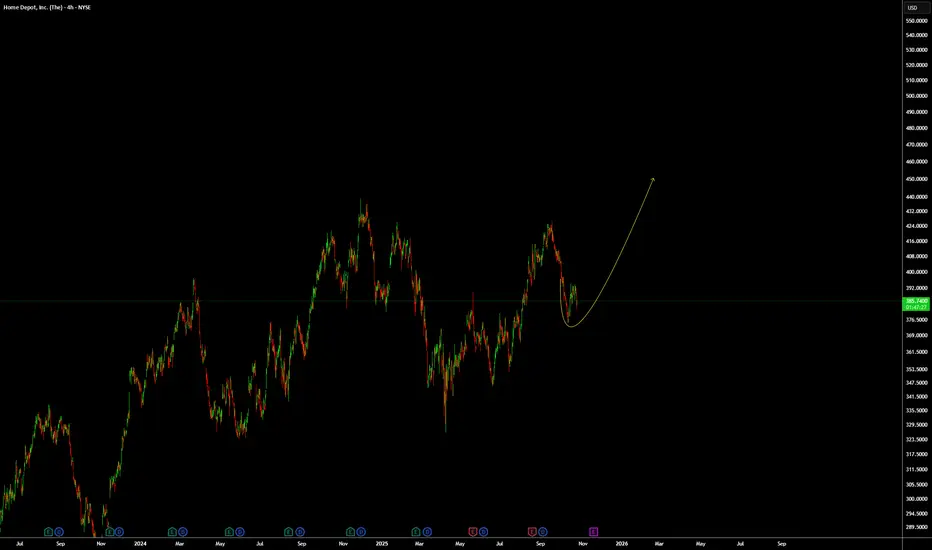
HD: If this is just a pullback, up again.For NYSE:HD (Home Depot) if this just a pullback, we will be going back up to break the top and reach 450 level.
Always remember WTW 4 Golder Rules:
1) Do not jump in
2) Do not over risk/trade
3) Do not trade without Stop Loss
4) Never ever add to a losing position!
Trade with care
We Trade Waves
WTW Team
Disclosure: We are part of Trade Nation's Influencer program and receive a monthly fee for using their TradingView charts in our analysis.
S&P500 expected to open on a cautious note- earnings in focusUS equities lost momentum yesterday, with the S&P 500 falling -0.53%, snapping a three-day winning streak as renewed US-China trade tensions, weak corporate earnings, and continued government shutdown worries weighed on sentiment.
Key Drivers:
Trade concerns dominated after reports that the Trump administration is considering export restrictions to China on products containing or developed with US software, in retaliation for China’s rare earth export limits. This escalation hit semiconductor and tech stocks, with the Philadelphia Semiconductor Index down -2.36%.
Later, more conciliatory comments from Trump—suggesting a deal with China was still possible—helped stem deeper losses but failed to lift markets meaningfully.
Oil prices were the exception, with Brent Crude rising above $64/bbl after the US imposed new sanctions on Russia’s largest oil producers, intensifying pressure on global energy markets.
Gold continued its slide, falling another -0.65%, following Wednesday’s sharp selloff.
Corporate News:
Tesla shares came under pressure after profits plunged despite record sales, as rising costs hit margins. CEO Elon Musk used the earnings call to defend his proposed $1 trillion pay package.
Broader earnings sentiment weakened amid several disappointing results, adding to the cautious tone.
Global Developments:
In Canada, Prime Minister Mark Carney announced a plan to diversify exports away from the US and attract skilled immigration, signaling shifting trade dynamics in North America.
Outlook for Today:
Markets are expected to open on a cautious note, with traders monitoring fresh earnings releases and US data for signs of resilience. The S&P 500’s near-term direction will likely hinge on whether confidence improves around trade and earnings, or if risk aversion continues to build into the weekend.
Key Support and Resistance Levels
Resistance Level 1: 6720
Resistance Level 2: 6755
Resistance Level 3: 6765
Support Level 1: 6645
Support Level 2: 6590
Support Level 3: 6560
This communication is for informational purposes only and should not be viewed as any form of recommendation as to a particular course of action or as investment advice. It is not intended as an offer or solicitation for the purchase or sale of any financial instrument or as an official confirmation of any transaction. Opinions, estimates and assumptions expressed herein are made as of the date of this communication and are subject to change without notice. This communication has been prepared based upon information, including market prices, data and other information, believed to be reliable; however, Trade Nation does not warrant its completeness or accuracy. All market prices and market data contained in or attached to this communication are indicative and subject to change without notice.

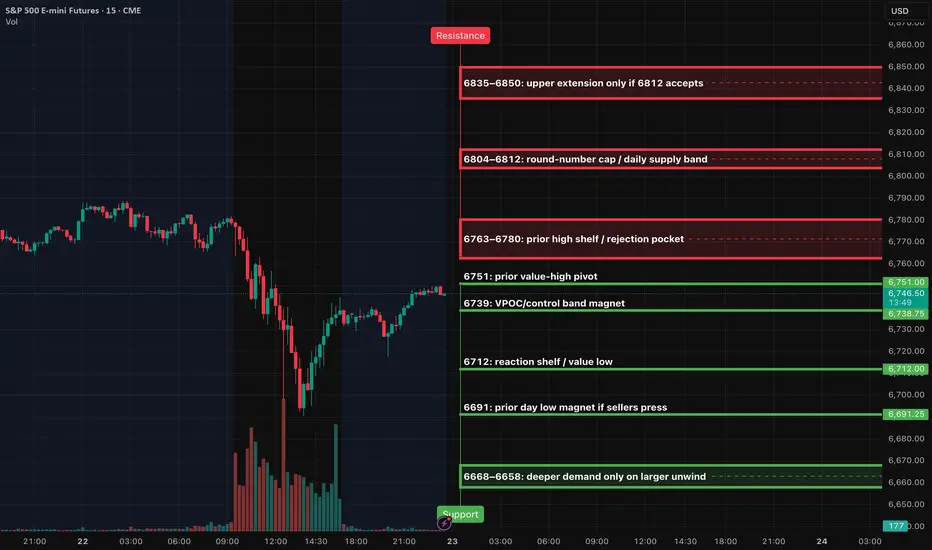
ES (SPX, SPY) Analysis, Key Levels, Setups for Thur (Oct 23)Bias: The market shows a neutral to slightly bullish outlook as long as prices remain above the 6739–6751 control band. A decisive break and sustained trading above 6780 would indicate a shift in momentum to the upside, targeting the levels of 6804 to 6812. Conversely, if we lose support at 6739, we could see a decline toward 6712, with 6691 serving as a key level that may attract selling pressure.
Execution windows: London 02:00–05:00 optional small size. NY AM 09:30–11:00 primary. NY PM 13:30–16:00 primary. Midday is manage-only; avoid initiating.
Setups
Short pop-and-fail at 6773–6780
– Trigger: 15m rejection back inside the band → 5m re-close below ~6773 → first 1m pullback stalls beneath 6773
– Entry: sell the pullback beneath 6773
– Stop: hard SL above the 15m rejection wick by 0.25–0.50
– Targets: TP1 6751, TP2 6739, TP3 6712
– Invalidation: 6780 converts to support on a full-body 15m close
Long breakout continuation above 6780
– Trigger: 15m full-body close beyond 6780 → 5m pullback holds 6777–6780 and re-closes up → 1m higher-low entry
– Entry: buy the hold at 6777–6780
– Stop: hard SL below the 15m trigger wick by 0.25–0.50
– Targets: TP1 6804, TP2 6812, TP3 6835–6850
Long sweep-and-reclaim at 6712 → 6691
– Trigger: quick sweep of 6712 (or flush toward 6691) that immediately reclaims 6712 on 5m → 1m higher-low entry
– Entry: buy first pullback after the reclaim of 6712
– Stop: hard SL below the 15m sweep wick by 0.25–0.50
– Targets: TP1 6739, TP2 6751, TP3 6773–6780
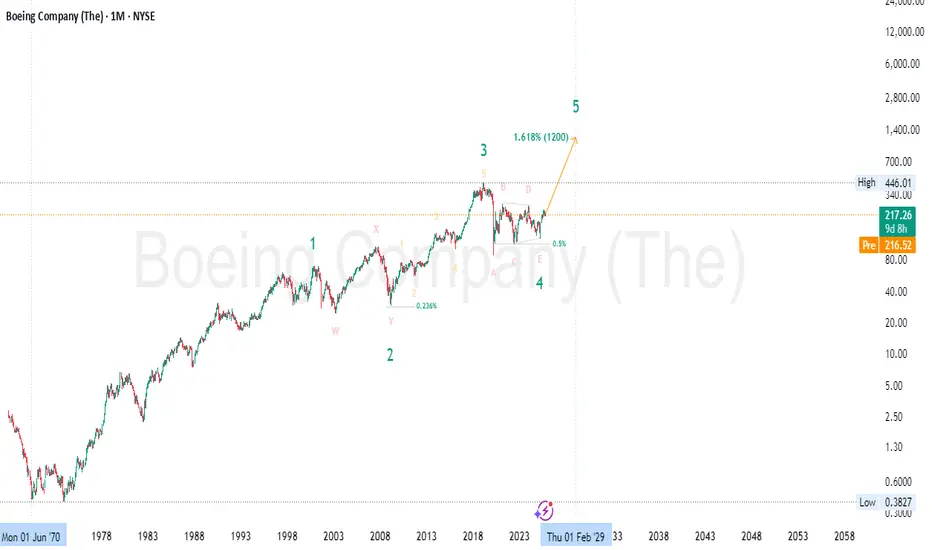
Boeing (BA) – Final Leg of Macro Bull Run✈️ Boeing (BA) – Final Leg of Macro Bull Run | Wave 5 to 1.618 Extension ($1200) 🚀
📅 Timeframe: Monthly (Macro Cycle Outlook)
📍 Current Price: $217
🎯 Wave 5 Target : ~$1200 (1.618 Extension)
🌀 Wave Theory Structure
Boeing appears to be entering Wave 5 of a long-term Elliott Wave cycle:
✅ Wave 1: Multi-decade rise until the early 2000s
✅ Wave 2: Complex correction (W–X–Y) into 2009 lows
✅ Wave 3: Powerful rally through 2019, completed with an extended 5-wave subdivision
✅ Wave 4: A large-scale triangle correction (ABCDE) — now completed, as price has broken structure upward
🚀 Wave 5: Projected move toward the 1.618 Fibonacci extension (~$1200) from the 1–3 wave distance
This is a textbook impulsive wave structure playing out on the monthly macro scale — with a final bullish leg now unfolding.
📐 Fibonacci Confluence
Wave 2 retraced ~0.236 of Wave 1 (shallow, bullish corrective behavior)
Wave 4 retraced ~0.5 of Wave 3 — typical for triangle patterns and expanded flats
Wave 5 target at 1.618 Fib extension measured from Wave 1–3 aligns around $1200 , completing the 5-wave macro cycle 🔺
🧠 Smart Money Concepts (SMC)
🔹 Accumulation Phase (2020–2024): After COVID crash and multi-year consolidation, price has shown strong accumulation characteristics
🔹 Final Sweep of Lows (E leg) flushed out late longs and retail stops before institutional re-entry
🔹 Break of Structure (BOS) confirms transition from reaccumulation to markup phase 📈
🔹 Price is now in a reprice phase — a classic SMC trait where value is rapidly adjusted after institutional positioning completes
📊 Price Action Analysis
Bullish breakout from triangle structure
Monthly higher low established at E-wave base
Strong bullish candle from demand zone — early confirmation of trend continuation
Break above $260 would open clean skies toward the next major resistance at ATH ($446) and beyond 🧭
💼 Fundamental Outlook
Boeing is regaining strength after multiple challenging years:
✈️ Rebound in global aviation demand
📦 Growing defense & aerospace contracts amid rising geopolitical tensions
💰 Expected recovery in cash flows, backlog, and profitability
🌐 Expansion in space and unmanned systems (future growth verticals)
Although regulatory and delivery risks remain, Boeing’s turnaround story is gathering steam — aligning with the technical forecast of Wave 5 acceleration.
🔍 Summary
Boeing is entering what could be the final and most explosive leg (Wave 5) of its macro Elliott Wave cycle. Key confluences include:
✅ Elliott Wave triangle completion
✅ Fibonacci 1.618 extension to ~$1200
✅ Institutional accumulation confirmed
✅ Price Action breakout from multi-year structure
✅ Improving long-term fundamentals
This setup favors long-term swing positions , with pullbacks offering buying opportunities until the final cycle target is approached. 🧠📈
⚠️ Disclaimer: This is not financial advice. For educational purposes only. Always do your own due diligence and manage risk responsibly. 🛡️
#Boeing #BA #ElliottWave #SmartMoney #PriceAction #Fibonacci #Wave5 #TriangleBreakout #TechnicalAnalysis #LongTermInvestment #MacroTrading #StockMarket #BullishOutlook #Aerospace #WaveTheory #SwingTrading #AviationRecovery #FibonacciTargets #TradingStrategy
ES (SPX, SPY) Analysis, Key Levels, Setups for Wed (Oct 22)Key catalysts and schedule (ET): The federal shutdown continues, pausing most government statistics. There is no 8:30am tier-1 macro release expected. The energy markets will receive the EIA Weekly Petroleum Status Report at 10:30am. Of particular note, the Fed’s Michael Barr is scheduled to speak during the U.S. day, a potential market-moving event. Earnings reports from AT&T, Thermo Fisher, Boston Scientific, and Vertiv before the open, and IBM after the close, could also sway the index mood.
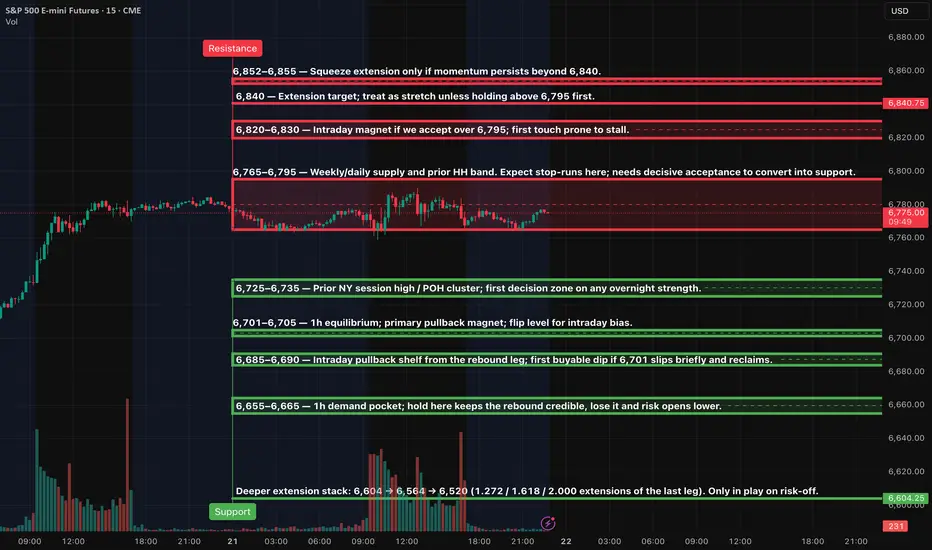
Key zones — resistance: The 6,765–6,795 zone, serving as the weekly/daily supply and prior high-high band, remains a crucial area of focus. It is the first ceiling to consider. The 6,820–6,830 zone becomes an intraday magnet if we manage to hold above 6,795. The 6,840 stretch target is a significant level that requires time above 6,795 first. The 6,852–6,855 zone is a potential squeeze extension, but only if momentum persists beyond 6,840.
Key zones — support: 6,725–6,735 is the prior NY session high / POH pocket and first decision area on any overnight strength that fades; 6,701–6,705 is the 1h equilibrium and flip line for intraday bias; 6,685–6,690 is the intraday pullback shelf and first buyable dip if 6,701 briefly slips and reclaims; 6,655–6,665 is the 1h demand pocket that keeps the rebound credible; 6,604 is the deeper extension stack that only comes into play on risk-off.
Overnight → NY forecast: baseline expectation is a range build under the 6,765–6,795 ceiling with stop-runs into the band and fades back toward 6,735 and 6,705; acceptance and sustained holding above 6,795 turns the tape constructive toward 6,820–6,830, with a paced push to 6,840 and only a momentum extension opening 6,852–6,855; loss of 6,701 during Asia/London that does not quickly reclaim tilts the path toward 6,690 and 6,665 before buyers try again; if 6,665 gives way decisively, risk opens to 6,604 where a larger bounce attempt is favored.
Setups (Level-KZ Protocol, 15m→5m→1m)
Short fade at the 6,765–6,795 band on the first clean test: enter on a 15m close back inside the band and a 5m re-close with a lower-high; place SL above 6,805–6,810; target 6,735 for TP1, 6,705 for TP2, 6,690 for TP3; if TP1 prints, close 70% and set the 30% runner to BE.
Long continuation only after real acceptance above 6,795: wait for a 15m full-body close above, then buy the 5m pullback that holds 6,795–6,800; SL 6,785; target 6,820–6,830 for TP1, 6,840 for TP2, 6,852–6,855 for TP3.
Quick-reclaim bounce at 6,701–6,705: if we sweep 6,701 and instantly reclaim on 1m/5m, buy the reclaim with SL 6,695; target 6,735 for TP1, 6,771–6,780 for TP2, 6,795 test for TP3.
Deeper flush-and-reverse at 6,655–6,665: buy only on confirmation (15m wick-rejection + 5m higher-low); SL 6,649; target 6,690 for TP1, 6,705 for TP2, 6,735 for TP3.
Bear continuation only if 6,701 is lost and holds below: sell the underside retest of 6,701–6,705; SL 6,712; target 6,690 for TP1, 6,665 for TP2, 6,604 extension for TP3 if momentum expands.
Bias and invalidation: The market currently exhibits a ' two-sided bias ', meaning it is neither bullish nor bearish, while we are trapped between 6,705 and 6,795. The tape turns constructive for extensions only after holding above 6,795 for multiple 15m closes. The intraday bias flips lower if we slip and cannot reclaim 6,701 on 15m closes. Invalidate any long if 6,665 breaks and holds; invalidate any short if we base above 6,830 and the first pullback defends 6,820.
Kill-zones and execution plan: Asia (20:00–00:00 ET) is optional and sized down; look for the 6,701 sweep/reclaim; London (02:00–05:00 ET) favors range probes into 6,735 or 6,705; NY AM (09:30–11:00 ET) is primary — fade the first touch of 6,795 if we gap under it, or buy the 6,795 pullback if we gap and hold above; manage lunch as maintenance only (12:00–13:00 ET); NY PM (13:30–16:00 ET) allows a final push toward 6,840 only if 6,820–6,830 converts to a floor.
Risk and management rules (applied to all plays): use a hard stop anchored to the relevant 15m wick ±0.25–0.50; take no partials before TP1; at TP1 close 70% and move the runner to BE; allow no more than two attempts per level per session; time-stop any trade that hasn’t hit TP1 or SL within 45–60 minutes.
S&P 500 (ES1!): Wait For Valid Buy Setups!Welcome back to the Weekly Forex Forecast for the week of Oct. 20-24th.
In this video, we will analyze the following FX market: S&P 500 (ES1!)
The S&P500 is ranging. More neutral than bullish. But Friday's bullish close indicates potential bullish order flow going into this week.
If price can manage to trade above the Monthly Open at 6,725, than buys become valid.
I'm not interested in selling this market, unless I see a sure enough bearish BOS.
Enjoy!
May profits be upon you.
Leave any questions or comments in the comment section.
I appreciate any feedback from my viewers!
Like and/or subscribe if you want more accurate analysis.
Thank you so much!
Disclaimer:
I do not provide personal investment advice and I am not a qualified licensed investment advisor.
All information found here, including any ideas, opinions, views, predictions, forecasts, commentaries, suggestions, expressed or implied herein, are for informational, entertainment or educational purposes only and should not be construed as personal investment advice. While the information provided is believed to be accurate, it may include errors or inaccuracies.
I will not and cannot be held liable for any actions you take as a result of anything you read here.
Conduct your own due diligence, or consult a licensed financial advisor or broker before making any and all investment decisions. Any investments, trades, speculations, or decisions made on the basis of any information found on this channel, expressed or implied herein, are committed at your own risk, financial or otherwise.

S&P 500 Elliott Wave Analysis: Approaching the End of Wave 5I believe the S&P 500 is nearing the end of wave 5, possibly complete already or very soon, based on ES future and SPX charts. The wave 4 low from April 2025 (~5000) should be retested in a 3-wave ABC pullback, targeting late 2026 to early 2027, aligning with Fibonacci time frames. RSI divergence and ending patterns support this. Thoughts?

S&P 500 back at 6750 resistance *TRUMP: MAYBE MEETING WON'T HAPPEN WITH XI
That was enough to cause the S&P to give up its earlier modest gains, as the index traded near an all-time high and resistance around 6750 where it had struggled in recent weeks. At the time of writing, it was bouncing back again, but let's see what it wants to do around 6750 now.
A couple of Fridays ago it tumbled from around this area when Trump re-ignited trade war concerns, before the usual TACO trade caused the index to bottom and make back all of its losses. Now we are back to square one.
Let's see if Trump will use the higher stock prices as a vote of confidence to up the pressure on China ahead of the trade truce deadline.
In any case, the bears will need to see a clear reversal pattern, before entertaining the idea of shorting what has been a very strong bull market. But like we saw in the case of gold and silver, market don't always go up in a straight line. Profit-taking ahead of earnings and trade deadline could shake things up a little.
By Fawad Razaqzada, market analyst with FOREX.com

SPX500 On the way to the upside! BUY NOWSPX500 is in a clear upwards channel and has broken the last bit of resistance (white trendline shown) - this is a clear confirmation that the next target will be the red trendline to the upside (next resistance level) - this is a great time to buy

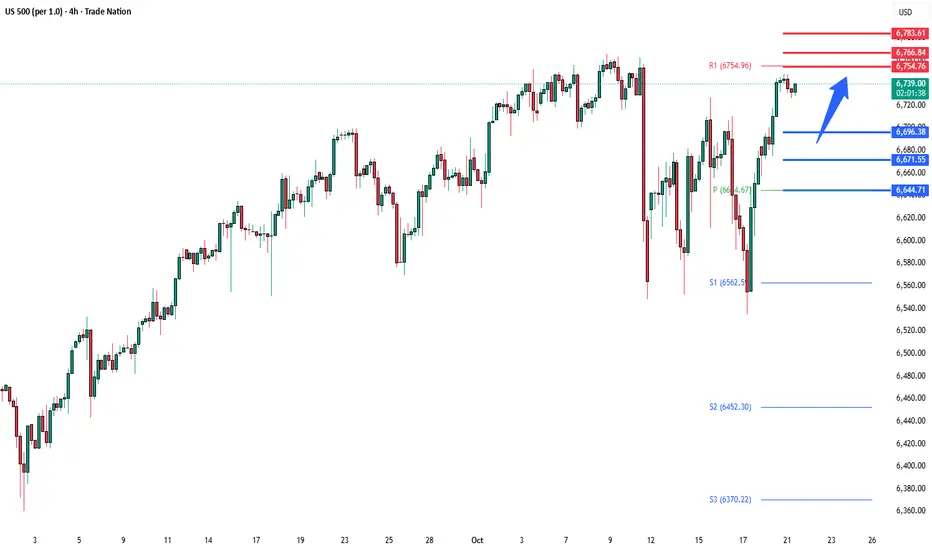
S&P500 Risk appetite improved, supported by easing inflationMarkets extended their rally yesterday, with the S&P 500 up 1.07%, closing just shy of record highs, while 30yr US Treasury yields fell to a 6-month low of 4.57%. The upbeat tone was driven by positive trade headlines, reduced shutdown fears, and lower oil prices — Brent crude slipped to $61.01/bbl, its lowest in five months, easing inflation concerns.
The key catalyst was optimism that the US and China will avoid new 100% tariffs due to take effect on November 1, after President Trump signalled confidence in reaching a “fair and great” trade deal following upcoming meetings.
In political news, Sanae Takaichi became Japan’s first female prime minister, a historic move likely to bring policy continuity with a conservative tone.
Elsewhere, Amazon Web Services resolved a 15-hour outage, underscoring global dependence on its infrastructure but with limited lasting market impact.
Overall tone:
Risk appetite improved, supported by easing inflation pressure and trade optimism.
Focus today shifts to earnings (Netflix, GE, Coca-Cola, etc.), Canada CPI, and ECB speakers, as investors gauge whether the rally can sustain into mid-week.
Key Support and Resistance Levels
Resistance Level 1: 6754
Resistance Level 2: 6766
Resistance Level 3: 6783
Support Level 1: 6696
Support Level 2: 6670
Support Level 3: 6645
This communication is for informational purposes only and should not be viewed as any form of recommendation as to a particular course of action or as investment advice. It is not intended as an offer or solicitation for the purchase or sale of any financial instrument or as an official confirmation of any transaction. Opinions, estimates and assumptions expressed herein are made as of the date of this communication and are subject to change without notice. This communication has been prepared based upon information, including market prices, data and other information, believed to be reliable; however, Trade Nation does not warrant its completeness or accuracy. All market prices and market data contained in or attached to this communication are indicative and subject to change without notice.
Tuesday, Oct 21st Weekly Forecast UPDATES!Welcome to the Weekly Forecast Updates!
In this video, we will analyze the following markets: DXY, EURUSD, GBPUSD, NASDAQ, S&P500
Enjoy!
May profits be upon you.
Leave any questions or comments in the comment section.
I appreciate any feedback from my viewers!
Like and/or subscribe if you want more accurate analysis.
Thank you so much
Disclaimer:
I do not provide personal investment advice and I am not a qualified licensed investment advisor.
All information found here, including any ideas, opinions, views, predictions, forecasts, commentaries, suggestions, expressed or implied herein, are for informational, entertainment or educational purposes only and should not be construed as personal investment advice. While the information provided is believed to be accurate, it may include errors or inaccuracies.
I will not and cannot be held liable for any actions you take as a result of anything you read here.
Conduct your own due diligence, or consult a licensed financial advisor or broker before making any and all investment decisions. Any investments, trades, speculations, or decisions made on the basis of any information found on this channel, expressed or implied herein, are committed at your own risk, financial or otherwise.

ES (SPX, SPY) Analysis, Key Levels, Setups Tue (Oct 21)Market Update for Traders:
Context:
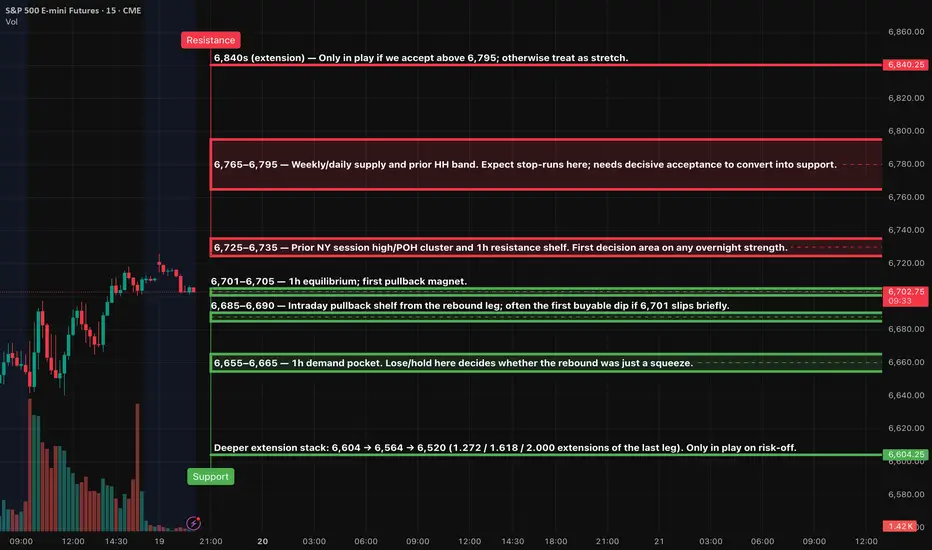
Currently, the price is approaching a key supply zone between 6,765 and 6,795. While we have seen a series of higher highs on the 1-hour chart, the momentum appears to be flattening. Below this supply level, we have identified some significant areas to monitor. The first clean value area on the 1-hour chart is around 6,701 to 6,705, with a visible pullback shelf located between 6,685 and 6,690. There's also a stronger demand zone in the 6,655 to 6,665 range. If we manage to break above the supply cap at 6,795, the next measured extension target is around 6,840, but this should be treated as a stretch unless we see solid acceptance above 6,795.
Key Zones to Watch:
Resistance:
- 6,765–6,795 (this is the current cap)
- Extension potential at 6,840, provided we see firm acceptance above 6,795.
Support:
- Look for the first decision point around 6,725–6,735, which reflects overnight strength.
- 6,701–6,705 is a key equilibrium area.
- The shelf for the first buyable dip lies at 6,685–6,690.
- Further support is found in the demand pocket at 6,655–6,665.
- If we encounter a deeper risk-off scenario, watch for extensions down to 6,604, 6,564, and 6,520, but only if we see a decisive failure in the rebound.
Setups:
Setup 1 — Rejection Short at 6,765–6,795 (A++)
Entry: 6,788–6,793 after a 5m re-close back below 6,795 and a 1m lower-high
Stop (SL): 6,804.50 (above rejection wick/upper edge)
TP1: 6,729–6,733
TP2: 6,701–6,705
TP3: 6,686–6,690
Setup 2 — Acceptance Long above 6,795 (A++)
Entry: 6,796–6,799 on first pullback that holds after decisive 15m acceptance over 6,795
Stop (SL): 6,785.00 (back inside the band)
TP1: 6,822–6,828
TP2: 6,840 stretch
TP3: 6,852–6,855 if squeeze persists
Setup 3 — Quick-Reclaim Long at 6,701 (A+ Bounce)
Entry: 6,702–6,705 only if 6,701 briefly slips and then a 5m candle re-closes back above it
Stop (SL): 6,694.50
TP1: 6,729–6,733
TP2: 6,765–6,775
TP3: 6,788–6,793
Setup 4 — Shelf Long at 6,685–6,690 (A Bounce)
Entry: 6,686–6,689 with a 1m higher-low and 5m hold
Stop (SL): 6,678.00
TP1: 6,701–6,705
TP2: 6,729–6,733
TP3: 6,765–6,775
Setup 5 — Demand-Pocket Long at 6,655–6,665 (A Bounce)
Entry: 6,657–6,663 on stabilization and 1m higher-low
Stop (SL): 6,647.00
TP1: 6,686–6,690
TP2: 6,701–6,705
TP3: 6,729–6,733
Setup 6 — Breakdown Short if 6,701 Turns to Resistance (A+)
Entry: 6,698–6,701 after a 5m close below 6,701 and a retest that fails
Stop (SL): 6,707.50
TP1: 6,686–6,690
TP2: 6,665–6,660
TP3: 6,604–6,564 only if momentum stays risk-off
Management (apply to all)
take the setup only if TP1 ≥ 2.0R using the stated SL. At TP1 close 70% and set the 30% runner to break-even; runner attempts TP2→TP3 if structure supports it. Time-stop 45–60 minutes if neither TP1 nor SL is hit. Primary execution windows: NY AM 09:30–11:00 ET and NY PM 13:30–16:00 ET.

S&P500 - $8.000 is the ultimate target!🎊S&P500 ( TVC:SPX ) continues the bullrun:
🔎Analysis summary:
Over the course of the past couple of months, the S&P500 has been rallying +40%. However, this does not mean that the bullrun is over any time soon. Since the S&P500 perfectly respects the rising channel pattern, a move to the upper trendline is the target.
📝Levels to watch:
$8,000
SwingTraderPhil
SwingTrading.Simplified. | Investing.Simplified. | #LONGTERMVISION

S&P 500 Index Near Key Resistance – Correction Ahead?Recently, the S&P 500 ( SP:SPX ) has seen some sharp moves with high momentum due to the tariff tensions between the US and China over the past couple of weeks. These moves have also impacted other correlated markets like cryptocurrency .
In the past day, news came out that Trump is planning to meet the Chinese president on October 31st . With markets opening, the S&P 500 started to rise and is currently moving near a Resistance zone($6,734_$6,690) and close to its Resistance lines .
From an Elliott Wave perspective, it seems that the S&P 500 is completing a microwave 5 of the main wave C , and the corrective structure looks like an Regular Flat(ABC/3-3-5) .
I expect that in the coming hours, the S&P 500 index could drop at least to around $6,641(First Target) .
Second Target: $6,611
Stop Loss(SL): $6,735
Note: The $6,641 level is quite important in the context of the recent rally and could act as both support and resistance for the S&P 500.
A possible decline or fall in the S&P 500 index could also cause Bitcoin to decline (due to Bitcoin's high correlation with the S&P 500 index in recent weeks).
Please respect each other's ideas and express them politely if you agree or disagree.
S&P 500 Index Analyze (SPX500USD), 1-hour time frame.
Be sure to follow the updated ideas.
Do not forget to put a Stop loss for your positions (For every position you want to open).
Please follow your strategy and updates; this is just my Idea, and I will gladly see your ideas in this post.
Please do not forget the ✅' like '✅ button 🙏😊 & Share it with your friends; thanks, and Trade safe.

BUY SPX - S&P500- Profitable trade opportunity!Based on our deep analysis we can see that SPX (S&P500) will head to the upside. Great time to BUY - it is currently in a uptrend and is holding on to powerful support levels. The next target is the resistance level to the upside. This is a great low risk high reward trade. BUY NOW!

SPX | DAILY ANALYSIS #6Hello and welcome back to DP.
Let’s kick off the weekday together by analyzing the **S&P 500 Index (SPX)**.
🟠 Market Overview
Previous Close: 6692.50
Current Daily Range: 6678.00 – 6705.80
Asia Session High: 6705.80
Asia Session Low: 6678.00
The index has seen significant selling pressure over the past week. She broke below the previous demand zone at 6715–6700, forming a new demand zone between 6680–6665.
This could suggest:
* Sellers are gaining momentum, OR
* Short positions were liquidated to make room for new entries.
🔵 Key Levels to Watch
Resistance Zone (Upside Target):
6711 – A break and hold above this level could lead to a test of 6735 and potentially new highs near 6755.
Support Zone (Blue Box):
6680 – 6665 – This is a critical support zone.
If broken, we may see the index fall toward:
First Support (Yellow Box): 6645
Deeper Support Zone: 6620 – 6605
If the 6680 zone holds and we see bullish confirmation (e.g., strong buying wicks, volume spike, or bullish engulfing candle), buyers may regain control and push the price back up toward the 6710–6730 range.
🧠 Trading Outlook
Bullish Bias Above: 6711
Bearish Bias Below: 6680
Neutral Zone: 6680–6710 (watch for consolidation or fakeouts)
📌 Note: The current structure suggests we are at a decision point. Be patient, wait for confirmation, and manage your risk accordingly.
Take care and have a great trading day!
For informational purposes only – not financial advice. © DIBAPRISM
Amir D. Kohn

S&P 500 Index Shows Elevated VolatilityS&P 500 Index Shows Elevated Volatility
On the 4-hour chart of the S&P 500 Index (US SPX 500 mini on FXOpen), the ATR indicator with standard settings has not fallen below the 30 mark, signalling higher current market volatility compared to previous periods. Traders’ decisions are being influenced by the ongoing government shutdown, developments around a potential US-China tariff deal, and an increasingly active earnings season. Market sentiment has also been shaped by renewed concerns over regional bank stability and profit-taking in AI-related stocks.
Looking ahead, the new week is also expected to bring heightened volatility, as:
→ US Treasury Secretary Scott Bessent and Chinese Vice Premier He Lifeng are set to meet in the coming days, paving the way for a potential meeting between Presidents Trump and Xi later this month.
→ Attention will also turn to quarterly results from Netflix, Coca-Cola, Tesla, IBM, and Intel. With key US economic data releases suspended due to the government shutdown, investors are likely to look to corporate earnings for direction.
Technical Analysis of the S&P 500 Chart
Major turning points on the 4-hour S&P 500 chart, highlighted in bold, outline a broad ascending channel that reflects the market’s expanded price swings.
From a bullish perspective:
→ The price remains in the upper half of the channel.
→ Market sentiment is improving, with prices moving closer to last week’s highs during the European session.
→ As indicated by the arrow, a wide bullish engulfing pattern formed near the lower boundary of the channel, confirming strong buying interest around the 6,560 level.
From a bearish standpoint:
→ Selling pressure was particularly aggressive near 6,720, pushing the price lower on 10 October.
→ Last week, this level once again acted as resistance, suggesting that bears maintain control there, limiting near-term upside potential.
Given these dynamics, traders may wish to adjust their strategies to account for the prevailing volatility. Should positive headlines emerge on US-China trade progress, supported by upbeat corporate forecasts, the S&P 500 could make a push towards the upper channel boundary, potentially setting a new record near the 6,800 mark.
This article represents the opinion of the Companies operating under the FXOpen brand only. It is not to be construed as an offer, solicitation, or recommendation with respect to products and services provided by the Companies operating under the FXOpen brand, nor is it to be considered financial advice.

ES (SPX, SPY) Analysis Week-Ahead (Oct 20th - 24th)Market Structure Overview
Price has shown a robust rebound from last week's discount levels, now trading back near the 6,720 area following a swift flush and subsequent V-shaped recovery.
Currently, we remain capped under the supply zone between 6,765 and 6,795, which represents the previous swing-high levels. As long as we trade below this resistance, our primary strategy will be to sell into strength and buy on dips within the established range, rather than pursuing breakouts.
On the hourly chart, key equilibrium is noted around the 6,701 to 6,705 range; this serves as the pivotal point around which price action is currently oscillating.
Setups (Level-KZ style)
Reclaim-and-go long (Tier-1 / Tier-2):
Asia/London: hold above 6,701–6,705 after a shallow dip → in NY AM, take the first 5m re-close + 1m HL toward 6,725–6,735.
Scale/target: TP1 6,725–6,735, runners toward 6,765–6,780 if strength persists. Invalidation: 15m body back below 6,701.
Flush-and-reclaim long (Tier-3 bounce):
• Quick sweep into 6,655–6,665 (or even 6,685–6,690) during London → immediate reclaim → first HL entry.
• Targets: back to 6,701 then 6,725–6,735. Invalidation: 15m close back inside/under the swept zone.
Pop-and-fail short (fade):
• Squeeze into 6,725–6,735 that fails to accept (15m rejection back inside) → take the first 5m LH.
• Targets: 6,701 then 6,685–6,690. Invalidation: 15m body acceptance above 6,735.
Stop-run reversal short:
• Spike into 6,765–6,795 (look for wick/absorption) → 15m rejection → 5m LH entry.
• Targets: 6,735 then 6,701. Invalidation: sustained 15m/30m acceptance above 6,795.
Management:
Anchor hard SL to the relevant 15m wick of the trigger ± a small buffer; require TP1 ≥ 2R to the next major level.
At TP1, trim most and put the runner to BE; max 2 attempts per level per session.
Overnight to Tomorrow NY Forecast
Base Case: Anticipate a range build between 6,685 and 6,735 overnight as the market absorbs the recent rebound. During the NY AM session (09:30–11:00 ET), initial attempts may test the 6,725–6,735 resistance before pulling back towards 6,701, potentially moving within the 6,685–6,690 range. Should buyers maintain support at 6,701 on a 15-minute chart, watch for a late-morning rebound back to the 6,725–6,735 zone, with a potential squeeze toward 6,755–6,780 if we see acceptance above 6,735.
The bias shifts to a bullish trend only with clear acceptance above 6,795, which would indicate multiple strong closes in that area, potentially targeting 6,820 and beyond. On the other hand, a decisive move below 6,655 would trigger a downward extension toward 6,604, 6,564, and 6,520.
Execution windows (ET)
• London: 02:00–05:00 — look for the sweep/reclaim plays.
• NY AM (primary): 09:30–11:00 — best momentum/rotation.
• NY PM: 13:30–16:00 — continuation or mean-revert back into the day’s pivot.
What changes the plan
Acceptance above 6,735 early: favor continuation to 6,765–6,780 rather than fading.
Hard failure at 6,701 with sellers defending on 15m: expect a deeper test into 6,685 → 6,655–6,665.
Elevated macro headlines/data at 08:30/10:00 ET windows can temporarily override levels; let the impulse print, then trade the retest.
S&P 500 Bear Market in 2026The Stock market is going to send Crypto into a Bear market in 2026.
It just broke it's weekly cycle count and it's currently painting a bullish divergence. This means only one thing - we are going into a blow-off top within the next 2 months.
We are going to top above 7000 area, and in case we don't have a proper retracement into the Weekly Cycle low within November, we are going to make a blow-off top in December/January.
2026 Year will be profit taking year and the stock market is expected to retrace 20%, while Bitcoin will go down by more than 50%.
It's the last leg of the bull and it's time to get allocated in the market.

BUY SPX - S&P500- Amazing low risk high reward trade!Based on our deep analysis we can see that SPX - S&P500 will head to the upside. Great time to buy - it has broken major resistance levels + trends.

US banks on shaky ground Macro conditions are turning hostile. The commercial real estate market, especially office, is structurally impaired in certain segments. Vacancy rates in major US metros are above 20%. Office prices are down 30–40% from their 2022 peaks. With over $1.2 trillion in CRE debt maturing by 2027, refinancing risk is climbing, fast.
Wells Fargo is sitting in the crosshairs. Its latest earnings showed net interest income down 13% year-on-year. Revenue fell 6%. The top line is weakening just as credit risk is rising. Commercial loan charge-offs surged to $923 million in 2023, up from just $152 million the year before. That’s a sixfold increase.
Of that, the bulk came from office-related exposure. The bank has set aside more reserves, but at year-end 2023, its allowance for credit losses on commercial real estate was $1.9 billion, just 2.6% of its $72 billion CRE book. That ratio looks optimistic.
Wells Fargo’s total book value of equity stands at around $170 billion. If CRE losses reach 5–7% of the commercial book, well within historical stress-case scenarios, that implies $3.5 to $5 billion in write-downs. That’s a 2–3% direct hit to equity. Not catastrophic, but meaningful when earnings are already trending lower.
The risk isn’t just the loss itself, it’s the market response. Investors are not pricing in a deep CRE downturn. A fresh wave of write-offs could hit sentiment and compress the stock’s valuation multiple. In a rising loss cycle, confidence matters more than capital ratios.
Until we see a reset in CRE values or more aggressive derisking from management, the stock remains vulnerable. The earnings outlook is soft. The balance sheet is exposed. This is a short or, at best, an underweight.
The forecasts provided herein are intended for informational purposes only and should not be construed as guarantees of future performance. This is an example only to enhance a consumer's understanding of the strategy being described above and is not to be taken as Blueberry Markets providing personal advice.
