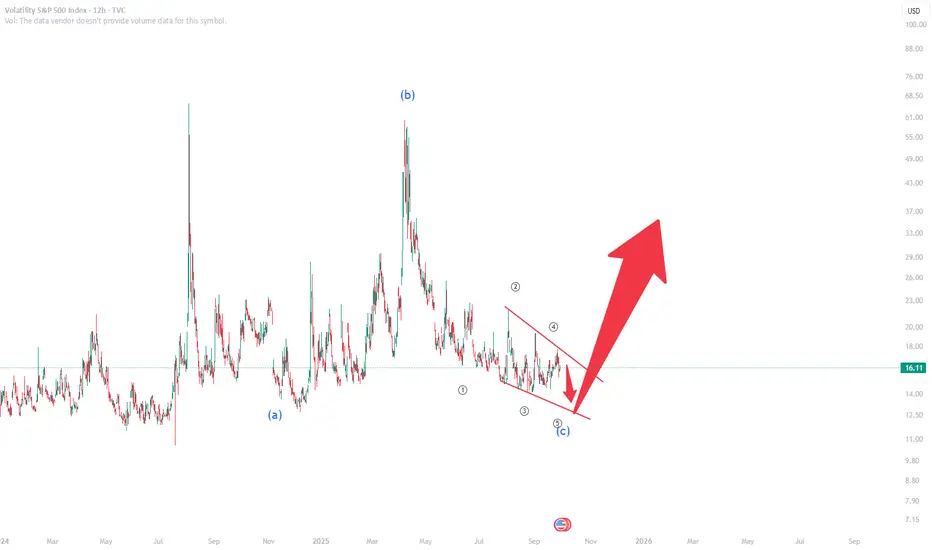
VIX Index – Elliott Wave Analysis: Diagonal C CompletionThe VIX index is finalizing an A-B-C corrective structure, with the C-leg forming as a diagonal. Price action suggests this structure is close to completion. Once the diagonal ends, the probability of a sharp upside move in volatility becomes highly likely.
Why does this matter?
A rising VIX reflects fear and risk aversion in the market.
Historically, VIX moves inversely with equities – higher volatility often coincides with S&P 500 weakness.
When VIX breaks out, it signals hedging demand and uncertainty, pushing option premiums higher and increasing market stress.
📌 Trading view: A confirmed breakout from the diagonal would mark the start of a new impulsive leg higher in volatility. This could align with risk-off flows in equities and broader corrections across risk assets.
Patience and confirmation remain key — once VIX turns, it usually accelerates quickly, not quietly.
S&P 500 (SPX500)
Bear trap....SPX to fall soonToday was somewhat decent, but let's not get too giddy! There's looming Gov shutdown on Wed and a few sizable calls on the VIX on the tape. We can see technicals showing a decline, at least in the short term, and I guess we'll see what happens post-Wed. One thing is for sure is that we are overdue a nice healthy pullback. Would not bet the farm on AI esp. with astronomical CAPEX, and highest concentration ever in the market. Best of luck!

S&P500: More Upside Likely Before PullbackThe North American Mass Index kicked off the new week with some momentum, extending its climb within the ongoing magenta wave (3). For now, we anticipate this upward trend could continue before reaching a new high. Afterward, we expect a pullback as part of the subsequent wave (4), likely bringing the index into the magenta long Target Zone between 6,283 and 5,781 points. In our view, this price range offers attractive opportunities for long positions, as wave (5) is expected to follow—potentially pushing the index significantly higher and completing the larger blue wave (III). To protect newly established long positions, a stop can be set 1% below the lower boundary of the Target Zone.

SPX - That's all folks?The world has gone nuts, but markets didn't even blink.
Now the SPX has reached it's U-MLH, which means, it's at a real extreme.
This is a level where price starts to stall, then turn.
Often we see "a last attempt" to break through, and it really could happen. But then, gravity again takes it's toll and the rocket starts to turn south.
Here are the scenarios I see:
1. Immediate turn at the U-MLH. Target is the Centerline.
2. A break of the U-MLH, then back into the fork and a fall down to the Centerline.
3. Break the U-MLH, continuation to the WL1.
The most unlikely would be 3.
In my view, Party People should have left allready, but they refused to.
And that's why this time headaches will be the least problem they face.
Wating for a short signal, to load up heavy.

The S&P 500 Index Remains Positive Against the OddsThe S&P 500 Index Remains Positive Against the Odds
Today, the S&P 500 Index is trading close to a new all-time high, having opened Monday above 6,675 points. This reflects continued optimism among market participants despite factors such as:
→ The risk of a U.S. government shutdown on 1 October.
Today, President Trump will meet with Democratic and Republican leaders in Congress to try to prevent a halt to government funding. However, Reuters reports that chances of reaching an agreement are slim. At the same time, Bank of America analysts remain calm, noting that a shutdown would shave only around 0.1% off GDP per week, and historically such closures have had little impact on financial markets.
→ Jerome Powell’s hawkish stance at the September Federal Reserve meeting.
Nevertheless, most market participants expect the Fed to make another move towards cutting rates at its next meeting on 29 October. The publication of the PCE index on Friday increased this likelihood, as the figures came in line with forecasts, reducing the risk of a renewed inflation surge.
Technical Analysis of the E-mini S&P 500 Chart
On 17 September, analysing the 4-hour chart of the S&P 500 Index, we noted:
→ the price continues to fluctuate within an ascending channel, highlighted in blue;
→ the long body of the bullish candle on 11 September points to strong buyer pressure, indicating an imbalance, or, in Smart Money Concept terminology, a Fair Value Gap (FVG).
At present, the channel remains relevant, but it has expanded — bullish sentiment has shifted the key line (marked in orange) from resistance to support. At the same time, the FVG zone has confirmed its role as support.
Possible developments: the chart indicates a buyer advantage:
→ strong demand near the channel’s median (evident in the long lower shadows from Friday, marked with an arrow);
→ buying activity has been strong enough to push the price back (for now) within the ascending channel.
If buyer dominance continues, this could lead to a new all-time high, testing the upper boundary of the channel. From a bearish perspective:
→ the psychological level of 6,700 could act as resistance;
→ continued growth at Monday’s open could push the RSI indicator into overbought territory, creating potential for a correction.
However, as long as the S&P 500 Index remains above the orange support line, there is reason to believe that the bulls remain in control.
This article represents the opinion of the Companies operating under the FXOpen brand only. It is not to be construed as an offer, solicitation, or recommendation with respect to products and services provided by the Companies operating under the FXOpen brand, nor is it to be considered financial advice.

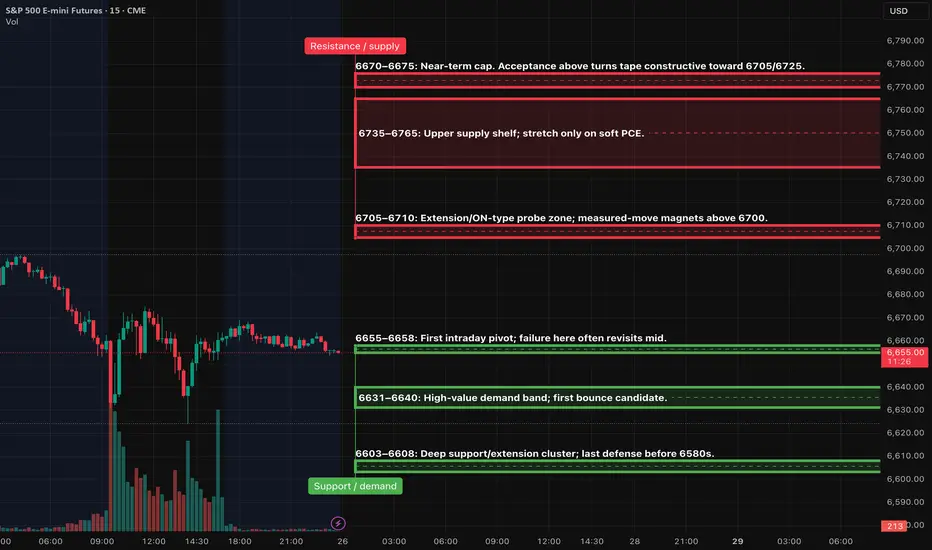
ES Futures (SPX, SPY) Weekly Analyses, Levels: Sep 29 - Oct 3 Weekly Outlook
The trend remains bullish on both the weekly and daily charts, with price action re-accumulating beneath a well-defined supply zone around 6750–6760. Friday’s rebound from the low 6600s has established a higher-low structure on the 4-hour and 1-hour timeframes, closing above the mid-range of 6612–6630, which shifts near-term momentum back in favor of the buyers.
As we enter a catalyst-heavy week, the path of least resistance suggests a measured push through last week’s “weak high” zone (6750–6760). A decisive move above this supply shelf could target the psychological 6800 mark first, with potential for further upside towards 6865–6885, assuming momentum and market breadth are supportive.
Conversely, if we fail to establish acceptance above 6755, the market could revert to a 6700–6760 range, with downside risks extending to 6620 in response to any hot economic data or risk-off sentiment in the headlines.
Key catalysts this week (ET)
Mon–Thu: Fed speakers scattered; watch for rate-path color and balance-sheet remarks.
Tue 10:00: JOLTS (Aug).
Wed 8:15: ADP employment (Sep). Wed 10:00: ISM Manufacturing (Sep).
Fri 8:30: Non-Farm Payrolls & Unemployment (Sep). Fri 10:00: ISM Services (Sep).
Note: Any fiscal headlines or shutdown noise can skew liquidity and tape reactions around these prints.
Tomorrow — NY AM plan (Level-KZ Protocol 15/5/1)
ES Long (A++) — 6750–6760 Acceptance Continuation
Bias: Bullish if we get acceptance above the 6750–6760 shelf.
Trigger: 15m full-body close above 6755. Then 5m pullback holds ≥6750 and re-closes up; enter on the first 1m HL.
Entry: 6752–6756 pullback fill (avoid chasing a wick).
Stop: Hard SL below the 15m break-candle low −0.50. Viability gate: TP1 ≥ 2.0R.
Targets: TP1 6798–6805; TP2 6865–6885; TP3 6900–6915.
Management: No partials before TP1. At TP1 close 70%, move runner to BE. Trail only after TP2 or if a 5m lower-high forms against you. Time-stop 45–60m if neither TP1 nor SL hits. Max 2 attempts at this level for the session.
Invalidation: 15m body back inside ≤6748 or a failed 5m re-close (acceptance lost).
ES Short (A+) — 6750–6760 Rejection Fade
Bias: Mean-revert to base if the shelf is swept and rejected.
Trigger: Sweep 6750–6760 and 15m closes back below 6748. Then 5m re-close down with a LH; enter on the first 1m LH.
Entry: 6744–6748.
Stop: Above the rejection wick +0.50 or ≥6762, whichever is tighter.
Targets: TP1 6705; TP2 6680; TP3 6620.
Management: Take 70% at TP1, runner to BE; consider covering more ahead of 6680 into data windows. Time-stop 45–60m. Max 2 attempts.
Invalidation: 15m acceptance back above 6755 or a 5m close making new session highs.
Price Projection for the Week
Base Scenario: If we see early-week acceptance above 6755, look for targets at 6800, paving the way for a gradual move towards 6865–6885 by Friday. A soft-landing scenario, characterized by cooler labor growth and steady ISM data, could push prices even to the 6900–6915 range.
Alternative Scenario: Should we experience a rejection in the 6750–6760 range, expect the ES to remain range-bound between 6700–6760. Hot labor market data or strong ISM figures could drive the price back to 6620, where it’s crucial for buyers to defend this level to maintain the uptrend.
Execution Notes:
- Focus on trade opportunities only within key kill-zones: primary session is NY AM from 09:30–11:00; optional trading during Asia/London sessions should be done at reduced sizes.
- Adhere to daily barriers: halt trading at -2R or after achieving +3R net.
- On first touch, prioritize R0/S1 as significant; consider de-risking during second or third interactions.
But Ser, Wen Moon? Wen Alt Season?But Ser, Wen Moon? Wen Alt Season?
Why 2024 Was Your Alt Season (And Why the Next One Is Years Away)
The Uncomfortable Truth: Alt Season Already Happened
Everyone’s still asking “wen alt season?” The painful reality: it already came and went in 2024.
The Altcoin Season Index hit 88 in Dec 2024 - its highest since 2021 - before collapsing to 12 by April 2025 - that was your alt season. The memecoin mania, the AI‑narrative pumps, the handful of legitimate winners like CRYPTOCAP:HBAR , CRYPTOCAP:SOL (at the time of writing still up 10x from 2023 lows), CRYPTOCAP:SUI , COINBASE:SEIUSD , CRYPTO:INJUSD , CRYPTO:RENDERUSD and a few others - that was it.
CRYPTOCAP:TOTAL3ES It peaked symbolically when the President of the United States launched his own memecoin $BINANCE:TRUMPUSDT.
Pause and think about that for a minute: when the most powerful person on earth is shilling crypto memes, you’re not early anymore - you’re late.
Most people missed it because they were waiting for a 2017‑style blow‑off where everything pumped indiscriminately. Instead, 2024 was surgical: only the strongest assets with real utility or meme community power survived. The rest 95-99% of the market - stayed the same laughable junk it’s always been. This wasn’t broad‑based euphoria; it was natural selection.
Why Traditional Finance Beat Crypto This Cycle
Here’s the overlooked truth: the AI rally happened at the same time as Bitcoin’s halving rally.
Faced with a choice between dead altcoins hoping for a 2021 revival or BIVA:NVDA and BMV:MSFT printing real revenue, smart money chose AI and equities over dead altcoins. Retail followed. The AI trade sucked the oxygen out of crypto, leaving most alts gasping for liquidity.
NASDAQ:NVDA added $2.2 trillion in market cap in 2024.
NASDAQ:APP surged +758%.
NASDAQ:PLTR and NASDAQ:MSFT rode AI adoption to record highs.
INDEX:ETHUSD path tells the story: it clawed back to its 2021 highs - just enough for whales to exit three years of underwater bags. Mission accomplished. Retail still waiting for $10K ETH? Game over.
In September alone, COINBASE:ETHUSD saw it largest ETF NASDAQ:ETHA outflow and this money didn't go to alts it was out of the market - Institutions don’t rotate into alts - they rotate out of crypto entirely...
The Institutional Playbook vs. Retail Delusion
The 2024–25 rally was institutional, not retail.
BlackRock’s iShares Bitcoin Trust NASDAQ:IBIT has seen $60B+ inflows since Jan 2024, holding ~756,000 BTC.
Fidelity’s CBOE:FBTC holds ~$22B.
Together, they dominate >70% of U.S. ETF flows.
When Blackrock NYSE:BLK and Fidelity CFI:FBTC buy billions in Bitcoin ETFs, they’re not chasing 100x moonshots. They’re happy with 2–3x on massive positions. In institutional terms, a 5x is a career‑making home run.
This isn’t 2017 or 2013 anymore. Crypto is a multi‑trillion dollar ecosystem where retail’s few thousand dollars are statistical noise. The old playbook - “Bitcoin pumps, then alts follow” - is dead - it assumed retail drove the cycle. Today, institutions hold the keys, and like i said they don’t rotate into your favorite altcoin. They rotate into other asset classes entirely.
The Timing Mismatch: Why Q4 Narratives Are Dead Wrong
Veterans keep calling for a Q4 2025 blow‑off top, stuck on the 2013/2017 template. But this cycle is different:
The 4th halving was April 19, 2024 - not May.
IG:BITCOIN typical 1.5‑year post‑halving peak landed in Q3 2025 (~$124K), not Q4.
The cycle is already complete.
Altcoins only thrive when IG:BITCOIN highs are fueled by retail FOMO and leverage. This cycle was powered by measured institutional accumulation. Without retail mania, alts had no fuel. The few that did pump ( CRYPTOCAP:HBAR , CRYPTOCAP:SUI , CRYPTOCAP:SOL , BINANCE:RENDERUSDT ) had real narratives or tech advantages. In a mature market, only quality survives.
The Next Real Alt Season: Q4 2026 and Beyond
Here’s the contrarian call: the next true alt season won’t arrive until Q4 2026 at the earliest.
Why? Because it will take a global financial crisis bottom, central banks printing like mad, and risk appetite returning before crypto regains its role as the speculative playground. That’s when we’ll see a decade‑long melt‑up that makes 2017 look quaint.
By then, 95% of today’s projects will be gone. Regulation will be clearer. Infrastructure will be mature. The survivors of this purge will form the foundation of the next supercycle. But first, the forest fire has to clear the dead wood.
What This Means for Your Bags
If you’re still holding 2021 altcoins waiting for a miracle, you’re fighting the last war. Smart money has rotated out. Retail is exhausted. Institutions aren’t coming to save your bags.
Most alts will bleed slowly into irrelevance - not with dramatic crashes, but with grinding decline as liquidity and attention flow elsewhere. The few survivors will be those with genuine utility, strong teams, and institutional interest. Everything else is destined for zero.
The New Playbook: Cash Is King
For the next 12–18 months, the winning strategy isn’t catching falling knives. It’s preservation of capital and patience. Hold cash. Maybe some Bitcoin as a hedge. Wait for the real bottom - when fear replaces hope and quality trades at fire‑sale prices.
The casino days are over. The market has grown up. And grown‑up markets don’t hand out infinite money glitches to anyone with an internet connection. The future belongs to those who adapt to the new rules - not those who keep playing by the old ones.
Bottom line: Alt season already happened in 2024. The next one won’t come until 2026+. Plan accordingly.

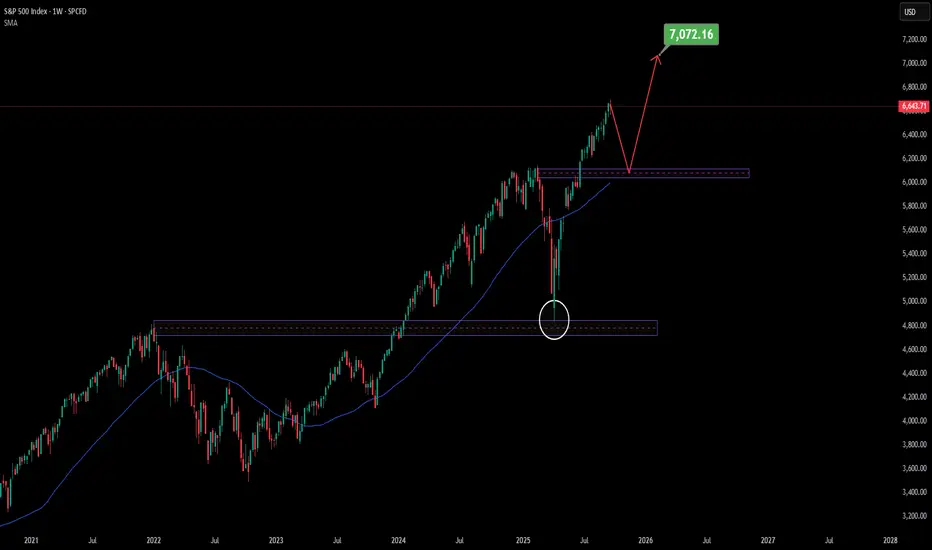
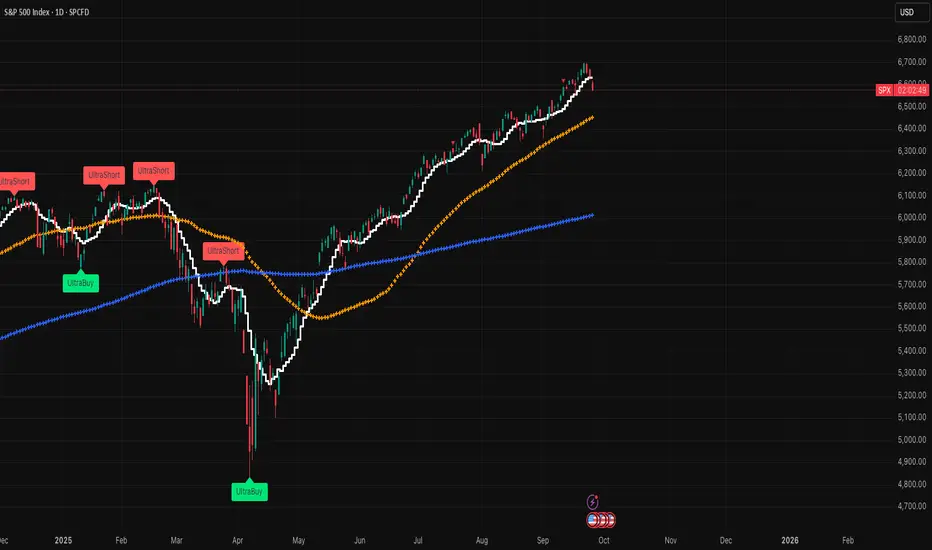
My view on S&P 500Looking at the structure, I think the S&P 500 may first pull back to retest the support zone, just as it did in April of this year when price dipped to that same area before continuing higher.
This time, the support and the 50-week SMA are aligning together, creating a strong confluence that could serve as a base for the next upward move.
From there, my view is that SPX could rebound and eventually push into a new all-time high around 7,000.
🎯 Conclusion: My outlook is constructive — I expect SPX to repeat its April-like retest, find strength at the confluence of support and the 50 SMA together, and then rally toward the 7,000 level. Still, markets are unpredictable, and this remains only my view.
👉 For more structured market insights and professional analysis, follow along.
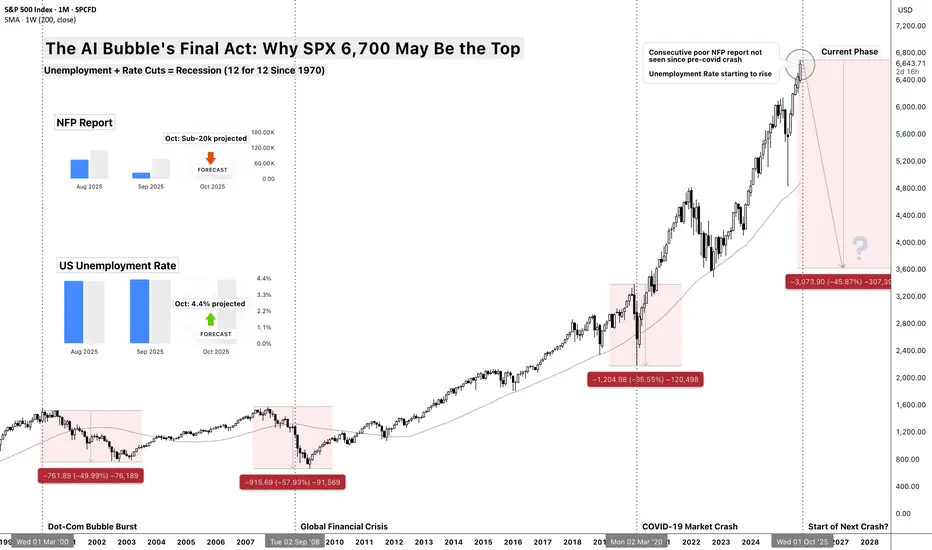
The AI Bubble's Final Act: Why $SP:SPX 6,700 May Be the TopThe AI Bubble's Final Act: Why SP:SPX 6,700 May Be the Top
Unemployment + Rate Cuts = Recession (12 for 12 Since 1970)
The Death Cross Pattern
There's a simple rule that's worked for 55 years: When the Fed cuts rates while unemployment is rising from cycle lows, recession follows within 12 months - every single time.
Think of it like a doctor taking your temperature while giving you painkillers. The medicine might make you feel better temporarily, but if the fever is rising, something serious is wrong underneath.
Current Status:
✅ Fed just cut rates ECONOMICS:USINTR (September 2025)
✅ Unemployment ECONOMICS:USUR rising from 3.4% cycle low
✅ TVC:SPX at all-time high ($6,700)
Historical Result: 12/12 times = recession + 35% average equity crash
The Precedent: Crisis Follows a Script
2000 Dot-Com Bubble:
Setup: TVC:SPX at ATH (1,550), ECONOMICS:USUR unemployment at 3.9%, ECONOMICS:USINTR Fed starts cutting
Crisis: Technology "revolution" story breaks down
Result: -49% crash over 2.5 years
Recovery: 7 years to new highs
2008 Financial Crisis:
Setup: CBOE:SPX at ATH (1,576), ECONOMICS:USUR unemployment at 4.4%, ECONOMICS:USINTR Fed starts cutting
Crisis: Housing/credit bubble bursts
Result: -57% crash over 1.5 years
Recovery: 5 years to new highs
2025 AI Bubble:
Setup: SPREADEX:SPX at ATH (6,700), ECONOMICS:USUR unemployment at 3.4%→4.2%, ECONOMICS:USINTR Fed starts cutting ✅
Crisis: AI productivity story meets employment reality
Projection: -35 to -45% crash over 18 months
Recovery: 3-5 years (faster due to tech infrastructure remaining)
The AI Employment Paradox
The Productivity Mirage
Wall Street celebrates AI boosting productivity, but here's the paradox:
productivity gains = job losses = reduced consumer spending = recession.
Think of it like a factory owner celebrating a new machine that replaces 100 workers. Great for margins, terrible for the local economy when those 100 families stop spending.
Jobs ECONOMICS:USNFP at Risk by Sector:
Customer Service: 2M jobs (chatbots replacing agents)
Software Development: 500K jobs (AI-assisted coding reducing teams)
Transportation: 3M jobs (autonomous vehicles accelerating)
Administrative: 4M jobs (AI handling routine tasks)
Content Creation: 1M jobs (AI writing, design, video)
Total Impact: 10+ million jobs facing displacement over next 2-3 years
Why This Time is Different?
Unlike previous automation waves that created new job categories, AI is targeting cognitive work directly. A factory worker could become a service worker, but what does a displaced knowledge worker become?
Valuation Extremes: 1929 Levels with 2025 Leverage
Current Valuation Metrics:
Shiller CAPE: 38+ (higher than 1929's 33)
Buffett Indicator: 195% (market cap/GDP, historical average 85%)
Price/Sales: 3.3x (vs 1.4x historical average)
Forward P/E: 23x (on optimistic AI earnings assumptions)
Valuations today exceed 1929 by most measures - but with far more leverage embedded in the system. If 1929 was a valuation bubble, 2025 is that bubble layered with derivatives, corporate debt, and passive flows.
The Leverage Layer:
Margin Debt: $1.023 trillion (record high)( as of July 2025, ycharts )
Corporate Debt/GDP: 85% (vs 45% in 2000)
Derivatives Exposure: $700 trillion notional ( as of June 2025, BIS semiannual data )
ETF/Passive Flows: $1.5 trillion annually (forced selling on reversals)
When liquidity stress hits, derivatives amplify shocks - notional exposure dwarfs underlying assets.
Think of today's market like a house of cards built on a trampoline. Even small bounces can bring the whole structure down.
Technical Breakdown: The Charts Don't Lie
Major Warning Signals:
Market breadth has deteriorated from 90% in Q4 2024 to ~60% today,
Defensives led earlier in the year,
TVC:VIX Volatility’s floor has shifted higher
Credit risk appetite (HYG/TLT) is stretched.
Together, these signal fragility beneath the index surface.
The Three-Stage Technical Collapse:
Stage 1 - The Warning (Now-Q4 2025):
Current Level: $6,700
Initial Support: $6,200 (previous resistance)
Character: Failed rallies, rotating leadership, "healthy correction" narrative
Target: 5,800-6,000 (-10 to -13%)
Stage 2 - The Cascade (Q4 2025-Q2 2026):
Breaking Point: Below 5,800 triggers algorithmic selling
Character: "Buy the dip" stops working, margin calls begin
Target: 4,800-5,200 (-25 to -30%)
Stage 3 - Capitulation (Q2-Q4 2026):
Final Flush: Panic selling, ETF redemptions
Character: "Markets will never recover" sentiment peaks
Target: 3,700-4,200 (-35 to -45%)
The Catalyst: When Reality Meets Hype
Q4 2025 Earnings Season - The Reckoning
Companies will face impossible questions:
"You spent $50B on AI - where's the revenue growth?"
"Productivity is up 20%, why are you laying off workers?"
"If AI is so transformative, why are margins declining?"
The Employment Data Domino Effect:
October/Nov NFP: First print above 250K unemployment claims
November Consumer Spending: Down 2%+ as job fears spread
December Holiday Sales: Weakest since 2008
January Layoff Announcements: Tech companies start "right-sizing"
Think of it like the moment in 2000 when investors finally asked: "How exactly does Pets.com make money?" or 2007 when they wondered: "What's actually in these mortgage bonds?"
Sector-by-Sector Breakdown
Technology (-50 to -70%)
AI hype stocks get destroyed first
Software companies face declining growth + competition
Semiconductor cycle turns negative
Biggest Losers: NVDA, MSFT, GOOGL
Consumer Discretionary (-40 to -55%)
Unemployment hits spending immediately
High-end retailers crushed first
Auto sales collapse with higher rates
Biggest Losers: TSLA, AMZN, NKE
Financials (-30 to -45%)
Credit losses surge as economy weakens
Interest margin compression
Commercial real estate exposure
Biggest Losers: Regional banks, non-bank lenders
Relative Outperformers (-15 to -25%)
Utilities, Healthcare, Consumer Staples
Companies with genuine AI cost savings
High-dividend yielders in low-rate environment
Key Dates and Catalysts
October 2025:
Jobs report (first warning?)
Q3 earnings disappointments
Fed meeting (dovish pivot?)
November 2025:
Election aftermath volatility
Black Friday sales data
Thanksgiving week low-volume crashes
December 2025:
Year-end tax selling
Institutional rebalancing
Holiday retail reality check
Q1 2026:
Layoff announcements surge
Earnings guidance slashed
Credit events begin
The Recovery Setup
Why This Crash Creates Opportunity:
Valuation Reset: P/E ratios back to historical norms
Weak Hands Flushed: Margin traders eliminated
Government Response: Fiscal + monetary stimulus
AI Infrastructure Remains: Real productivity gains continue post-bubble
Recovery Timeline:
Bottom: Q4 2026 around 3,700-4,200
Initial Rally: 30-50% bounce over 6 months
New Bull Market: Begins 2027 with stronger foundation
New Highs: 2029-2030 timeframe
Risk Management Rules
This Analysis Fails If:
Fed pivots to massive QE before crisis
Fiscal stimulus exceeds $2 trillion quickly
AI productivity gains offset job losses faster than projected
Geopolitical crisis overrides economic fundamentals
Probability Assessment:
60%: Correction to 4,800-5,500 range (25-30% decline)
25%: Major crash to 3,700-4,200 range (40-45% decline)
15%: Continued melt-up through 2026 (soft landing achieved)
Conclusion: The End of the Everything Era
At SPX 6,700 with unemployment rising and the Fed cutting rates, we're witnessing the final act of the 15-year "everything bubble."
The AI revolution is real, but like the Internet in 2000, revolutionary technology doesn't prevent financial gravity.
The bubble is ending exactly like the previous ones - with everyone believing "this time is different" right until it isn't.
Smart money is already rotating defensive. The question isn't whether a correction is coming - it's whether you'll be positioned for it.
My past present and Futures with Christ!We have been doing things quite different lately.
One setup is all we do.
It is quite boring.
But it works
and Christ is the center of it all!
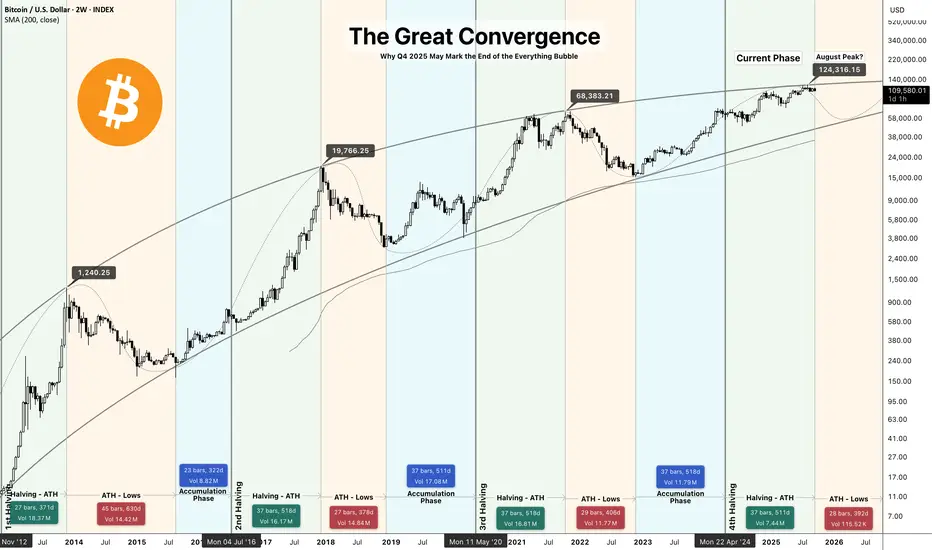
The Great Convergence: End of the Everything BubbleThe Great Convergence: Why Q4 2025 May Mark the End of the Everything Bubble
A Multi-Asset Analysis of Bitcoin, S&P 500, and Gold at Critical Junctures
Hello Traders, After analyzing 25 years of market data across three major financial crises, I've identified a dangerous convergence of signals suggesting we're approaching a significant market inflection point. The simultaneous peaks in IG:BITCOIN (~$124K), SP:SPX (6,700), and TVC:GOLD ($3,790) combined with deteriorating macroeconomic indicators mirror patterns that preceded both the 2000 and 2008 crises.
Key Thesis: We are potentially entering a liquidity crisis that could result in a 30-50% correction across risk assets by Q4 2026.
Part I: The Bitcoin Halving Cycle - End of the Fourth Epoch
Historical Pattern Recognition
CRYPTO:BTCUSD price action has followed a remarkably consistent 4-year cycle tied to its halving events:
2012 Halving → 2013 Peak (1 year delay): +8,000% rise, -85% crash
2016 Halving → 2017 Peak (1.5 years delay): +2,800% rise, -84% crash
2020 Halving → 2021 Peak (1.5 years delay): +700% rise, -77% crash
2024 Halving → 2025 Peak (1.5 years delay): +450% rise, -75% crash projected
Current Technical Indicators
RSI Divergence: Weekly RSI showing lower highs while price makes higher highs - classic exhaustion signal present at 2013, 2021 previous cycle tops.
Volume Profile: Declining volume on recent rallies indicates weakening conviction
On-chain Metrics: Long-term holder distribution accelerating, similar to previous cycle tops
Price Targets
Current Level: $109,498
Proposed Peak: $124,000 (By halving cycle theory this was fulfilled last month August)
Initial Support: $69,000 (previous cycle ATH)
Crisis Target: $25,000-30,000 (75% drawdown from peak by Q6 2026)
Part II: The Macro Crisis Trigger - SPX SP:SPX / Unemployment Rate ECONOMICS:USUR / Fed Rate Correlation ECONOMICS:USINTR
The Historical Precedent
Every major crisis follows a predictable sequence:
2000 Dot-Com Bubble:
CBOE:SPX at ATH (1,550) ✓
Unemployment begins rising from 3.9% ✓
Fed initiates rate cuts ✓
→ 49% crash over 2.5 years
2008 Financial Crisis:
TVC:SPX at ATH (1,576) ✓
Unemployment rises from 4.4% ✓
Fed cuts rates aggressively ✓
→ 57% crash over 1.5 years
2025 AI/Everything Bubble:
TVC:SPX at ATH (6,700) ✓
Unemployment rising from 3.4% ✓
Fed just initiated cuts (Sept 2025) ✓
→ Projected 35-45% correction over 1.5 years
The Unemployment-Rate Cut Death Cross
Since 1970, whenever the Fed has cut rates while unemployment is rising from cycle lows:
12/12 times resulted in recession within 12 months
Average equity drawdown: 35%
Average duration: 18 months
Current Labor Market Dynamics - The AI Disruption Factor
Unlike previous cycles, we face structural unemployment pressure from AI adoption:
Customer service: 2M jobs at risk
Software development: 500K jobs transitioning
Logistics/Transport: 3M jobs being automated
Administrative: 4M jobs under pressure
This isn't temporary cyclical unemployment - it's structural displacement requiring economic reorganization.
Part III: Gold's Crisis Pattern - The Liquidation Before the Flight
Historical TVC:GOLD Behavior in Crisis
Contrary to popular belief, FX:XAUUSD can and does suffer fast flushes during systemic liquidity panics despite its long-term hedge role; with gold near ATH, combined liquidity and profit-taking risk could produce a 15–25% correction ahead of any later safe-haven rally:
2000 Crisis:
Pre-crisis peak: $326
Initial drop: -21%
Bottom-to-recovery: +650% over 11 years
2008 Crisis:
Pre-crisis peak: $1,033
Initial drop: -34%
Bottom-to-recovery: +180% over 3 years
Covid-19 Pandemic:
Pre-pandemic peak: $1,696
Initial drop: -15%
Bottom-to-recovery: +43% over 2 years and 160% over 5 years
Some will point to 2020, when gold rallied during the COVID crash. But that was a unique exogenous shock: the selloff lasted only weeks before unprecedented stimulus and collapsing real yields drove gold to new highs. In contrast, financial‑system crises like 2000 and 2008 forced gold into a year‑long correction before its hedge role reasserted. The 2025 setup looks far closer to those financial crises than to 2020’s pandemic shock.
2025 Projection:
Current peak: $3,790
Expected initial drop: -20 to -25%
Target bottom: $3,000-$2,800
Long-term recovery target: $6,500+ by 2030
Why Gold Falls Initially
During liquidity crises, investors sell everything to meet margin calls and raise cash - even safe havens. Only after the acute phase does gold fulfill its hedge role.
Part IV: The Convergence - Why This Time Is Particularly Dangerous
Unique Risk Factors in 2025
1. Unprecedented Valuations Across All Assets
Total global asset values: $450 trillion (4.5x global GDP)
Buffett Indicator: 195% (highest ever)
Shiller CAPE: 38 (higher than 1929)
2. Leverage and Derivatives
Total derivatives notional: $700 trillion
Margin debt: $935 billion (record high)
Corporate debt/GDP: 85% (record high)
3. Geopolitical Tensions
Active conflicts affecting supply chains
De-dollarization accelerating
Energy market fragmentation
4. Cryptocurrency Systemic Risk
$2.5 trillion COINBASE:BTCUSD and over $4T gross crypto CRYPTOCAP:TOTAL asset class that didn't exist in 2008
Interconnected with traditional finance via ETFs
Untested in true liquidity crisis
Part V: The Three-Stage Crisis Model
Stage 1: The Warning Shot (Now - Q4 2025)
Timeline: Next 1-3 months
Characteristics:
Deteriorating breadth (fewer stocks making highs)
Defensive rotation begins
TVC:VIX creeping higher
First 10% correction dismissed as "healthy"
Stage 2: The Liquidity Cascade (Q4 2025 - Q2 2026)
Timeline: 6-9 months
Characteristics:
Multiple failed rallies
"Buy the dip" mentality breaks
Margin calls cascade
All correlations go to 1
Targets:
TVC:SPX : 5,000-5,500
CRYPTO:BTCUSD : $50,000-70,000
TVC:GOLD : $2,200-2,400
Stage 3: Capitulation and Reset (Q2 2026 - Q4 2026)
Timeline: 6-12 months
Characteristics:
Forced selling exhaustion
Government intervention
Market clearing prices reached
Final Targets:
TVC:SPX : 3,700-4,500
CRYPTO:BTCUSD : $25,000-35,000
TVC:GOLD : Begins new bull market from $2,800
My Risk Management Framework
Position Sizing
Current Risk Asset Exposure: Reduce to 30% of portfolio
Cash: 50%
Precious Metals (Physical): 10%
Strategic Shorts: 10% (via puts and/or inverse ETFs)
Key Indicators to Monitor
Weekly Unemployment Claims: ECONOMICS:USUR Sustained moves above 250K
Credit Spreads: HYG/TLT ratio breaking below 4.5
Dollar Strength: TVC:DXY above 110 signals global stress
IG:BITCOIN Dominance: Below 45% indicates alt-coin capitulation
TVC:VIX Term Structure: Inversion signals immediate stress
Invalidation Scenarios
This bearish thesis would be invalidated if:
Unemployment reverses below 4%
Fed pivots to QE without crisis
Fiscal stimulus exceeds $2 trillion
AI productivity gains offset job losses faster than expected
Conclusion: Probability-Weighted Scenarios
Based on historical precedent and current conditions, I assign the following probabilities:
60% Probability: Significant correction (20-30% drawdown) beginning Q4 2025
25% Probability: Major crisis (40-50% drawdown) rivaling 2008
15% Probability: Continued melt-up through 2026 (Fed intervention success)
The risk/reward severely favors defensive positioning. After a 15-year bull market across all assets, the convergence of deteriorating fundamentals, extreme valuations, and historical crisis patterns suggests we're approaching a critical inflection point.
Remember: Markets can remain irrational longer than you can remain solvent. This analysis presents probabilities , not certainties. Always manage risk appropriately and never invest more than you can afford to lose.
Disclaimer: This analysis is for educational purposes only and should not be considered financial advice. Past performance does not guarantee future results. Always conduct your own research and consult with financial professionals before making investment decisions.
Follow for updates as this thesis develops. Key milestones to watch:
October NFP report
November FOMC meeting
Q4 earnings season
Year-end positioning
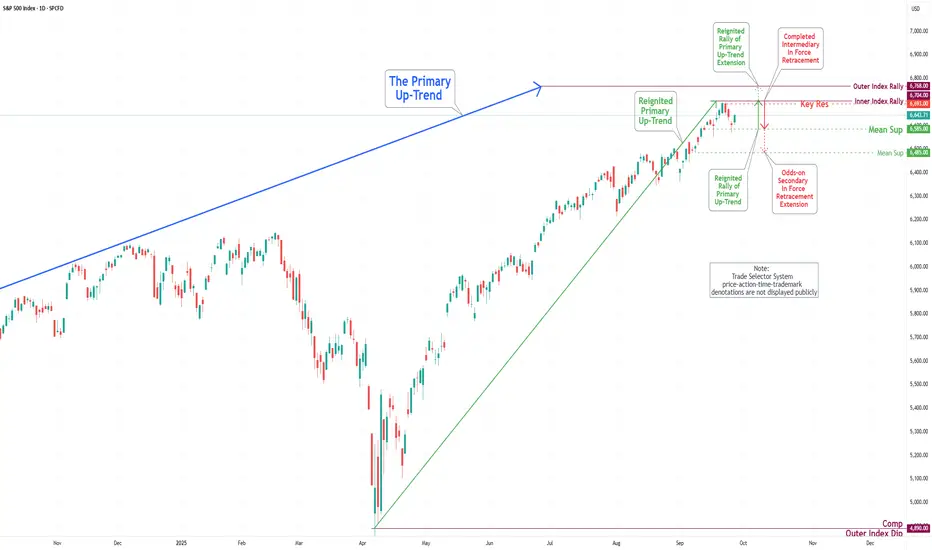
US500: 7K ASSAULT BEGINS! Mega Bull Flag Breakout 🚀 US500: 7K ASSAULT BEGINS! Mega Bull Flag Breakout 📊
Current Price: 6,646.2 | Date: Sept 27, 2025 ⏰
📈 INTRADAY TRADING SETUPS (Next 5 Days)
🎯 BULLISH SCENARIO
Entry Zone: 6,630 - 6,650 📍
Stop Loss: 6,590 🛑
Target 1: 6,720 🎯
Target 2: 6,780 🚀
🎯 BEARISH SCENARIO
Entry Zone: 6,670 - 6,690 📍
Stop Loss: 6,720 🛑
Target 1: 6,580 🎯
Target 2: 6,520 📉
🔍 TECHNICAL ANALYSIS BREAKDOWN
📊 KEY INDICATORS STATUS:
RSI (14): 61.2 ⚡ *Bullish Momentum Building*
Bollinger Bands: Coiling for Expansion 🔥
VWAP: 6,635 - Acting as Launch Pad 💪
EMA 50: 6,610 ✅ *Golden Cross Confirmed*
Volume: Institutional Accumulation 📊
🌊 WAVE ANALYSIS:
Elliott Wave: Wave 4 Triangle Complete 🌊
Target: Wave 5 Extension to 7,000+ 🎯
🔄 HARMONIC PATTERNS:
Bullish Butterfly at 6,600 Support ✨
ABCD Pattern targeting 6,780 🔄
⚖️ SWING TRADING OUTLOOK (1-4 Weeks)
🚀 BULLISH TARGETS:
Psychological: 7,000 🏆
Monthly Target: 6,850 🌙
Gann Resistance: 6,900 ⭐
📉 BEARISH INVALIDATION:
Weekly Support: 6,550 ⚠️
Critical Level: 6,480 🚨
🎭 MARKET STRUCTURE:
Trend: Ascending Triangle 💪
Momentum: Coiling Energy 🔥
Wyckoff Phase: Spring Loading 📈
Ichimoku: Bullish Cloud Break 🟢
🏆 MEGA PATTERN ALERT:
Bull Flag Pole: 6,400 → 6,700 📏
Flag Consolidation: 6,600-6,680 🚩
Breakout Target: 6,980 (300pt move!) 💥
⚡ RISK MANAGEMENT:
Max Risk per Trade: 1.5% 🛡️
R:R Ratio: Minimum 1:2.5 ⚖️
Breakout Confirmation: 6,690 close 📏
🌍 MARKET CATALYSTS:
Q3 Earnings Beating Expectations 📈
Fed Dovish Stance Supporting Risk-On 🏛️
Economic Resilience Narrative Strong 💼
🔥 KEY LEVELS TO WATCH:
Breakout Zone: 6,680-6,700 💥
Support Cluster: 6,620 | 6,580 | 6,550 🛡️
Resistance: 6,720 | 6,780 | 6,850 🚧
🎯 FINAL VERDICT:
S&P500 primed for EXPLOSIVE 7K RALLY! 🚀
Bull flag completion = 300+ point surge! 💯
Multiple timeframes align perfectly! 📈
Trade Management: Scale into dips above 6,620 💎
Breakout Alert: Watch 6,690 decisive close! 🔔
---
*⚠️ Disclaimer: High-risk trading. Use strict risk management. Educational analysis only.*
For individuals seeking to enhance their trading abilities based on the analyses provided, I recommend exploring the mentoring program offered by Shunya Trade. (Website: shunya dot trade)
I would appreciate your feedback on this analysis, as it will serve as a valuable resource for future endeavors.
Sincerely,
Shunya.Trade
Website: shunya dot trade
🔔 Follow for 7K Journey Updates | 💬 What's Your 7K Timeline?
EUR USD AUD NVDA MSFT AVGO S&P500 BTC XRP Weekly InsightsIn this video, we dive into the key market movements and outlooks for major financial instruments over the past week. Highlights include:
Analysis of currency pairs: EUR/USD and AUD
Trends and technical setups for leading tech stocks: NVDA, MSFT, AAPL, AVGO
The S&P 500’s performance and what it suggests about broader market direction
Developments in cryptocurrency, with a focus on BTC and XRP
Whether you’re a trader, investor, or just interested in macro markets, this video gives you a consolidated, data-driven snapshot of where things stand and what to watch next.

S&P 500 Daily Chart Analysis For Week of Sep 26, 2025Technical Analysis and Outlook:
During the aforementioned week's trading session, the S&P 500 Index experienced a notable decline after reversing near the Inner Index Rally level of 6704, which resulted in a vigorous drop to our designated Mean Support target of 6585. The index is currently moving towards the established Key Resistance target of 6693 and is positioned to fully complete the Inner Index Rally at 6704, presenting the potential for additional upward momentum that could extend to the Outer Index Rally level of 6768.
It is imperative to recognize, however, that upon reaching the Key Resistance target of 6693 and the Inner Index Rally at 6704 targets, we may observe a retest pullback toward the Mean Support level of 6585, with the possibility of a further decline extending to the Mean Support target at 6485.
S&P500 CHART UPDATE !!S&P 500 Analysis
The S&P 500 is trading near 6,650, moving strongly within its ascending channel.
Support: 6,400 – key level to hold for bullish momentum.
Resistance: 6,800 – a breakout could open the door toward 7,200.
The trend remains bullish, and staying above the midline keeps upside potential intact.
A breakdown below 6,400 may signal a short-term correction.

SPY WEEKLY 26 SEP 2025 This is the price action analysis for SPY . I have clearly discussed the levels and have touched on psychology side as well. If you have any doubts, feel free to leave a message.
NOTE: DONT TRADE AS OPTIONS AS MARKET IS ALL TIME HIGH

SPX500 – Markets Brace for GDP and PCE-Driven VolatilitySPX500 – Overview
More Fedspeak, More Questions
Wall Street points to a soft opening on Thursday as investors digest Fed Chair Jerome Powell’s caution on stretched equity valuations, a warning that injected a note of restraint after this year’s strong market rally.
Traders are bracing for high volatility, with a heavy lineup of Fed speakers today and key U.S. data releases ahead: the final estimate of Q2 GDP later today and the PCE inflation report tomorrow.
Stronger-than-expected GDP could dampen rate-cut expectations and pressure equities, while weaker data would support a more dovish outlook.
Technical View
The SPX500 remains in a range-bound setup, awaiting a catalyst for the next directional breakout.
Bearish Scenario:
A confirmed 1H close below 6,634 would signal a downside break, targeting 6,597 → 6,577.
Negative sentiment could accelerate if GDP prints stronger than expected, reinforcing a bearish bias.
Bullish Scenario:
Stability above 6,635 keeps price consolidating between 6,635 – 6,663.
A confirmed 1H close above 6,663 would trigger bullish momentum toward 6,698.
Key Levels
Pivot: 6,635
Resistance: 6,663 – 6,698
Support: 6,615 – 6,598 – 6,577
The SPX500 is poised for data-driven volatility. Watch GDP and PCE prints for a breakout cue:
Strong GDP → bearish break below 6,634.
Softer data → bullish breakout above 6,663.

ES Futures (SPX) - Analyses, Key-Zones, Setups - Thu, Sep 26News & catalysts (ET)
8:30 — PCE & Core PCE (Aug) , the Fed’s preferred inflation gauges. Market focus is on Core PCE ~2.9% YoY and ~0.2% MoM consensus.
10:00 — University of Michigan Consumer Sentiment (final Sep) . Scheduled time confirmed by
Fed speakers: Vice Chair for Supervision Bowman in a 10:00 discussion;
Fed Board’s Beth Anne Wilson remarks at 8:45 at a New York Fed conference.
Earnings/overnight tone: Costco (COST) reported FY Q4 results Thu after close; headlines can sway retail/consumer sentiment pre-open. Nike (NKE) is due Tue 9/30 after close (next week).
Bias:
Base case: Two-way trade into 8:30, directional break afterward.
If Core PCE ≤ 0.2% MoM or ≤ 2.8% YoY: risk-on; favor upside continuation through near-term supply toward 6700+.
If Core PCE ≥ 0.3% MoM or ≥ 3.0% YoY: risk-off; favor sell-the-rips into 6630 → 6605 ladder.
Secondary input 10:00: Michigan Sentiment can add a second impulse; weak sentiment keeps rallies fragile.
PA roadmap
Overnight: Expect balance inside 6655–6675 until 8:30. Liquidity likely pools above 6675 and below 6650 for the data sweep.
NY AM (09:30–11:00): Trade the post-8:30 acceptance: continuation if 15m structure accepts beyond a zone; fade if we get swift rejection back inside.
NY PM (13:30–16:00): Look for consolidation breaks toward untested AM extremes; avoid initiating inside mid-range chop.
Setups (Level-KZ Protocol 15/5/1)
A++ Acceptance Long (major)
Trigger: 15m full-body close above 6670–6675, followed by 5m pullback that re-closes above.
Entry: 1m HL after the 5m re-close.
SL: Below the 15m trigger wick −0.25–0.50 pts.
TPs: TP1 6705, TP2 6725, TP3 6760–6765.
Management: No partials before TP1; at TP1 close 70%, set 30% runner to BE; runner aims TP2→TP3. Time-stop 45–60m if neither TP1 nor SL hits.
Invalidation: 15m body back inside 6670 (acceptance lost).
A++ Acceptance Short (major)
Trigger: 15m full-body close below 6655, then 5m pullback that fails and re-closes below.
Entry: 1m LH after the 5m re-close.
SL: Above the 15m trigger wick +0.25–0.50 pts.
TPs: TP1 6631–6635, TP2 6605–6608, TP3 6580–6585.
Management: Same as above.
Invalidation: 15m body back above 6658.
SPX500 Bearish Breakout!
HI,Traders !
#SPX500 made a bearish
Breakout of the rising support
Line and we are bearish biased
Therefore, after retesting the sell cluster area
at 6643.11 So we will be expecting a Further
bearish move down !
Comment and subscribe to help us grow !

SPX is absolute in the garbage now! Great inverse playI've been saying this for a few weeks now and all those who bought at the top are now official bag holders. There's a lot more bleeding that will happen. First, SMA9 crossed (check), next we'll see aggressive drop crossing SMA50, maybe some consolidation, and if it drops below SMA200, we're in for some interesting times. Don't stress, here's your play.....check out CBOE:UVIX , CBOE:MSTZ for inverse plays. There's still some nice upside. When they say, don't sell, you sell otherwise you'll be exit liquidity! I've seen this way too many times. Best of luck!
Pull back tease, but still bearing SPX!There's a bit of a pull back taking place, but I'm not buying it! There's a lot of f&ckery taking place and no lipstick will make this pig look pretty. Fundamentals are weak and volatility is spiking, long overdue! Nice inverse plays CBOE:UVIX CBOE:MSTZ

S&P500 corrective pullback Recent moves: The S&P 500 (-0.36%) extended losses, still weighed by the AI-driven selloff earlier in the week. Futures have recovered about half of yesterday’s drop, but overall momentum looks paused.
Macro drivers:
US housing data + firmer oil prices dampened expectations for rapid Fed rate cuts.
This pushed Treasury yields higher, with a fresh steepening of the curve. 10yr yields are back near pre-payrolls levels (+10–15bps since the FOMC).
Today’s jobless claims are key after last week’s sharp drop, with tomorrow’s core PCE the bigger risk event.
Politics:
US government shutdown risks escalated, with the White House ordering contingency firings if funding lapses. Market anxiety may rise as deadlines loom.
Geopolitics in focus: Erdogan’s White House visit could bring defense deals (Boeing, Lockheed Martin) and NATO tensions remain over Russia.
Implication for S&P 500 trading:
Near-term tone is cautious, with yields back up and Fed easing hopes questioned.
Watch jobless claims for confirmation of labor resilience and core PCE tomorrow as the next major directional driver.
Shutdown risks add headline volatility, while defense sector stocks could outperform if US–Turkey talks deliver aircraft orders.
Key Support and Resistance Levels
Resistance Level 1: 6670
Resistance Level 2: 6700
Resistance Level 3: 6747
Support Level 1: 6550
Support Level 2: 6530
Support Level 3: 6500
This communication is for informational purposes only and should not be viewed as any form of recommendation as to a particular course of action or as investment advice. It is not intended as an offer or solicitation for the purchase or sale of any financial instrument or as an official confirmation of any transaction. Opinions, estimates and assumptions expressed herein are made as of the date of this communication and are subject to change without notice. This communication has been prepared based upon information, including market prices, data and other information, believed to be reliable; however, Trade Nation does not warrant its completeness or accuracy. All market prices and market data contained in or attached to this communication are indicative and subject to change without notice.

Hellena | SPX500 (4H): SHORT to support area of 6550.Colleagues, I am not much of a correction trader, but I have to share my opinion that the upward impulse has almost formed wave “5” and now it would still be logical to expect a correction.
I believe that first the price will update the local maximum in the resistance area of 6759, then we will see a correction in wave “4”, which I expect to see at least in the support area of 6550.
Manage your capital correctly and competently! Only enter trades based on reliable patterns!
