S&P500 Chasing a Retrace - Waiting for Equilibrium After Rally🗓️ Yesterday, I mentioned watching the S&P 500 for a retrace to find a potential long entry. But with the US-China tariff agreement announced, the market rallied hard 🚀—a clear positive for stocks. We didn’t get much of a pullback, and right now, I see the S&P 500 as overextended. I’m not looking to jump in at these premium levels. Instead, I’m waiting for a Fibonacci retrace back down into equilibrium on the current swing for a better opportunity. 👀
My plan: I’ll watch for a bearish break of structure to signal a retrace, then monitor price action as we approach support. If support holds and we get a bullish break of structure, that’s when I’ll look to get involved. 🔄
Just sharing my idea here—this isn’t financial advice! 📢
S&P 500 (SPX500)

We Have a Full Pattern into The Target BoxI am now looking for a 5-wave pattern to develop to the downside, followed by a 3-wave retrace, that in the coming weeks can take us back out of the Target box to the downside. Price must breach the 5578 area to give us any indication the pattern to the upside below is cracking.

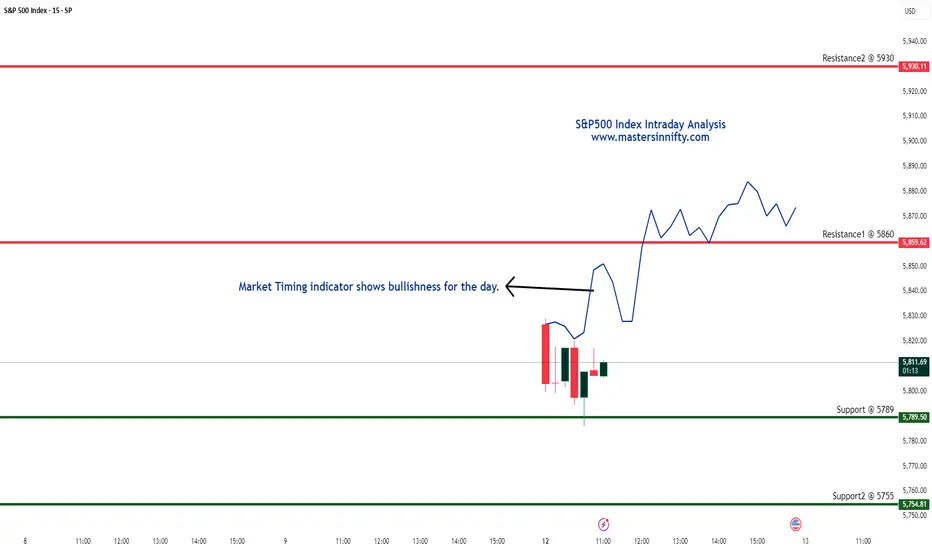
S&P500 Index Intraday Trend Analysis for May 12, 2025The S&P 500 Index is displaying bullish indications for the day. Key support levels are observed at 5789 and 5755, while resistance is expected around 5860 and 5930.
Please note, this is solely my personal view. Traders are advised to conduct their own technical analysis and ensure proper risk management before making any trading decisions.
$SPY still bearish unless $584 and trendline break as resistanceI'll be the first to admit that the rally has gone further than I expected. That said, everything on the chart still looks like this is a bearish rally and not a new bull trend.
Unless we can break the blue trend line and the strong overhead resistance between $581.63 and $583.57, I think the most likely scenario is we fall further and see one last leg down before we bottom.
I think the bottom will come between the lower supports at $409 and $538.
Again, invalidation of the bearish idea is a break and flip of the resistances above, the upside targets are on the chart as well.
Let's see what happens over the coming weeks.

Celanese Corp | CE | Long at $39.64Celanese Corp is another chemical company (like Dow Inc) crushed by tariffs and economic headwinds. It's dropped -78% in one year.... However, this is a very strong company with strong credit market interest and no immediate liquidity crisis. From a technical analysis perspective, this... like in 2008 and 2020... is the time to gather shares given it has reached the "abysmal crash" levels based on my selected simple moving averages. In the past, recovery to new highs has taken 1-2 years. History doesn't always repeat, but fear is opportunity in the stock market. If negative news continues to reign, a dip into the high $20's isn't out of the question.
If the company can squeak through 2025 and not continue to stack debt (debt/equity=2.43x), the growth opportunity into 2027-2028 looks promising.
I'm keeping my targets into 2026 low, but this could be a good buy and hold for the right investor.
Targets:
$47.00
$54.75

SPY/QQQ Plan Your Trade for 4-12 : Rally In CountertrendIn today's video, I try to highlight the TREND features in the SPY CYcle Pattern data window for all of you to use.
Yesterday, I received a comment from a friend/client asking about the strength in the markets compared to my expectations.
My answer was simple. The SPY Cycle Pattern data window shows Short-Term (ST), Long-Term (LT) trending as well as the Daily/Weekly Bias trends.
Traders should use these to determine the primary trend/direction of price action.
Additionally, I try to add my own thoughts/context related to the market setup/structure. That is where I teach you about the EPP/Cradle patterns and more.
Ideally, my analysis and the SPY Cycle Patterns align with the future price moves in a way that everyone can profit from the highest probability outcomes.
There are times when news or outside forces drive the market trend beyond my expectations and, in some cases, beyond the SPY Cycle Pattern predictions. This recent Trump-Pump rally may be one of those cases.
Either way, I continue to try to deliver the best technical analysis and research I can offer for followers.
Get some.
#trading #research #investing #tradingalgos #tradingsignals #cycles #fibonacci #elliotwave #modelingsystems #stocks #bitcoin #btcusd #cryptos #spy #gold #nq #investing #trading #spytrading #spymarket #tradingmarket #stockmarket #silver

S&P 500 WEEKLY Bullish Divergence According to this bullish divergence we have on weekly time frame for S&P 500, it can push to about $6800 and Bitcoin follows to new ATHs

Cautious Optimism: What’s Next for the S&P 500US500 My Outlook for the Next Week:
Given the relentless bullishness on the chart and the current backdrop, here’s how I see the next week playing out:
Short-Term: The S&P 500 may continue to consolidate or experience mild pullbacks as investors digest recent gains and await fresh catalysts. Sector rotation could create choppiness, especially if tech underperforms.
Catalysts: Watch for key economic data (inflation, employment, Fed commentary) and any major earnings surprises. These could trigger renewed momentum or a sharper correction.
Risk/Reward: The risk of a sharp correction is rising, but the underlying trend remains bullish unless there’s a significant negative surprise. A shallow pullback or sideways action would be healthy and could set up the next leg higher if fundamentals remain intact.
In summary: The S&P 500’s relentless bullishness is being tested by mixed sentiment and cautious analyst forecasts. Fundamentals are still supportive, but risks are rising. For the next week, expect consolidation or mild volatility, with the potential for renewed upside if economic data and earnings remain strong. Stay nimble, watch for sector rotation, and be prepared for both short-term pullbacks and longer-term opportunities.
Not financial advice.

SPY WEEKLY 12 MAY 2025Welcome to Spy weekly. I have tried my best to explain the price action here. If you have any doubts, feel free to leave a comment or DM me.
NOTESTAY AWAY FROM OPTIONS

SPX500 SLOWS DOWN AT BEARISH ORDER BLOCK!With SPX500 index slowing down at the bearish order block, the next trading week most likely will be bearish...
N.B!
- SPX500 price might not follow the drawn lines . Actual price movements may likely differ from the forecast.
- Let emotions and sentiments work for you
- ALWAYS Use Proper Risk Management In Your Trades
#spx
#spx500
#es

Weekly Market Forecast: Wait For BUYS! Stock Indices and GoldIn this Weekly Market Forecast, we will analyze the S&P 500, NASDAQ, DOW JONES, Gold and Silver futures, for the week of May12 - 16th.
The Stock Indices were sluggish last week, holding at support. Wait for a market structure shift to the upside to confirm buys.
Gold and Silver may move higher, as India and Pakistan, Gaza and Ukraine are increasingly troublesome.
CPI Data on Tuesday. This could be a strong market mover.
Enjoy!
May profits be upon you.
Leave any questions or comments in the comment section.
I appreciate any feedback from my viewers!
Like and/or subscribe if you want more accurate analysis.
Thank you so much!
Disclaimer:
I do not provide personal investment advice and I am not a qualified licensed investment advisor.
All information found here, including any ideas, opinions, views, predictions, forecasts, commentaries, suggestions, expressed or implied herein, are for informational, entertainment or educational purposes only and should not be construed as personal investment advice. While the information provided is believed to be accurate, it may include errors or inaccuracies.
I will not and cannot be held liable for any actions you take as a result of anything you read here.
Conduct your own due diligence, or consult a licensed financial advisor or broker before making any and all investment decisions. Any investments, trades, speculations, or decisions made on the basis of any information found on this channel, expressed or implied herein, are committed at your own risk, financial or otherwise.

S&P 500 Daily Chart Analysis For Week of May 9, 2025Technical Analysis and Outlook:
In the initial days of this week’s trading session, the S&P 500 Index exhibited a steady to low price movement pattern, successfully achieving a significant target at the Mean Support level of 5601, as indicated in last week’s Daily Chart Analysis. Subsequently, the Index experienced a robust rebound, effectively retesting the Mean Resistance level of 5692. This upward trajectory achievement established a reversal pattern for the downward acceleration to repeat the Mean Support level 5601 retest. However, it is critical to recognize the considerable risk of a sharp upward movement from the current price action, which may lead to an ascent toward the next Mean Support level of 5778. Furthermore, there exists the potential for additional escalation, potentially reaching the Outer Index Rally level of 5915 and beyond.

SPY (S&P500 ETF) - Testing Key Resistance Levels - Weekly ChartSPY (S&P500 ETF) is currently attempting an uptrend rally, bouncing up from the April 7th 2025 support level ($488) and weekly support trendline.
The current resistance price level is $569 above, and the support price level below is $555.
SPY price needs to remain and close above $522 in May 2025 to maintain the current uptrend rally.
Resistance price targets above: $569, $578, $600, $610.
Support price targets below: $555, $542, $533, $512.
Tariff and trade deal news, corporate earnings, government law changes, and consumer sentiment will continue to affect the stock price action of SPY.
Support price levels need to hold for an uptrend to continue in 2025.

S&P 500 Braces for a Drop to $5,100–$5,177: Correction Coming?S&P 500 Braces for a Drop to $5,100–$5,177: Is the Correction Coming?
SP500 Reached the target of $5,680 - $5,800 and is going into correction along with Bitcoin 🤔.
Before:
After:
➖ The S&P 500 could fall to the 5100–5177 range due to the following fundamental factors:
FOMC Meeting on May 7: Expected rate hold and potentially hawkish rhetoric from Powell could amplify fears of rate hikes, hitting growth stocks.
➖ Trade War: Uncertainty in U.S.-China negotiations and risks of new tariffs threaten supply chains and corporate profits.
➖ Weak Economy: GDP contraction (-0.3% in Q1), recession fears, and weak PMI data fuel pessimism.
➖ Corporate Earnings: Disappointing guidance from key companies (e.g., Apple, Tesla) could trigger sell-offs.
➖ Sentiment on X: Bearish sentiment reflects market caution.
➖ Global Risks: Retaliatory tariffs and rising gold prices signal a flight from U.S. assets.
Assumption: If the Fed on May 7 emphasizes inflation risks and delays rate cuts, and tariff news remains negative, the S&P 500 could break support at 5500 and reach 5100–5177 within 1–2 weeks, especially amid technical selling and market panic.

SPY/QQQ Plan Your Trade for 5-9 : Inside-Breakaway PatternI will be unavailable tomorrow morning to do my normal Plan Your Trade video at 5am. So, I'm delivering this video for all of you tonight to assist you with the SPY cycle pattern tomorrow.
As soon as I get my brother settled in for his surgery, I'll find a Starbucks and settle in to check on the markets.
This is a short video - so please understand the context of the markets may depend on what happens overnight.
Get some.
#trading #research #investing #tradingalgos #tradingsignals #cycles #fibonacci #elliotwave #modelingsystems #stocks #bitcoin #btcusd #cryptos #spy #gold #nq #investing #trading #spytrading #spymarket #tradingmarket #stockmarket #silver

SPY/QQQ Plan Your Trade Update : Finding Confirmation & MoreThis video will become the start of more advanced training videos to help all of you understand how to use your own skills/tools/resources to try to find the best opportunities.
As I state in the video, I will never tell you what to trade. EVER!
It is unethical and illegal. I'm not a broker or financial advisor.
I'm a software developer/trader and I like to try to unlock the secrets of the markets using price action and inference models (and more).
This video teaches you how to use my CRASH INDEX and the SuperTrend indicator as a way to develop better allocation and risk protection skills for your own trading.
Let's face it - trading is about developing a process to consistently GET PROFITS. It doesn't really matter if they are 10%, 20%, 30% or more. If you are able to consistently execute good trades and PULL PROFITS - you will grow your account- right?
So stop swinging for the fences. Learn to develop skills that keep you on the right side of these big trends.
It's not that hard.
In this video I try to teach you to use Daily, Weekly, 240 min, 120 min, 60 min, 10 min, and 5 min data using my Crash Index to help you learn to trade the SPY/QQQ.
The Crash Index is suited for the SPY/QQQ in most cases. There are instances where the Crash Index may reflect some type of counter-trend - so remember to use Fibonacci Price Theory on the underlying symbol (SPY or QQQ) as final confirmation.
And, remember to try to understand primary trending (longer-term trending) vs. short-term trending. If you are going to try to trade a "counter-trend" swing - cut your trade allocation down by 50-60% (or more). Counter-trend swings are usually going against the major/primary trend.
Anyway, watch this video once or twice. I hope it helps all of you understand and build your own skills to trade more efficiently.
The trick is to get it down to a process where you know how to allocate your capital and you know how to confirm/invalidate trade setups/triggers.
Once you get to that point - you turn into a trading machine. The only step of the process that is really difficult to handle/manage is the BOOK IT phase. If you book your profits early - you may feel bad about leaving profits out there you could have had. But, a PROFIT is a PROFIT.
And the goal of trading it to PROFIT more than you LOSE - right?
Get some.
#trading #research #investing #tradingalgos #tradingsignals #cycles #fibonacci #elliotwave #modelingsystems #stocks #bitcoin #btcusd #cryptos #spy #gold #nq #investing #trading #spytrading #spymarket #tradingmarket #stockmarket #silver

Beyond The Plan Your Trade Videos - Trading Algos/ConfirmationMany of you follow my morning Plan Your Trade videos - and I thank you for your loyalty and dedication.
The Plan Your Trade videos are specifically deigned to highlight my SPY/GOLD Cycle Patterns and, over the course of the past 9+ months, I've started trying to teach all of you Fibonacci Price Theory and the concept of the Excess Phase Peak pattern (and Cradle Pattern).
My goal is to teach you to learn to understand price structures, setups, and actions as a way to try to advance your technical analysis/trading skills.
There are so many others out there trying to teach you to use indicators and other types of analysis to try to identify trading opportunities/setups. Some work, some don't.
Technical analysis using Indicators, Elliot Wave, or other forms of predictive analysis/AI are only about 50-75% accurate at best (IMO). Nothing is 100% perfect.
After 35+ years of trying to unlock the secrets of price action to devise a 100% accurate trading system, the closest I have come is a system that generates about 65-75% accuracy - but still manages to take some losses.
I do believe I can find that 100% accurate system (hopefully before I die). But the reality is it is almost impossible to accurately predict price movement 10-20+ days in advance with any degree of accuracy.
Over the past few weeks/months, we've seen the SPY/QQQ move through various stages/phases.
Over the past 4+ weeks I've been warning of the broad-consolidation phase that is currently setup on the SPY/QQQ. I believe this huge consolidation range is very dangerous for traders and that extreme volatility will create lots of risk/opportunities for those capable of trading within this range.
But, at the same time, failing to take advantage of tools to help traders hedge, daytrade, or otherwise balance allocation/risk levels is something I really don't talk about much.
I like to say "I do the research - you make all the trading decisions".
This video highlights some of my advanced algos and how I use them, in conjunction with the EPP and other patterns, to try to gauge market opportunities vs. risks.
Trust me. I've learned not to GO BIG on trades over the past 20+ years because I've blown up a few accounts trying to get greedy.
Right now, I focus on trying to be on the right side of trends (if possible) and to balance my portfolio in 10-20% increments.
For example, if I believe GOLD is going to move higher, I may start out with a 5-10% allocation into GLD or UGL (start small). If that trade works and Gold starts to make a move higher, I may try to add a bit more to that initial trade. If it doesn't work out, I may try to add a little bit more at a better entry price level - but I focus on not letting that trade occupy more than 15-20% of my total portfolio.
That way, if I take a loss on the trade, it is a small loss compared to the overall account capital.
If I take a 50% loss on a 20% allocation - that is only a 10% loss on the TOTAL ACCOUNT SIZE.
Get it?
So, the reason for this video is to show you how you can still use technical strategies/indicators to try to confirm you intraday trading and swing trading opportunities. I like to use the SuperTrend strategy on charts to identify general trending.
I'm urging you to consider my Plan Your Trade videos as "one component" of your skillset. You need to use your own skills/techniques/analysis to try to manage risks vs. opportunities as you continue to trade.
I highlight some of my algos because they become another "component" of my analysis when I'm trading. If I don't see broad market capitulation related to Daily trending - then I try to stay VERY CAUTIOUS. If I do see some capitulation within my algos suggesting the markets are starting to trend upward or downward, then I may try to take advantage of that opportunity.
Ideally, the process of trading is to use everything you like and can rely on to help confirm you decision-making. Then, fall back to a efficient trade allocation process that attempts to limit your risk level.
The biggest mistake I see people make is to go ALL IN or TOO HEAVY into a trade thinking they can't lose. Yes, you can lose. So can I.
That's why it is important to contain risks and protect capital at all times.
I'll try to create another video showing you how I use the SuperTrend indicator to help confirm some of my intraday analysis for trades.
Get Some.
#trading #research #investing #tradingalgos #tradingsignals #cycles #fibonacci #elliotwave #modelingsystems #stocks #bitcoin #btcusd #cryptos #spy #gold #nq #investing #trading #spytrading #spymarket #tradingmarket #stockmarket #silver

SPY/QQQ Plan Your Trade For 5-8 : EPP & Cradle Pattern UpdateThis video highlights why I continue to stay very cautious of this upward price move in the US markets.
It also highlights that the current trend is BULLISH - not BEARISH. When I post the videos in the morning, I've been selecting BEARISH as the general trend because I believe the markets are going to roll over into a breakdown phase. Until that happens, though, the markets are in a BULLISH price trend - attempting to possibly break above the current Ultimate High.
This is more of an instructional video - trying to show you why I continue to urge caution related to trends and why I belive we may have many months to go before the US markets really start to make a bigger "exit trend" type of move (exiting this broad consolidation range).
The other thing this video should teach you is how to identify EPP and Cradle patterns more efficiently and how to use them.
Ultimately, everything I share with all of you is designed to help you understand price as the ultimate indicator.
If you can grasp these concepts and understand how each phase of price structure presents opportunities, then you should be able to time and execute your trades very efficiently.
As I've stated in the videos, because of family medical issues over the past 60+ days, I've moved away from daytrading and gone back to a 2-5+ week swing trading style.
Simply put, I'm driving all over the place taking care of my family, seeing doctors, and other stuff - so I can't stare at my PC/Phone while the markets are open.
I'm also taking very low risk trades. If I decide to get into a trade, I'm usually avoiding the SPY/QQQ and selecting some SPDR sector (or other ETF) that allows me to play the move I expect without risking a fortune doing it.
Anyway, I hope you enjoy this video. I'll probably create one more after this video posts.
Get some.
#trading #research #investing #tradingalgos #tradingsignals #cycles #fibonacci #elliotwave #modelingsystems #stocks #bitcoin #btcusd #cryptos #spy #gold #nq #investing #trading #spytrading #spymarket #tradingmarket #stockmarket #silver

SPX Continues to Rise After FOMC DecisionThe U.S. index has been gaining more than 2% in recent trading sessions, and the bullish bias has remained intact since the Federal Reserve’s decision during yesterday’s session. The central bank once again opted to keep the interest rate steady at 4.5%. However, according to some comments, Chairman Powell mentioned that the economy is approaching a point where it may soon be appropriate to begin cutting interest rates. This has fueled expectations of future rate cuts and has helped sustain confidence in equity indices over the short term.
Uptrend: Since April 9, a new short-term uptrend has been consistently forming, with price movements holding above the 5,000-point mark. However, the price is now approaching a key resistance level, and as long as this barrier holds, it could lead to short-term neutrality in recent price action.
ADX: The ADX line has been falling sharply in recent sessions and is now nearing the neutral 20 level. This indicates a lack of sustained volatility in recent price moves. If the ADX remains at these levels, it could reinforce a period of consolidation or range-bound movement in the short term.
RSI: The RSI line remains consistently above the neutral 50 mark, indicating that buying momentum still dominates in the short term. However, as the RSI approaches the overbought level near 70, this could open the door for short-term bearish corrections.
Key Levels:
5,750 points – Nearby resistance: This level coincides with the 200-period simple moving average. A breakout above this zone could strengthen the bullish bias and support a more sustained uptrend.
5,540 points – Nearby support: This level aligns with the 50-period moving average and may serve as a potential zone for bearish corrections to unfold.
5,370 points – Critical support: This level aligns with the short-term ascending trendline. A drop below this support could jeopardize the current bullish structure in the short term.
Written by Julian Pineda, CFA – Market Analyst

SPY/QQQ Plan Your Trade For 5-8 : Carryover PatternToday's Pattern is a Carryover pattern in Carryover mode.
After yesterday's FOMC news (unchanged), the markets are seeking a bit of direction. Bitcoin rallied and INVALIDATED a EPP Flagging pattern. In my opinion this suggests the SPY/QQQ may attempt to move a bit higher after the Fed decision.
Although, I still believe the global markets are reacting to uncertainty and tariff news within a very broad consolidation range. So, I'm cautious of trying to go ALL-IN on any long trades at the moment.
Until we break clear of the consolidation range, price could break strongly to the downside on news or geopolitical content. In reality, any type of big news could prompt a downward price move within an uptrend or a consolidation range.
It just seems as though the current global market environment is fraught with uncertainty - so I continue to stay cautious.
Gold and Silver pulled downward overnight. But I still believe metals will continue to rally - attempting to hedge against global risks.
With Bitcoin rallying a bit higher (still in consolidation) - let's see how the next few days play out.
I would be surprised if BTCUSD and the SPY rallied to new highs before the end of May. VERY SURPRISED given the status of the global markets.
But, the markets can stay completely irrational much longer than I can try to fight them. So we have to move WITH the markets - not against them.
Get some.
#trading #research #investing #tradingalgos #tradingsignals #cycles #fibonacci #elliotwave #modelingsystems #stocks #bitcoin #btcusd #cryptos #spy #gold #nq #investing #trading #spytrading #spymarket #tradingmarket #stockmarket #silver

S&P INTRADAY uptrend continuationMarket and Geopolitical Update
US–UK Trade Deal: Donald Trump announced a trade agreement with the UK, calling it the first of his promised deals. Details will be released by the White House.
Chipmakers Rise: The US plans to roll back some Biden-era AI chip export restrictions, boosting chip stocks. New rules are in development to better control foreign chip use.
Markets Rally: US stock futures climbed, Bitcoin neared $100,000, and the dollar strengthened slightly after the Fed signaled no rush to cut rates.
Corporate Struggles: Despite market optimism, companies continue to feel tariff pressure. Toyota expects a $1.3 billion hit, while Maersk downgraded its transport outlook.
India–Pakistan Tensions: Pakistan reported shooting down 12 Indian drones, escalating long-standing tensions. India’s Nifty 50 dropped 0.4%, and Pakistan’s KSE-30 fell 7%.
Key Support and Resistance Levels
Resistance Level 1: 5730
Resistance Level 2: 5780
Resistance Level 3: 5874
Support Level 1: 5580
Support Level 2: 5510
Support Level 3: 5440
This communication is for informational purposes only and should not be viewed as any form of recommendation as to a particular course of action or as investment advice. It is not intended as an offer or solicitation for the purchase or sale of any financial instrument or as an official confirmation of any transaction. Opinions, estimates and assumptions expressed herein are made as of the date of this communication and are subject to change without notice. This communication has been prepared based upon information, including market prices, data and other information, believed to be reliable; however, Trade Nation does not warrant its completeness or accuracy. All market prices and market data contained in or attached to this communication are indicative and subject to change without notice.

Bitcoin showing itself to be the STRONGEST ASSET right nowThsi is a VERY Bold statement but there is a saying that we need to understand
CHARTS NEVER LIE
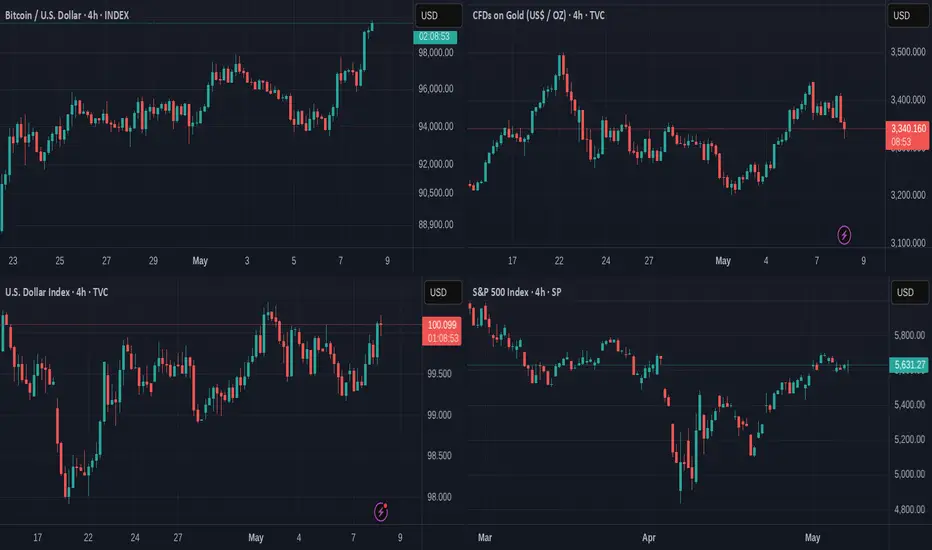
This chart is the 4 hour charts of
Bitcoin - Gold
DXY $ - S&P500
There are a number of things to see here.
The First and strongest sign is simply that Bitcoin has risen over the last 36 hours alongside the $ Rising.
This in itself is a huge sign. 80% of the time, these 2 assets go in opposite directions. To me, this is showing a weakness in Faith in the $,
With Lower interest rates, less return on Holding. However, the USa will not want to see the $ drop much further and so I imagine it is being bought up to safeguard its price.
Next week, on the 13th, we have inflation figures published.
We need to watch that Closely.
The $ is currently Lower than it has been for a long time and while this can be seen as a Negative, it has also made American goods cheaper to buy to Foreign Markets, while it has increased the value of other Currencies.
Making the $ cheaper is potentially a Good idea.
At the same time, we see the Global traditional "Safe Haven" Selling off.
The Daily CFD on Gold chart above it has formed a double Top, that usualy creates a draw down.
It is also overbought on a daily after its recent pushes higher.
But more than anything, with interest rates remainiiiiiiiiiiiiiiiiiing static, this has released pressure of investers and so Risk appetite is returning.
Again, we need to watch what happens around the 13th when USA inflation figures are released.
And then the S&P500
Overall, it has been dropping since Feb
This Daily chart shows us It made a recovery but this may not be to go to ATH again but more part of the ABC correction.
There is a possibility it could be forming an inverse Head and Shoulders...so, again, we watch
So, over all, what we see is BITCOIN taking on all the markets and making the biggest gains
It has certainly been the least volatile with Dips and Troughs shallower than the $ and S&P500 which is Stunning if you have ridden Bitcoin for the last 10 years....
Bitcoin has Matured in to a REAL Asset Class..
For me, it is NOT Crypto anymore.
.IT IS BITCOIN
US500 - Which way will the stock market go?!The index is trading above the EMA200 and EMA50 on the four-hour timeframe and is trading in its ascending channel. If the index moves down towards the specified demand zone, one can look for further S&P buy positions with a good risk-reward ratio.
In its meeting last night, the U.S. Federal Reserve decided to keep the federal funds rate steady within the 4.25% to 4.50% range. This decision comes amid growing concerns about simultaneous rises in inflation and unemployment, particularly driven by the tariff policies of the Trump administration.
This marks the third consecutive time this year that the Fed has held rates unchanged, reflecting mounting economic uncertainty and fears of stagflation.Fed Chair Jerome Powell warned that the combination of high inflation, slow economic growth, and rising unemployment could lead the economy into stagflation. He noted that newly imposed tariffs could delay the disinflation process for up to a year or more.
The Trump administration has introduced steep tariffs, including a 145% levy on imports from China. These measures have contributed to rising prices and slower economic growth, placing additional strain on monetary policymakers.
Following the Fed’s announcement, stock markets exhibited volatility. The S&P 500 initially fell but ended the day higher. Bond yields declined, while the U.S. dollar strengthened.
Powell emphasized that future monetary policy decisions will be heavily data-dependent, and the central bank stands ready to act swiftly if necessary. He acknowledged that the economic outlook remains uncertain, requiring cautious and adaptive policy management.
Faced with escalating uncertainty and inflationary pressures stemming from new trade measures, the Fed has adopted a cautious stance. Given the current mixed economic indicators, the central bank is expected to maintain its interest rate policy until the economic picture becomes clearer.
Economists at Goldman Sachs have issued a warning that U.S. inflation is on the rise and may reach 3.8% by the end of 2025. According to their analysis, the weakening of the U.S. dollar and the implementation of tariff policies are the main drivers of increased inflationary pressure. Additionally, changes in import demand could elevate production costs and further intensify price increases.
The Wall Street Journal reported that new tariffs may raise the prices of smartphones and laptops by up to 30%. Contrary to popular belief, this inflationary impact may not be temporary and could result in sustained upward pressure on prices.
Meanwhile, ahead of the FOMC meeting, Alphabet (Google’s parent company) saw its stock plunge over 8%, falling to $149.50. Eddy Cue, a senior executive at Apple, disclosed that for the first time in April, user activity on browsers and search engines had declined. In response, Apple is exploring the integration of AI-powered search into its browsers—a move that could pose a serious threat to Google’s advertising revenue.
Simultaneously, President Trump announced he would not enforce the AI content restriction law, initially introduced during the Biden administration and scheduled to take effect on May 15. This decision comes just before his trip to the Middle East, where countries like Saudi Arabia and the UAE have voiced frustration over chip access restrictions.
Trump administration officials are currently drafting new legislation aimed at tightening control over the export of advanced chips. This initiative may form part of a broader agreement, as the UAE has pledged to invest up to $1.4 trillion in U.S. technology and infrastructure over the next decade.
