NIFTY WEEKLY OUTLOOK: HOLDS 26000, EYES ON 26277–26600Nifty closed at 26068, staying firmly above the key psychological level of 26000. The index made a high of 26246 and a low of 25856, again respecting my broader range of 26400–25400.
Bias: Bullish above 26000, cautious below 25850.
If Nifty sustains above 26000, upside continuation towards 26277 (ATH), 26492 (important Fibonacci level), and 26600 remains possible.
Below this week’s low of 25856, weakness can extend towards 25600.
Expected range for the coming week: 26600–25600 .
Sector View:
Last week I highlighted strength in PSU Banks, Private Banks, Auto, and Metals.
PSU index gave up early gains and closed flat. Auto ended the week 1% higher, showing sustained momentum. Metals fell 3% and closed at the weekly low, signalling pressure.
For Nifty to move higher, PSU and Private Banks along with Auto must remain strong. Metals need to avoid fresh weekly lows to prevent broader drag on sentiment.
BANKNIFTY WEEKLY OUTLOOK: STRONG CLOSE BUT WITH CAUTION
BankNifty posted an all-time high weekly close but formed a shooting star candle, indicating possible exhaustion.
If BankNifty sustains above 59267, it can extend towards 60087 (important Fibonacci level).
Below 58600, downside may open towards 57800–57700.
Expected range: 60000–57700.
S&P 500 WEEKLY OUTLOOK: WATCH FOR MONTHLY PATTERN CONFIRMATION
S&P500 closed at 6602, down 130 points from last week.
If the index sustains above 6700, the uptrend can resume towards 6840, 6881, 6930, and 7000.
However, if the monthly candle confirms a bearish engulfing pattern, a 10–14% correction from current levels becomes possible. Traders should consider hedging long positions.
Overall Market View:
Nifty is holding above a critical level and remains positioned for a breakout if sectors align. BankNifty needs confirmation above 59267 for further upside. Global cues from S&P500 will be important as a bearish monthly pattern could impact risk sentiment.
S&P 500 (SPX500)

$SPX: dead cat bounce SP:SPX : Following the unexpected downturn on Thursday, SP:SPX stabilized last Friday after an intraday decline below the horizontal support at 6,550, which aligns with the 100-day simple moving average (SMA). The candlestick wicks on the daily chart suggest a potential short-term pause in the prevailing selling pressure. Monday will probably see a continuation of the rebound from Friday’s lows; however, it remains unclear whether Friday’s low marks the end of the current pullback. The RSI14 is approaching, but not yet within, oversold territory, and does not exhibit positive divergence. For the upside scenario, retracement levels from Friday’s high have been identified. Bulls must first reclaim the 6,530 resistance to maintain momentum; nevertheless, unless the key resistance at 6,770—168 points above Friday’s close—is breached, the probability of another downward move remains elevated, targeting the 6,360–6,340 region.
E mini S&P 500 weekly outlook and HTF reference pointsCME_MINI:ES1!
Expansion levels on ES. Will approach on a day to day basis with the daily closures

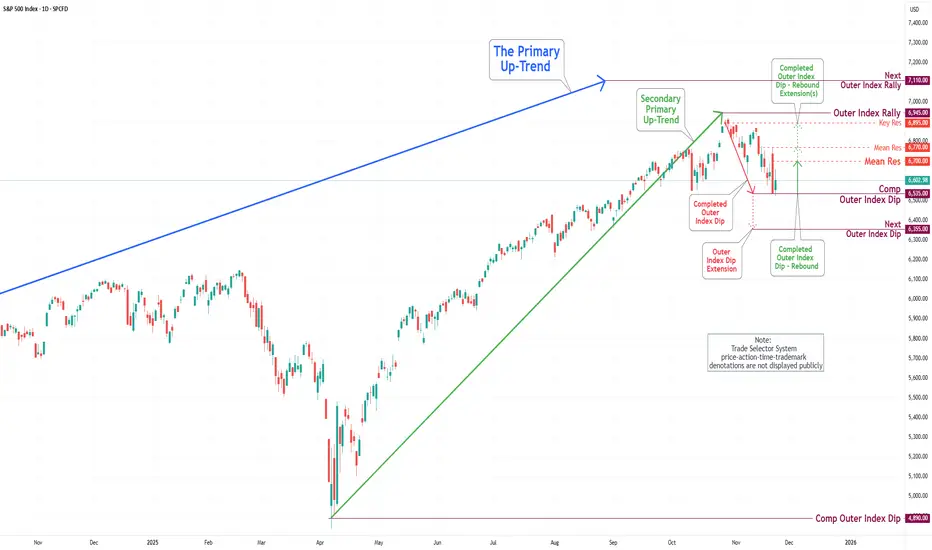
S&P 500 Daily Chart Analysis For Week of Nov 21, 2025Technical Analysis and Outlook:
In the last trading session, the S&P 500 Index exhibited significant gyrations, implying a pump-and-dump scenario and highlighting the significance of our completed Outer Index Dip at 6,535.
At present, this position suggests the possibility of further upward movement, with the primary targets established at the Mean Resistance levels of 6,700 and possibly 6,770. Furthermore, there exists a well-defined extension towards the Key Resistance level of 6,895, with an ultimate target for the Outer Index Rally set at 6,945.
Nonetheless, it is imperative to acknowledge the risk of a potential drawdown in the forthcoming trading session. Such an event could result in prices retesting the completed Outer Index Rally at 6,535, as well as the expansion towards the next Outer Index Rally at 6,355.
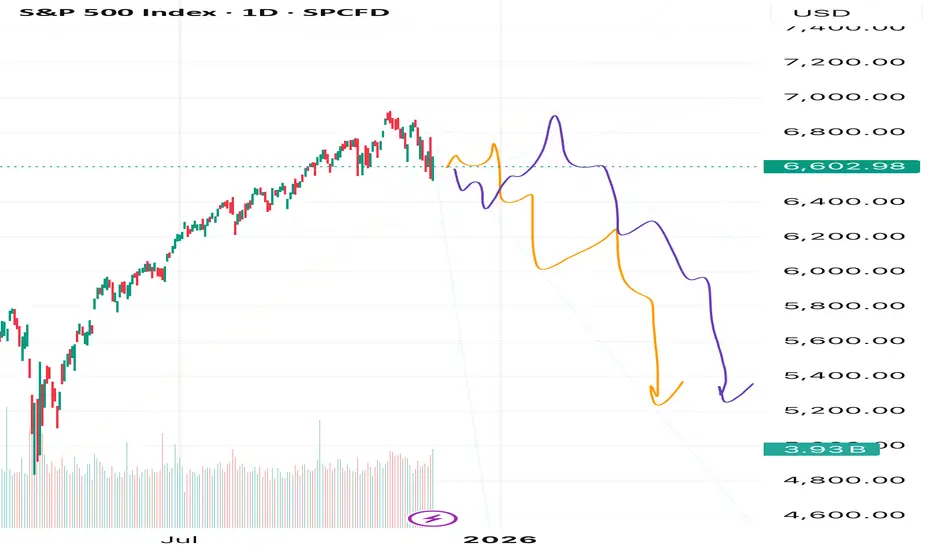
A Historic Shift in the S&P 500 Is BeginningFriends, in my view, the unstoppable rally in the S&P 500 has finally come to an end. The market has completed a massive five-wave structure with an extended fifth wave — and now we’re witnessing a historic moment as an exceptionally large correction begins.
As always, I’m watching two possible scenarios: the orange path and the purple path. But despite their differences, both point to the same outcome — my target at 5200. And that’s only the first target out of several.
Make sure to follow and subscribe, so you don’t miss the upcoming updates and deeper breakdowns.
This is just my personal market outlook — not financial advice. More updates coming soon.
You Not Mess This [weekly analysis Nov. 24-28th 2025]Get ready for a deep dive into the key market moves, upcoming catalysts, and trade ideas you can’t afford to miss. In this week’s edition we’ll cover:
EURUSD BTc S&P500 AUDNZD AUDNZD GBPCAD
AMZN MSFT FTSE
🔔 Don’t forget to subscribe and hit the bell so you never miss a weekly breakdown.
📣 Share your thoughts in the comments: What are you bullish/concerned about this week? What setups are you watching?

Barchart says SPY had a nice bounce on the 100MA... uhhhh..So yeah, Barchart posted on FB with a screenshot of a "nice bounce" on the S&P500.
Firstly, that wasn't much of a bounce at all with the weekly closing not far from the point of impact on the 100-day moving average.
Secondly, this is just retail thinking and not considering the entire context of where the market wants to go in terms of liquidity, efficiency, and fair value.
Let's dive a bit deeper into how price REALLY moves.
- R2F Trading

SPX - Hours Of Work To Buy 1 ShareHours of work needed to buy just one share of the S&P 500 just hit a new all-time high: 187 hours.
That’s:
150% more work than 2007
60% more than pre-COVID (2019)
10% more than “Liberation Day”
As I tell my kids:
Don’t look at the price tag.
Look at how many hours of your life — your blood, sweat, and effort — it takes to buy the thing.
Then decide if it’s actually worth it.
When the amount of work required keeps rising while what you get keeps shrinking, that’s not “innovation” or “AI magic.”
That’s over-speculation.
Buffett said it best:
Price is what you pay. VALUE is what you get.
Everyone screams about the price going up…
but nobody asks whether the VALUE justifies the hours of work required to own it.
That’s the truth — not the narratives.
THANK YOU for getting me to 5,000 followers! 🙏🔥
Let’s keep climbing.
If you enjoy the work:
👉 Boost
👉 Follow
👉 Drop a solid comment
Let’s push it to 6,000 and keep building a community grounded in truth, not hype.

S&P500 H4 | Bearish Reaction off Key ResistanceMomentum: Bearish
Price is currently below the ichimoku cloud.
Sell entry: 6,706.19
- Strong pullback resistance
- 61.8% Fib retracement
- 100% Fib projection
Stop Loss: 6,790.06
- Swing high resistance
Take Profit: 6,602.91
- Swing low support
High Risk Investment Warning
Stratos Markets Limited (tradu.com/uk ), Stratos Europe Ltd (tradu.com/eu ):
CFDs are complex instruments and come with a high risk of losing money rapidly due to leverage. 70% of retail investor accounts lose money when trading CFDs with this provider. You should consider whether you understand how CFDs work and whether you can afford to take the high risk of losing your money.
Stratos Global LLC (tradu.com/en ): Losses can exceed deposits.
Please be advised that the information presented on TradingView is provided to Tradu (‘Company’, ‘we’) by a third-party provider (‘TFA Global Pte Ltd’). Please be reminded that you are solely responsible for the trading decisions on your account. Any information and/or content is intended entirely for research, educational and informational purposes only and does not constitute investment or consultation advice or investment strategy. The information is not tailored to the investment needs of any specific person and therefore does not involve a consideration of any of the investment objectives, financial situation or needs of any viewer that may receive it. Past performance is not a reliable indicator of future results. Actual results may differ materially from those anticipated in forward-looking or past performance statements. We assume no liability as to the accuracy or completeness of any of the information and/or content provided herein and the Company cannot be held responsible for any omission, mistake nor for any loss or damage including without limitation to any loss of profit which may arise from reliance on any information supplied by TFA Global Pte Ltd.

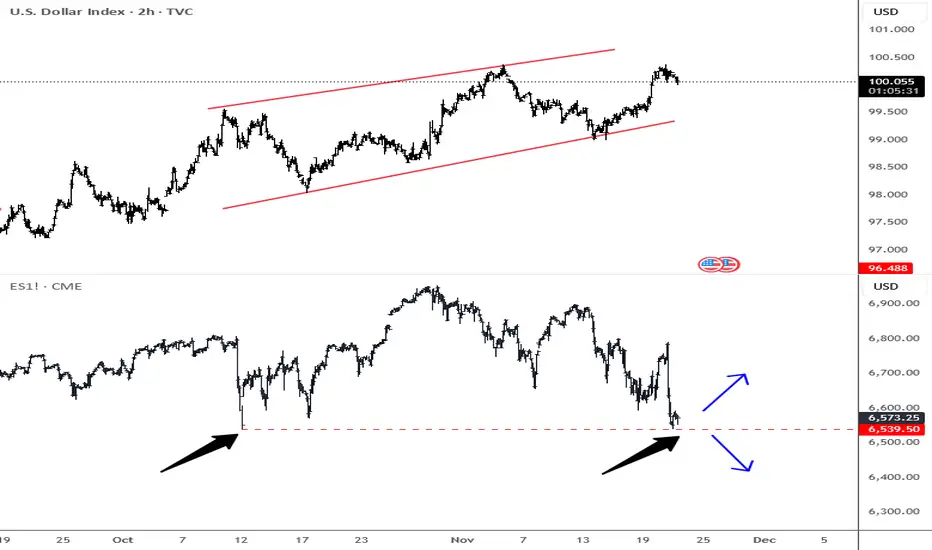
SP500 Testing Do-Die Support Stocks are seeing a pretty strong and aggressive decline, interestingly right after Nvidia delivered earnings that beat expectations, so it looks like the market still wants to move lower as AI-related valuations in the tech sector are simply too high and the market needs a deeper retracement. What stands out is that the S&P 500 has now retraced perfectly back to that October 10th Friday gap, when we saw a massive 3.5% sell-off in just one session, so I’m wondering if this zone could act as an interesting support for a potential rebound.
Keep in mind that despite the weakness in stocks over the last few sessions, we are not seeing that much strength on the dollar as you would normally expect in risk-off; so if stocks rebound the dollar could also slow down, ideally around 100.35–100.65 where the upside could be limited at the upper side of a wedge formation. I really want to see how the market will close today, because if we get a positive reaction in stocks then we may have some reason for a bounce next week, but if not and the market fails to recover today, then I’m afraid we can see much lower levels on the S&P 500 while DXY invalidate the diagonal formation.
S&P500 crashes! Due relief rally or further pain?Nvidia delivered impressive earnings, but the stock reversed and closed nearly 3% lower, triggering heavy selling across tech and risk assets as odds for a December rate cut have collapsed to just 34%, with policy uncertainty amplified by the cancelled October NFP report. Despite a strong market and rising unemployment in September's NFP report, traders remained defensive and fuelled the declines.
Key drivers:
Nvidia beat earnings, but post-report selling intensified sector losses.
The Fed’s odds for a December rate cut have dropped to 34%, amplifying caution.
The abrupt cancellation of the October NFP means the market lacks fresh labour data, fuelling defensive positioning.
S&P 500, Nasdaq, and Bitcoin broke major supports, confirming risk-off conditions.
Right now, the S&P 500 has broken below channel support near 6,600 and failed to climb back in. If prices stay below this threshold, expect another sharp move lower targeting 6,500 and possibly 6,350. There’s potential for upside, given momentum divergence on the RSI 4-hour chart. If we see a short-term bounce and a return to the channel, a move toward 6,682 is possible, which sets up a tactical short opportunity.
Trade idea:
Entry: Midpoint of 23.6/38.2 Fibonacci (6,655–6,682 area)
Stop-loss: Above 61.8% Fib (6,775)
Take Profits: TP1 6,500 (recent low/support), TP2 6,440 (major support), TP3 trail stop to 6,170 (long-term support)
Risk-off drivers are in control. Earnings reversals, Fed uncertainty, and cancelled NFP data are fuelling this price action. Technically, it comes down to whether we see a return inside the channel for a relief bounce or a sharp continuation downward.
Watch your levels, remain nimble, and let fundamentals and technicals, not emotions, guide your trade.
Let me know your setups in the comments, and follow for more high-action technical and macro trade ideas.
This content is not directed to residents of the EU or UK. Any opinions, news, research, analyses, prices or other information contained on this website is provided as general market commentary and does not constitute investment advice. ThinkMarkets will not accept liability for any loss or damage including, without limitation, to any loss of profit which may arise directly or indirectly from use of or reliance on such information.

Hellena | SPX500 (4H): LONG to resistance area of 6775.Dear colleagues, according to the last forecast the price is at the support level, but as it turned out, the correction in wave “4” is a bit more complicated than I thought.
Wave “4” consists of three waves “ABC” and should be over soon. The upward movement is still in priority, but I will target the not so distant resistance area of 6775.
Once it is reached, we will think about how to reach higher levels.
Manage your capital correctly and competently! Only enter trades based on reliable patterns!

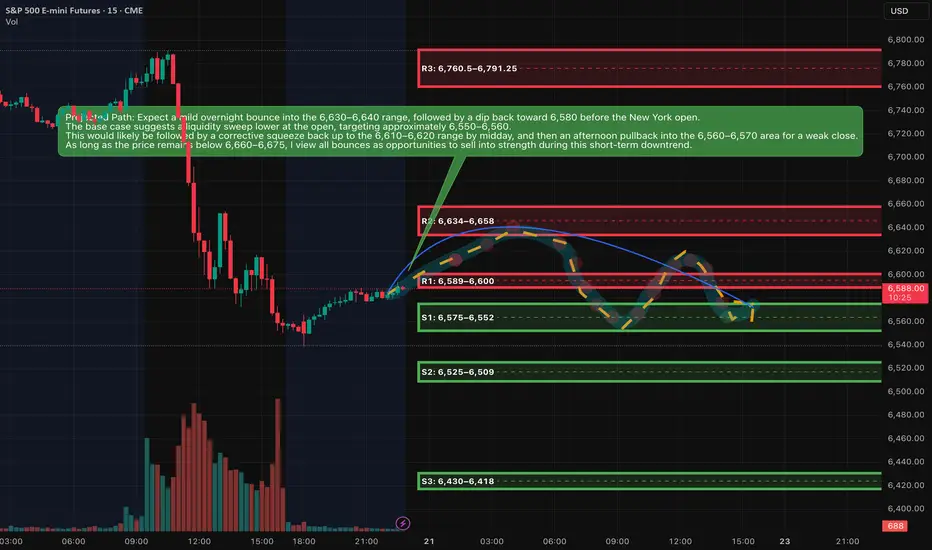
ES (SPX, SPY) Analysis, Levels, PA Forecast, Setups Fri (Nov 21)Analyzing Today’s Sharp Market Decline
The significant selloff observed today was not an arbitrary event. The day began with a robust rally following another impressive earnings report in the AI-chip sector, which propelled futures sharply upward and triggered a short squeeze in the Nasdaq. However, the release of a stronger-than-anticipated jobs report shifted the market's sentiment. While hiring showed signs of rebounding, the unemployment rate also ticked higher, undermining the prevailing narrative that the Federal Reserve would soon lower interest rates.
This development served as a stark reminder of the ongoing restrictive monetary policy, coupled with slowing economic growth and exorbitant valuations in the tech sector. Major investment funds capitalized on the morning’s strength in AI and large-cap stocks as an opportunity to reduce their risk exposure. Additionally, systematic trend-followers faced compulsion to sell once the S&P 500 fell below critical support levels.
The environment for high-beta assets, including cryptocurrencies, is already in a “reset” phase, which left little incentive for dip-buying at lower price points. As the E-mini S&P 500 futures broke through the previous day’s support levels, the situation escalated into a full liquidation. This perfect storm involved trapped long positions from the morning breakout, stop-loss orders falling into execution beneath yesterday’s lows, and mechanical selling, culminating in the largest intraday reversal since the spring.
Market Outlook
The current market sentiment is skewed bearish as the ES remains entrenched below the critical 6,660 to 6,700 range. The price is hovering near a significant demand zone established around the lows of the previous trading day and today’s New York session. While we can expect some upward bounces, these movements appear to be temporary rallies within an ongoing downtrend, rather than indicators of a potential new upward leg.
Market Analysis: Is This the Beginning of a Downtrend or a Temporary Shakeout?
In the recent developments within the E-mini S&P 500 (ES) on the daily timeframe, we’ve observed the formation of a distinct lower high following the recent all-time peak. This shift has seen prices breach the last identified higher-low area, establishing a new narrative. The sequence has transitioned from a higher high to a lower high, culminating in a movement into prior demand zones marked by increased volume, all while momentum appears to be rolling over.
On the four-hour chart, the prevailing trend reflects a series of lower highs and lower lows. The recent selloff has further entrenched this trajectory into the discount zone, now signaling proximity to the next Fibonacci retracement target below.
While momentum indicators have already dipped from overbought conditions, they have not yet reached deeply oversold thresholds, indicating potential for another leg downward following any short-term corrective bounce.
From a broader perspective, the long-term trend remains positive; however, a short- to medium-term corrective phase appears to be in play. Today’s market dynamics suggest we may be in the midst of this corrective leg rather than witnessing the final downturn.
As prices have recently entered a significant demand zone, a bounce lasting one to three sessions—or a period of sideways consolidation—seems likely before any potential further decline.
In summary, while current conditions favor a move towards lower prices in the days ahead, the market likely anticipates a "lower after a bounce" scenario rather than an immediate and steep decline.
Key resistance zones
Resistance is written as bands, not single ticks.
R1: 6,589–6,600
This band sits around the current Asia-session high and the underside of today’s New York low. It is the first lid above price. If rallies stall here, the tape stays heavy and favors another test of the lows.
R2: 6,634–6,658
This is the main breakdown zone from today, centered around the New York afternoon high and the upper edge of the late-session range. As long as ES trades below this shelf, the short-term downtrend remains intact and every bounce is suspect.
R3: 6,760.5–6,791.25
This band covers the New York morning low-to-high range and the origin of the big sell leg. If price ever retests this area and fails, it is a prime region for larger swing shorts. Only sustained trade and closes above this pocket would suggest the current corrective leg is ending.
---
Key support zones
S1: 6,575–6,552
This is the immediate floor combining the Asia-session low, New York afternoon low, and prior-day value low. It is where we are effectively trading now. Expect reactive bounces and stop-runs here, as both sides are active.
S2: 6,525–6,509
This is the next downside magnet if S1 breaks cleanly. It aligns with a fib extension and 4-hour demand. A decisive move into this region would represent the next step down in the correction.
S3: 6,430–6,418
Deeper extension and prior higher-timeframe demand. If the correction matures into a more serious pullback over several sessions, this pocket becomes a reasonable medium-term downside destination.
A++ Setup 1 – Short from R2 supply (continuation short)
Direction: Short
Entry zone: 6,638–6,648
SL (hard stop): 6,678
TP1: 6,588
TP2: 6,552
TP3: 6,515
Invalidation (structure):
If we get a 15m full-body close above 6,675, treat the short idea as invalid and stand aside; market is likely shifting into a squeeze toward 6,700+ instead of extending the down leg.
---
A++ Setup 2 – Quick-reclaim long from S1 demand (counter-trend bounce)
Direction: Long
Entry logic: need a flush then reclaim
Entry zone (after reclaim): 6,562–6,568
SL (hard stop): 6,538
TP1: 6,610
TP2: 6,638
TP3: 6,660
Invalidation (structure):
If price breaks below 6,552 and 15m closes stay below 6,545 without a fast reclaim, the bounce idea is invalid; then you wait for the deeper S2 zone instead of forcing longs here.
Good Luck !!!
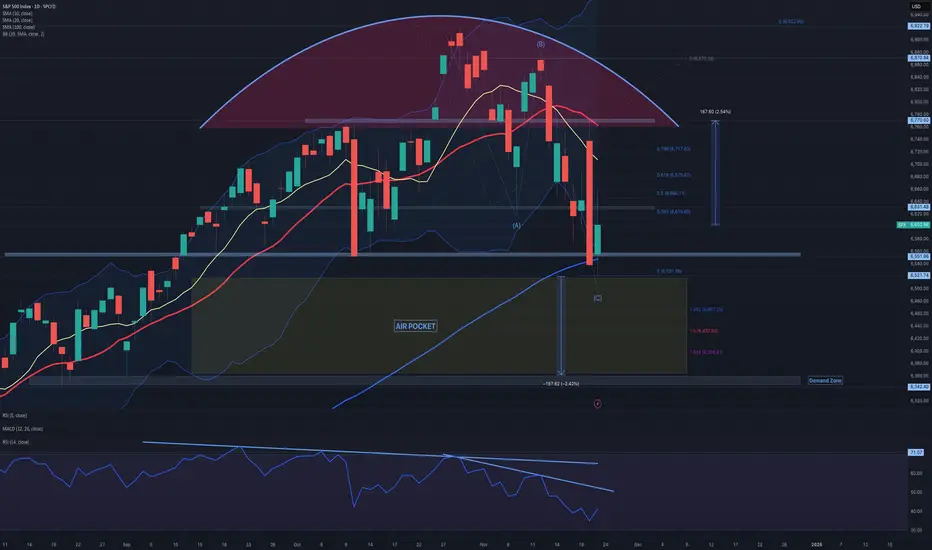
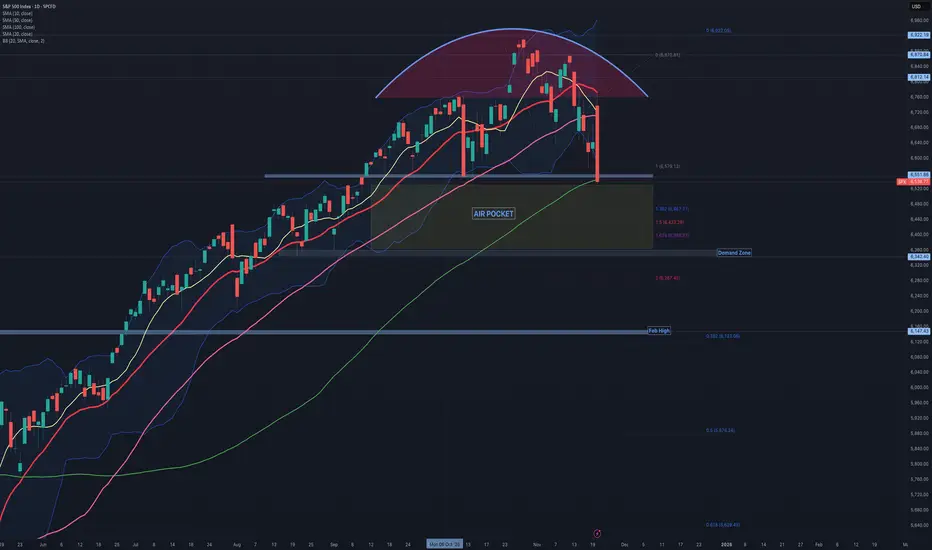
$SPX: A worrying Intraday Turnaround!While everyone, even the taxi driver, was celebrating NVDA's positive earnings report, the SP:SPX suddenly reversed. After touching the 20-day simple moving average, it dropped sharply with no buyers stepping in. With a 3.5% swing between the intraday high and low, the SP:SPX closed slightly below the horizontal support level at 6,550 and the 100-day moving average.
It's unfortunate that the right shoulder is missing, as it would otherwise form a perfect head and shoulders pattern—though it might be more accurately described as the head of a one-armed head and shoulders. Jokes aside, the technical outlook for the SP:SPX has significantly deteriorated. The market's bullish sentiment has evaporated, making it more challenging to establish a bottom.
If the S&P 500 doesn’t recover and consolidate support around 6,550 by Friday—an extremely important level that also aligns with the 1:1 extension below—we could face an “Air Pocket” of approximately 175 points. Within this Air Pocket area, we have extensions at 1.382, 1.5, and 1.618. The 14-period RSI is approaching oversold conditions, but it's not quite there yet.
The end - 2026 Financial panicSince 2300, I’ve marked a zone and made a personal commitment: no matter what happens in the market, when this zone is approached, I will begin reducing my exposure and carefully exit all financial markets—with extreme caution and tight stop losses.
Yesterday, I received an alert I never expected to see. It signaled the approach of the zone I identified back in 2021 as the escape point—where major crashes are likely imminent and the urge to invest must be resisted.
This zone aligns with the 0.786 trend-based Fibonacci level from the 2009 bottom to the 2020 peak, as well as the April 2020 bottom. It also coincides with the 2.618 and 3.618 Fibonacci extensions from the 2007–2010 cycle, and the 3.618 trend Fibonacci from the 2002–2009 cycle. But that’s not all.
According to Gann’s Square of 9, if you examine closely, you’ll notice that whenever the trend reaches one of its primary or secondary angles since the 2009 bottom, it consistently triggers a significant drop. The end cycle at the 360° angle corresponds to 7926—perfectly aligning with all the previously mentioned Fibonacci zones.
And for those skeptical of technical analysis, consider this: the upcoming year, 2026, is a pivotal year in the Samuel Benner chart developed in 1875 to identify periods of financial disorder. Benner’s chart indicated when to buy, when to sell, and when to expect chaos. Remarkably, it has accurately forecasted major financial crashes over the past 150 years—including the Great Depression, the Dot-Com bust, and the 2020 COVID crash. According to this chart, selling during the crash year and re-entering post-crash has historically led to profitable outcomes with a +-2 Years at a 87.5% accuracy.
When you combine all these signals, it feels reckless not to take them seriously—especially since this marks the end of a cycle measured from 2009. That’s how significant it is.
To those who dismiss technical analysis, this may sound like smoke and mirrors. But for those who’ve seen its power firsthand, the sheer number of confluences here is too substantial to ignore. If I know such big crash may happen - I would be happy to wait 1-2 years on cash and take opportunity of big red markets to buy.
Curious to hear your thoughts on this.

SPX500 ShortHello traders,
I am expecting the SPX500 to see a potential 20% correction. Current sentiment appears mixed while valuations remain elevated, which increases downside risk. This view also aligns with the technical setup:
On the weekly timeframe, price is respecting a well-defined channel.
On the daily timeframe, a double-top pattern has just formed, suggesting possible trend exhaustion.
Not financial advice, just sharing my market perspective.

Day 74 — Surviving a 242-Point Crash MoveEnded the day +$450.40 trading S&P Futures, but I’m walking away feeling tilted despite the profit. We sniped the 48-minute MOB resistance right out of the gate—just as planned in last night’s video—but I never expected the market to flush 242 points from top to bottom. That is a "market crash" level move. My P/L was a complete rollercoaster, swinging from +$400 to negative and back again. I’m grateful to end green, but after a session this volatile, I’m likely locking my account and taking a mental break tomorrow.
🔑 Key Levels for Tomorrow
Above 6725 = Bullish Below 6710 = Bearish
📰 News Highlights
BITCOIN FALLS 3% TO $87,000, LOWEST SINCE APRIL

Ray Dalio’s bubble warning aged fast today Ray Dalio’s warning not to “sell just because there’s a bubble” didn’t land today as a delayed September jobs report showing 119,000 new jobs cut into hopes of a December Fed rate cut.
The S&P 500 swung from a 1.9% gain to a 1.1% loss, and the Nasdaq flipped from up 2.6% to down 1.5%. The S&P 500 chart now shows declining momentum with lower highs forming. That kind of engulfing behaviour can mark exhaustion phases in extended rallies.
Bitcoin also unraveled, dropping nearly 5% and sinking back under 87,000 as liquidations accelerated. The current monthly candle could be confirming a potential shift in trend momentum after a multi-year climb.

SPX500 Will Go Down!
HI,Traders !
#SPX500 made a retest
Of the horizontal resistance
Level of 6678.85 from where
We are already seeing a
Bearish reaction so we are
Locally bearish biased and
We will be expecting a
Further local move down !
Comment and subscribe to help us grow !

SPX 500: Bullish Rebound to 6760?FX:SPX500 is priming for a bullish rebound on the 4-hour chart , where price has pulled back to a critical support zone following a sharp decline, forming a potential bounce setup amid a broader uptrend—highlighted by the rebound pattern near key levels that could ignite buying if buyers defend against further downside. This confluence at the support offers a high-reward long opportunity in the index's volatile range.
Entry zone between 6530-6550 for a buy position. Target at 6760 🎯near the resistance zone, delivering a risk-reward ratio greater than 1:4 .Set a stop loss on a close below 6500 📊 to manage risk effectively. Watch for confirmation via a strong bullish candle with rising volume above the entry, capitalizing on the index's resilience despite recent pressures🌟.
Fundamentally , the S&P 500 closed at around 6646.7 on November 19, 2025, down over 2% in November amid economic concerns and high valuations, particularly in AI stocks, with the index dipping below its 50-day moving average for the first time since April—yet historical patterns suggest a median 15% upside to 7710 over the next year if it follows median rebounds. Earnings growth remains robust at 16.9% YoY, beating estimates, supporting potential recovery despite tariff worries. 💡
📝 Trade Setup
🎯 Entry Zone (Buy): 6530 – 6550
🎯 Target:
• TP: 6760 (major resistance)
❌ Stop Loss: Close below 6500
⚖️ Risk-to-Reward: Greater than 1:4
What's your outlook on this rebound? Drop your thoughts below! 👇

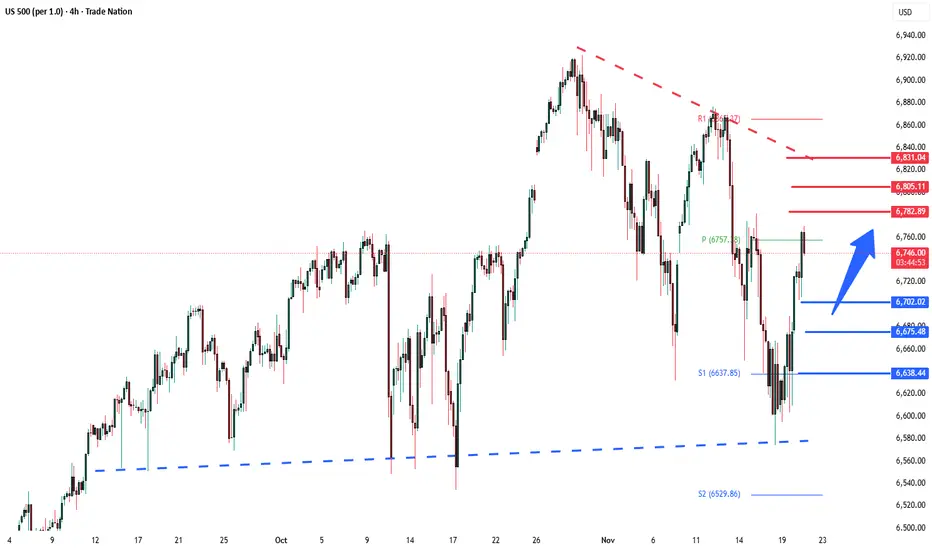
S&P500 Key Trading LevelsKey Support and Resistance Levels
Resistance Level 1: 6780
Resistance Level 2: 6805
Resistance Level 3: 6830
Support Level 1: 6700
Support Level 2: 6675
Support Level 3: 6638
This communication is for informational purposes only and should not be viewed as any form of recommendation as to a particular course of action or as investment advice. It is not intended as an offer or solicitation for the purchase or sale of any financial instrument or as an official confirmation of any transaction. Opinions, estimates and assumptions expressed herein are made as of the date of this communication and are subject to change without notice. This communication has been prepared based upon information, including market prices, data and other information, believed to be reliable; however, Trade Nation does not warrant its completeness or accuracy. All market prices and market data contained in or attached to this communication are indicative and subject to change without notice.
SPX500 – Key Breakout Levels Ahead of NFP | Bearish Below 6734SPX500 | OVERVIEW
Stocks soar on Nvidia earnings relief as the company delivered forecasted quarterly revenue well above Wall Street expectations, easing recent concerns over AI-sector valuations that had contributed to a market pullback.
Markets now shift focus to the U.S. Non-Farm Payrolls (NFP) report, which is expected to generate strong volatility across indices.
Technically:
Stocks rally after Nvidia’s strong earnings forecast, easing some AI-valuation concerns. Markets now await the NFP report, which could fuel major intraday volatility.
Below 6734: Bearish continuation toward 6670 → 6635 → 6610
Above 6754: Bullish breakout toward 6800 → 6844
Pivot: 6734
Support: 6670 · 6635 · 6610
Resistance: 6769 · 6800 · 6844
SPX500 stays bearish under 6734, and only a strong candle close above 6754 will confirm bullish momentum.

No New Dividend Payouts Are Latest Sign of Wall Street SluggishUnderstanding Dividends and Dividend Market Futures
A dividend is the distribution of corporate earnings to eligible shareholders.
Dividend payments and amounts are determined by a company's board of directors. Dividends must be approved by the shareholders by voting rights. Although cash dividends are common, dividends can also be issued as shares of stock.
The dividend yield is the dividend per share, and expressed as a percentage of a company's share price.
Many companies - constituents of S&P500 Index still DO NOT PAY dividends and instead retain earnings to be invested back into the company.
The S&P500 Dividend Points Index (Annual) tracks the total dividends from the constituents of the S&P 500 Index. The index provides investors the opportunity to hedge or take a view on dividends for U.S. stocks, independent of price movement, as S&P500 Dividend Index Futures is a market expectation of how many points Dividends Index will collect by the end of year.
Using the S&P500 Dividend Index as the underlying in financial products, investors can hedge or gain exposure to the dividend performance of the S&P500 Index.
Understanding S&P500 Annual Dividend Index Futures
The S&P500 Annual Dividend Index futures (main technical graph is for 2029 S&P500 Annual Dividend Index Futures) calculates the accumulation of all ordinary gross dividends paid on the S&P500 index constituent stocks that have gone ex-dividend over a 12-month period. The amounts are expressed as dividend index points.
The underlying index for S&P500 Annual Dividend Index futures is the S&P500 Dividend Index. The methodology for the index can be found here at S&P Global website.
Dividend index points specifically refer to the level of index points that are directly attributable to the dividends of index constituents. They typically only capture regular dividends and calculate this on the ex-date of the respective constituents within each index.
In general, “special” or “extraordinary” dividends are not included as dividend points in the respective annual dividend indices.
Futures contract Unit is $ 250 x S&P 500 Annual Dividends Index.
Technical considerations on a Galaxy of S&P500 Annual Dividend Index Futures
S&P500 Annual Dividend Index Futures. The year 2029.
Flat 18-months resistance under 80 points has been detected.
S&P500 Annual Dividend Index Futures. The year 2028.
Flat 18-months resistance, also under 80 points has been detected.
S&P500 Annual Dividend Index Futures. The year 2027.
Flat 18-months resistance, also under 80 points has been detected.
Conclusion
The graphs above indicate on a strong flat 80-point resistance over the next 1 to 3 years time span. No new dividends distributions are latest sigh of Wall Street sluggish.
--
Best wishes,
@PandorraResearch Team
