Sell you stocks! -227.20% the secreat ATH finder
We reached the secret Fibonacci level (-227.20%) on SPX.
Something big is going on.
This level worked perfectly to spot 2021 ATH on the SPX and now seems to be happening again.
I sold the majority of my stocks. What are you doing?
S&P 500 (SPX500)

S&P 500 falls below 6K - key levels to watchAs highlighted the possibility yesterday, the S&P 500 has now fallen to a fresh multi-week low. The old low at 6631 is now the most important level to watch in terms of upside resistance. Above that 6638, yesterday's low, will come into focus ahead of 6650/5 area.
On the downside, the mid-October lows of 6533 and 6500 are the next areas of interest for the bears. Will we get there? Perhaps if NVidia earnings disappoint tomorrow night.
By Fawad Razqzada, market analyst with FOREX.com

S&P500 remain under pressure, support at 6580Equities remain under pressure, with the S&P 500 down 0.92% yesterday, marking:
3rd straight decline (first since September)
Worst 3-day stretch since April (-2.61%)
Futures down another ~0.5% this morning
The index has now broken below its 50-day moving average for the first time in 139 sessions—its longest stretch above the level since 2007—adding to technical downside pressure.
Drivers of the Selloff
AI trade concerns continue to weigh:
Nvidia -1.88%, Philadelphia Semi Index -1.55%
JPMorgan’s Daniel Pinto warned of AI-rich valuations posing broader market risk.
Broad selling across the S&P:
407 decliners, most in 5 weeks
Equal-weight S&P -1.31%, Russell 2000 -1.96%, both at lowest since August
Credit risk sentiment deteriorated:
US HY +5bps, IG +1bps wider
Amazon priced $15bn in new bonds, adding to supply pressure
Mega-cap Tech
Mag-7 only slightly lower (-0.08%), saved by:
Alphabet +3.11% on Berkshire stake news
Apple sentiment mixed:
Design group loss, but strong China iPhone 17 sales (+37%) provided support
Crypto Risk Pressure
Bitcoin -3.3%, touching its lowest since April
Down ~4% YTD 2025
Down nearly 30% from highs 6 weeks ago
Modest rebound this morning helping stabilize risk tone
Macro Tone
Mass layoffs surged in October (Cleveland Fed) → signs of labour softening
Focus shifts to Thursday’s delayed September jobs report for confirmation
Trading Takeaway
Tone remains fragile, but S&P futures and Bitcoin stabilizing suggest some cooling of the global selloff.
Break of the 50-day MA is a key technical negative; next support levels likely in focus.
AI sector weakness + broader macro softening remain dominant headwinds today.
Key Support and Resistance Levels
Resistance Level 1: 6707
Resistance Level 2: 6757
Resistance Level 3: 6785
Support Level 1: 6580
Support Level 2: 6554
Support Level 3: 6530
This communication is for informational purposes only and should not be viewed as any form of recommendation as to a particular course of action or as investment advice. It is not intended as an offer or solicitation for the purchase or sale of any financial instrument or as an official confirmation of any transaction. Opinions, estimates and assumptions expressed herein are made as of the date of this communication and are subject to change without notice. This communication has been prepared based upon information, including market prices, data and other information, believed to be reliable; however, Trade Nation does not warrant its completeness or accuracy. All market prices and market data contained in or attached to this communication are indicative and subject to change without notice.

Megaphone Broadening Top Likely on SPXOver the last few months, the market has been increasingly difficult to trade as it searches for direction. Stop losses were triggered for longs on Oct 10, and shorts were equally liquidated on the run up beginning Oct 27th. What has formed is a broadening top, confirmed by two points of touch on each side of the pattern.
Broadening patterns can go in both directions, but supporting information suggests this is the end of the bull market:
On the weekly chart, there is a MACD cross.
There is a clearly defined 5 wave structure from the October 2022 bottom. It is a textbook example of Elliot Wave Theory.
Multiple analysts have shown that stock valuations are near historical extremes. It is highly likely that the market is in an AI bubble.
How am I trading this? I have sold all long positions. I am swinging puts that I will close out at the bottom of the megaphone. Once a breakout occurs, a pullback is highly likely to follow, even going so far as to return inside the pattern (60% of the time). If a pullback does occur, I'll load up on long dated puts to profit off a potential bear market.

Survived a Market Selloff | +$241 Trading S&P Futures (Day 71)Ended the day +$241 trading S&P Futures, but it didn’t come easy.
The market started off range-bound, and I traded the highs and lows cleanly — up $300 by 1PM.
Then the bottom fell out, and I got caught in a false range break, watching my account swing from +300 to -500.
Thankfully, I bought at BIA’s key support zone during the late-session recovery and clawed my way back.
Today was all about staying composed when everything flips fast.
Two takeaways today:
Walk away when you say you will — extra orders can cost you.
Range days can break suddenly; keep wider stops when volatility increases.
Above 6820 is bullish, below 6782 turns bearish.
We’re seeing signs of momentum fading, so tomorrow might bring continuation or deeper retracement.

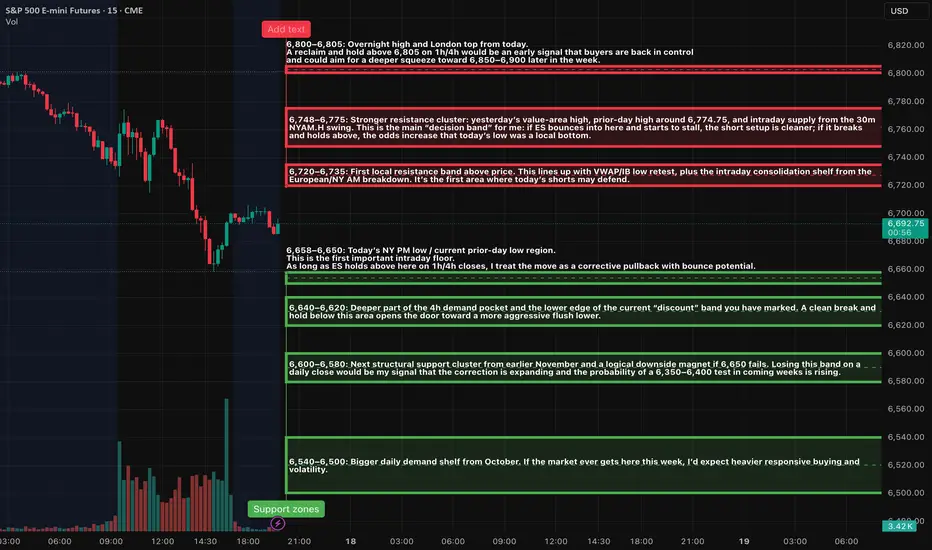
ES (SPX, SPY) Analysis, Key Zones, Setups for Tue (Nov 18th)ES experienced a notable decline, concluding the day with a sharp downturn but managed a late-session rebound off a significant demand zone. At this juncture, it appears to be a robust corrective phase within an overarching uptrend, with a reasonable probability of a bounce or a range-bound trading day ahead, barring any unexpected developments from data releases or commentary from Federal Reserve speakers.
Looking ahead to tomorrow, November 18, 2025, the economic calendar is unusually packed for a Tuesday, as various U.S. data are set to be released following delays caused by a government shutdown. Key indicators to watch that could influence ES during the New York session include the import and export price indexes for October at 8:30 AM ET, industrial production and capacity utilization figures also for October at 9:15 AM ET, and the NAHB housing market index for November at 10:00 AM ET.
Additionally, several Federal Reserve officials, including Barr, Waller, Williams, and Kashkari, are scheduled to speak throughout the day. The market is particularly attuned to their insights regarding the likelihood of another rate cut, especially in light of the recently released October FOMC minutes and this week’s jobs report.
Given the abundance of potential market-moving information, I would consider the period from 9:15 to 10:15 AM ET as a critical window for "headline risk" tomorrow.
The recent market decline can largely be attributed to macroeconomic factors:
The S&P 500 cash index ended the day down approximately 0.9%, with the Dow falling around 1.2% and the Nasdaq declining by about 0.8%. This pullback has moved the indices further away from their all-time highs established last month.
The selling pressure was particularly acute among mega-cap technology stocks and the AI sector. Major players such as Nvidia, Apple, Palantir, and AMD faced heavy trading as investors began to question whether the recent surge in tech stocks, driven by AI enthusiasm, had outpaced underlying fundamentals ahead of Nvidia’s earnings release on Wednesday.
Market sentiment was further dampened by a noteworthy prediction from Stifel's chief strategist, who suggested a potential 5% drop in the S&P 500, targeting a level around 6,350 in the coming months. This outlook was based on concerns regarding high valuations and uncertainties surrounding the Fed’s future policy as delayed economic data begins to materialize.
Interestingly, the yield on 10-year Treasuries dipped slightly towards ~4.13% , indicating that today’s selloff was more of a de-risking/profit-taking maneuver specific to equities rather than a reflection of widespread risk aversion typically signaled by bond market movements.
From a technical perspective on the ES futures:
Intraday trading patterns reflected a continuation of last week’s trend of lower highs and lower lows. Prices faltered near the 6,800–6,805 mark during the overnight session before entering a clear downtrend through the morning. The volume accelerated during the late-morning selloff, ultimately reaching a low around the 6,658–6,660 band, which coincides with established daily demand zones.
Following this drop, we observed a pronounced shift in behavior: significant buying volume surged at the lows, leading to a rejected price at that demand zone and a controlled short-covering rally back above 6,690, approaching the 6,700–6,705 range as the day closed. The Nasdaq exhibited a similar trajectory, with a heavy selloff subsequently followed by a recovery.
Structurally, today’s activity reflects:
A strong continuation of downside movement, stemming from last week’s lower-high structure and macro-driven de-risking, culminating in a liquidity flush into a previously identified demand pocket followed by short-covering toward the close.
From a broader perspective, is this the beginning of a genuine downtrend?
On the daily chart, ES remains within a larger uptrend originating from the summer lows. A higher peak above 6,900 was established in late October, with the current pullback representing a decline of approximately 3–4% from that peak. Today's trading reached the 6,650–6,670 support region, which previously served as a vital higher low space, before closing back above it. Daily momentum indicators have rolled over but are beginning to flatten, indicating they are not yet deeply oversold.
In contrast, the shorter-term 4-hour and 1-hour views present a more bearish outlook: a sequence of lower highs has formed, and the retest of prior higher low levels appears to be underway. Short-term moving averages have shifted downward, and 4-hour momentum remains negative, albeit with initial signs of a slight positive divergence compared to new price lows.
In summary:
I interpret this phase as a significant corrective downswing within a larger uptrend rather than the onset of a new bear market. The potential for a more substantial correction exists, particularly if Nvidia’s earnings disappoint or if the run of delayed economic data proves weak. However, the day's trading indicates more of a necessary adjustment rather than the onset of a catastrophic decline, aligning with institutional views that this pullback signifies a "healthy reset" following a robust advance, rather than an indication of a market bubble bursting.
Should ES close below the 6,650 mark on a daily basis and subsequently begin to print lower highs under that level, I would increase my assessment of the risk of a transition into a more enduring downtrend, with targets around the 6,350–6,400 range over the coming weeks, echoing Stifel's projections. For the time being, however, buyers continue to defend this crucial daily support zone.
Key zones to monitor for tomorrow, in the futures market:
I identify the following support zones:
6,658–6,650: This region marks today’s New York PM low and aligns with the prior day’s low. It serves as the first critical intraday support level. As long as ES maintains closes above this area on 1-hour and 4-hour charts, I consider the movement to be a corrective phase rather than a broader downtrend.
$SPX:Bearish technical indicators are accumulating:SPX: Bearish technical indicators are accumulating:
1) A sell signal on the MACD.
2) The RSI14 is at 42.
3) There has been a break below the 10, 20, and 50-period simple moving averages.
4) There is an inability to break above the horizontal resistance at 6765.
It is evident that the bullish momentum that followed the extremely bearish candlestick on October 10th has stalled, resulting in sideways trading with a slight downward trend. However, there is no immediate cause for concern since an underlying pressure is currently halting the decline.
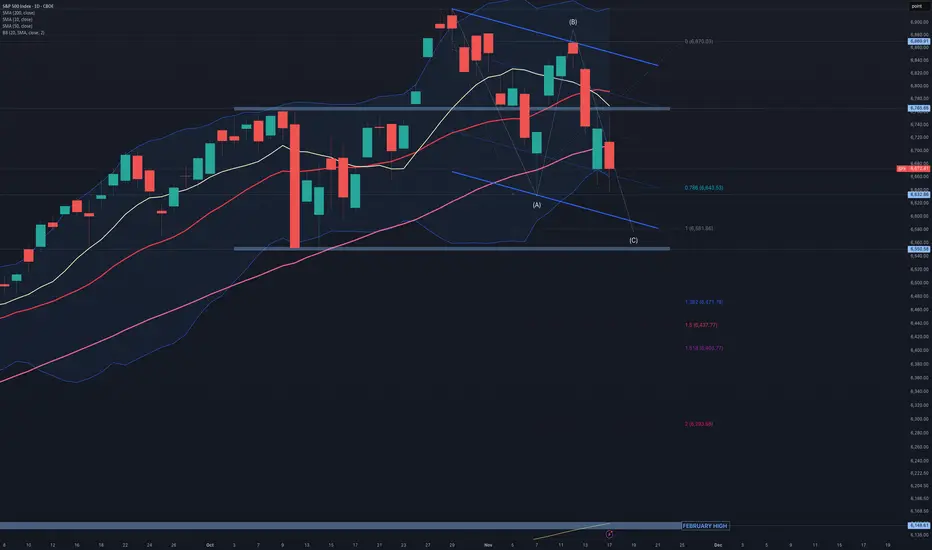
At this point, we could expect a bullish flag pattern to emerge, which will be confirmed by the market's reaction to NVDA's results next Wednesday. The lower limit of the anticipated flag aligns with a 1x1 extension for wave (C). If the situation worsens and the flag is broken, it may transform into a zig-zag pattern, with extension targets for wave (C) indicated on the chart. Consider viewing this as an opportunity to enter a long position.
SPX500 Breakdown Warning: Major Supports— Bigger Crash Ahead?The S&P 500 index ( SP:SPX ) has become increasingly significant recently, and it has a notable impact on cryptocurrency markets, especially Bitcoin ( BINANCE:BTCUSDT ). Therefore, analyzing the S&P 500 not only benefits its own market but also enhances our understanding of related markets.
Fundamental Analysis:
Volume confirms distribution, while the ongoing U.S. government shutdown delays critical data (CPI, PPI), fueling uncertainty and risk-off sentiment. Fed’s hawkish pause on rate cuts and tech sector rotation (TSLA -6%( NASDAQ:TSLA ), NVDA -3.5%( NASDAQ:NVDA )) reinforce bearish momentum. Also, YTD performance now -3.2% in November — on pace for the worst monthly drop since 2008 (-7.5%
Technical Analysis:
From a technical perspective, the S&P 500 index is breaking the Support zone($6,773_$6,710) and moving near the Support lines and 50_SMA(Daily) . Given recent data, there’s a possibility that these supports may break.
Additionally, according to Elliott Wave Theory , we can expect more corrective waves ahead.
I expect the SPX500 index to decline to $6,633 after the support cluster is broken in the first step.
First Target: $6,633
Second Target: $6,583
Stop Los(SL): $6,815
Please respect each other's ideas and express them politely if you agree or disagree.
S&P 500 Index Analyze (SPX500USD), 4-hour time frame.
Be sure to follow the updated ideas.
Do not forget to put a Stop loss for your positions (For every position you want to open).
Please follow your strategy and updates; this is just my Idea, and I will gladly see your ideas in this post.
Please do not forget the ✅' like '✅ button 🙏😊 & Share it with your friends; thanks, and Trade safe.

SPX 500: Stocks look heavy US stocks are testing their session lows with major indices looking heavy amid the unwinding of carry trades...
Concerns about Japan’s growing debt are intensifying. The government seems to be trying to have it both ways—implementing a massive fiscal stimulus package worth 17 trillion yen while opposing monetary policy normalization by the Bank of Japan. This conflicting stance has led to a sharp decline in the yen and bond prices, pushing Japanese yields higher. Markets now worry that the government is mishandling the economy, demanding higher returns to compensate for what they perceive as rising risk in holding Japanese debt.
So why does this matter for US stocks? The turbulence in Japanese markets may be triggering a carry trade unwind, similar to what happened in the summer of 2024. In a carry trade, investors borrow funds from countries with very low interest rates—like Japan—and invest them in higher-yielding assets such as stocks, gold, or cryptocurrencies denominated in stronger currencies like the U.S. dollar. As Japanese yields climb, the cost of maintaining these trades rises. With yields now becoming uncomfortably high, traders are being forced to reduce leveraged positions across markets, including US stocks.
By Fawad Razaqzada, market analyst with FOREX.com

Weekly Outlook: XAUUSD, #SP500, #BRENT for 17-21 November 2025XAUUSD: BUY 4085.00, SL 4055.00, TP 4175.00
Gold enters the new week around $4,080 per ounce on Monday, November 17, 2025. The market focus is the release of the Federal Reserve minutes this week and the resumption of delayed U.S. macro data after the government pause ended: this shapes expectations for the future rate path and the dollar’s dynamics. Meanwhile, overall demand for gold is supported by sustained official purchases: according to the World Gold Council, central banks kept net buying elevated in Q3, and October marked a fifth consecutive month of inflows into gold funds. On the supply and alternative-yield side there are no notable new factors; 10-year Treasury yields remain near recent levels, which limits the cost of holding gold but does not negate safe-haven demand.
Fundamentally, the week looks moderately favorable for XAUUSD: the minutes may confirm a course toward gradual easing of conditions in 2026, while uncertainty in data and the geopolitical backdrop preserve interest in defensive assets. Risks for buyers include a tougher reading of the minutes and a stronger dollar; supportive factors include steady official purchases, continuing ETF inflows, and stable retail investment demand. In this environment, buying dips with a nearby loss limit is preferred.
Trade recommendation: BUY 4085.00, SL 4055.00, TP 4175.00
#SP500: BUY 6735, SL 6685, TP 6885
The S&P 500 starts the week near 6,734 at Friday’s close (November 14), while Monday futures trade modestly higher on expectations for key corporate earnings. The main catalyst is results from the leading producer of AI-focused semiconductors, viewed as a gauge of whether the investment cycle in AI and corporate capex continues. On the macro side, the Fed minutes and the return of several delayed indicators will help refine the monetary-policy path after recent rate cuts. Yields on 10-year U.S. Treasuries are holding around 4% with choppy swings, which does not add fresh pressure to equity multiples.
The weekly backdrop supports the benchmark: anticipated corporate drivers (AI investment, retailer reports as a read on consumer demand) and reduced data uncertainty as releases resume. Risks include softer guidance on AI capex, a jump in yields, or more cautious signals from the Fed minutes. The base case is a measured continuation of the uptrend if earnings resilience is confirmed and no negative surprises appear in the data.
Trade recommendation: BUY 6735, SL 6685, TP 6885
#BRENT: BUY 64.00, SL 61.80, TP 70.60
Brent crude on Monday, November 17, 2025, holds near $64 a barrel as the market digests the resumption of loadings at Russia’s Novorossiysk port after a brief halt while reassessing the global supply-demand balance. Recent assessments point to a growing surplus in 2025–2026: agencies note faster output growth alongside moderate demand, while OPEC+ signals readiness to manage supply flexibly against the backdrop of lowered official selling prices for Asia in December. At the same time, geopolitical risks and occasional disruptions periodically restore a risk premium, cushioning the pressure from oversupply.
This week, prices will be driven by news on OPEC+ discipline, stock/export data, regulator commentary, and the dollar’s path after the Fed minutes. The base balance is “moderately neutral” with elevated sensitivity to headlines: absent fresh signals of a larger surplus, the market tends to consolidate with potential for a recovery toward the upper end of the range as short positions are covered and risk appetite improves. Key risks to long positions are faster non-OPEC+ supply growth, softer Asian demand, and a lack of geopolitical premium in the news flow.
Trade recommendation: BUY 64.00, SL 61.80, TP 70.60

SPX500 | Key Levels Ahead of Nvidia EarningsSPX500 | Overview
U.S. stock futures edge higher as investors await Nvidia’s earnings report and delayed government data, which could provide clues about the economy and the Federal Reserve’s next policy steps.
Technically:
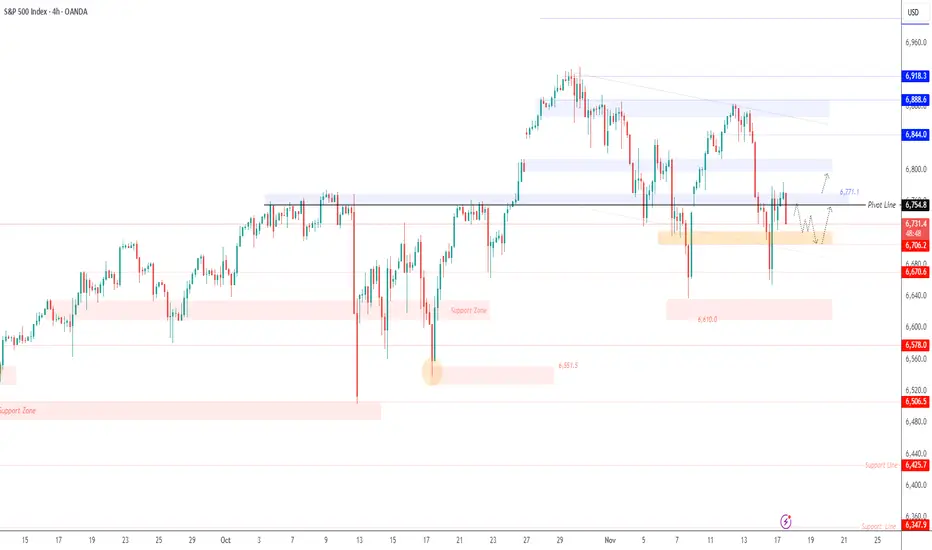
The SPX500 remains in a neutral-to-bearish zone, with direction depending on the upcoming 4H candle close.
A close below 6755 would confirm a bearish continuation toward 6706 and 6670.
However, a 4H close above 6769 would shift momentum to a bullish trend, targeting 6813 and 6838.
Pivot Line: 6754
Support: 6706 · 6670 · 6637
Resistance: 6770 · 6813 · 6838
S&P500 H1 | Bearish Reaction off Key ResistanceMomentum: Bearish
Price is currently below the ichimoku cloud.
Sell entry: 6,839.11
- Strong pullback resistance
- 78.6% Fib retracement
- 161.8% Fib extension
Stop Loss: 6,881.31
- Swing high resistance
Take Profit: 6,770.32
- Pullback support
High Risk Investment Warning
Stratos Markets Limited (tradu.com/uk ), Stratos Europe Ltd (tradu.com/eu ):
CFDs are complex instruments and come with a high risk of losing money rapidly due to leverage. 70% of retail investor accounts lose money when trading CFDs with this provider. You should consider whether you understand how CFDs work and whether you can afford to take the high risk of losing your money.
Stratos Global LLC (tradu.com/en ): Losses can exceed deposits.
Please be advised that the information presented on TradingView is provided to Tradu (‘Company’, ‘we’) by a third-party provider (‘TFA Global Pte Ltd’). Please be reminded that you are solely responsible for the trading decisions on your account. Any information and/or content is intended entirely for research, educational and informational purposes only and does not constitute investment or consultation advice or investment strategy. The information is not tailored to the investment needs of any specific person and therefore does not involve a consideration of any of the investment objectives, financial situation or needs of any viewer that may receive it. Past performance is not a reliable indicator of future results. Actual results may differ materially from those anticipated in forward-looking or past performance statements. We assume no liability as to the accuracy or completeness of any of the information and/or content provided herein and the Company cannot be held responsible for any omission, mistake nor for any loss or damage including without limitation to any loss of profit which may arise from reliance on any information supplied by TFA Global Pte Ltd.

ES (SPX, SPY) Analysis for Week Ahead (Nov 17th - 21st)Market Analysis: ES1 - Navigating Recent Price Action and Upcoming Economic Catalysts
Current Price Context:
The E-mini S&P 500 (ES1) is currently trading in the range of 6,755 to 6,785, following a sharp pullback from the 6,880 to 6,900 peak and a notable rebound off the 6,650 levels. While both the weekly and daily structures exhibit an overarching uptrend characterized by higher highs and higher lows, we are presently experiencing a mid-pullback phase, with prices resting below a newly established supply zone spanning 6,850 to 6,900. Importantly, we remain above the key demand shelf situated around 6,650 to 6,670.
Big Picture Overview: Weekly and Daily Trends
- Weekly Analysis: Over recent months, ES has ascended from approximately 6,000 to the 6,900 level. The past few weeks have seen a new high printed, followed by a red candle signaling a pullback towards mid-range levels. Despite this corrective move, we maintain a buffer above the preceding weekly low near the 6,500 to 6,550 range, affirming the uptrend. The current price action appears more as a corrective pause rather than a definitive peak.
- Daily Perspective: After reaching a new high just shy of the 6,900 mark, the market retreated into the mid-6,600s before bouncing back. Recent daily candles indicate a phase of consolidation within the 6,730 to 6,780 range, characterized by wicks on both ends and diminishing body sizes, alongside reduced volume compared to earlier volatility. Oscillator indicators are retreating from overbought conditions but appear to be stabilizing, suggesting a digestion phase rather than a full-scale momentum breakdown.
Shorter Timeframe Analysis (4-Hour and 1-Hour):
- On the 4-hour chart, a completed downward impulse from around 6,880 to the low 6,650s has been observed, with the price touching the 1.272 Fibonacci extension at approximately 6,653. Additional Fibonacci levels below include 6,597 (1.618) and 6,536 (2.0). The price action around the 1.272 extension has prompted a robust response, featuring significant green candles and increased volume, establishing a base between 6,700 and 6,800.
- On the 1-hour chart, the market exhibits a minor uptrend (from lower lows to higher highs) that has encountered resistance around 6,780. Currently, price action is consolidating near a pivot level of 6,750, leading to the establishment of a balance range between 6,720 and 6,780 as we head into Monday.
Summary: The broader context remains bullish on higher timeframes, with a corrective phase taking root on the medium timeframe, while the short-term landscape indicates balance. This scenario represents a classic "trend pullback parked on key support," with next week's developments likely steering us either back toward the highs or engendering a deeper test of 6,600 or 6,550, contingent on forthcoming economic data and Fed commentary.
Macro and Event Landscape: A Busy Week Ahead
The recent U.S. government shutdown has resulted in a considerable backlog of economic data releases. Market participants will be closely monitoring delayed payroll data, along with other significant indicators such as industrial production and housing metrics that are being released simultaneously. This aggregation of data is anticipated to introduce intraday volatility, particularly during the 8:30 to 10:00 AM ET windows.
Key Economic Indicators to Watch:
- Core Data Releases: In the week of November 17–21, critical releases include:
- Empire State manufacturing index
- Import and export price indices
- Industrial production and capacity utilization figures for October
- Housing starts and building permits scheduled for mid-week
- Additional delayed labor data later in the week as agencies address the backlog.
- FOMC Minutes and Fed Commentary: The release of the FOMC minutes from the late October meeting will communicate the Fed's confidence in the recent improvements in inflation and its openness to potential rate cuts in December. A lineup of Fed speakers is set to take the stage, likely influencing market sentiment and causing price reactions based on their comments.
- Corporate Earnings: Noteworthy earnings reports from Nvidia and major retailers, including Walmart, are on the calendar. Nvidia's performance will be scrutinized as a barometer for the AI segment, while insights from retail giants will provide a glimpse into consumer health as the holiday season approaches. Strong results coupled with optimistic guidance tend to buoy ES, while any disappointments could weigh on index futures, especially given the concentrated leadership from a handful of major tech stocks.
Market Sentiment and Positioning: Rate-cut expectations for December have decreased to about 40%, leaving investors cautious but not overly alarmed. This environment allows for potential relief rallies if data and Fed sentiments tilt favorably, while a series of negative reports may trigger a notable risk-off sentiment.
Conclusion: The upcoming week is poised to be event-driven, lacking a singular "mega" release like CPI but rather presenting a series of medium-to-large catalysts (Fed minutes, late payrolls, industrial production, housing statistics, Nvidia, and Walmart). Traders should be prepared for choppy conditions and liquidity fluctuations around the release times, with clearer directional moves anticipated between these events.
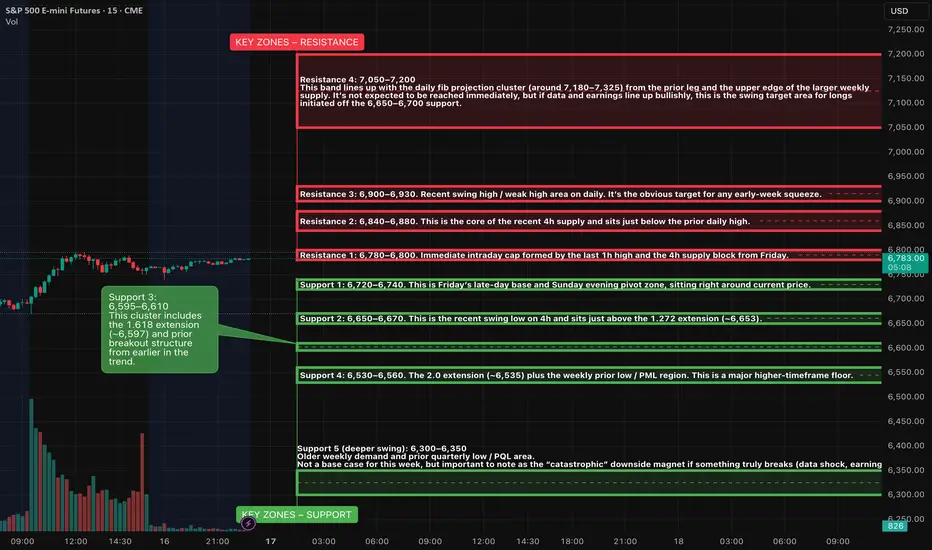
KEY ZONES – RESISTANCE
Resistance 1: 6,780–6,800
Immediate intraday cap formed by the last 1h high and the 4h supply block from Friday. This is the ceiling that has repeatedly turned price in the last session. A 1h or 4h close above 6,800 would confirm that buyers are back in control and likely aim for 6,850+ fairly quickly.
Resistance 2: 6,840–6,880
This is the core of the recent 4h supply and sits just below the prior daily high. It’s where the last strong sell program launched. If price trades into this pocket on light volume and stalls, that favours a lower-high top and another rotation back toward 6,720–6,700. If the tape pushes through decisively, shorts will be forced to cover.
Resistance 3: 6,900–6,930
Recent swing high / weak high area on daily. It’s the obvious target for any early-week squeeze. If this zone gets cleaned out and holds on the retest, the uptrend resumes and we can start talking about higher fib extensions and a run toward the 7,000 handle. A sharp rejection here, especially around Fed minutes or Nvidia earnings, would fit a double-top pattern and could kick off a deeper pullback leg.
Resistance 4: 7,050–7,200
This band lines up with the daily fib projection cluster (around 7,180–7,325) from the prior leg and the upper edge of the larger weekly supply. It’s not expected to be reached immediately, but if data and earnings line up bullishly, this is the swing target area for longs initiated off the 6,650–6,700 support.
KEY ZONES – SUPPORT
Support 1: 6,720–6,740
This is Friday’s late-day base and Sunday evening pivot zone, sitting right around current price. It lines up with the 1h equilibrium where price has been rotating. As long as ES holds above 6,720 on closing basis, buyers are defending the immediate balance and can make another push toward 6,780–6,800.
Support 2: 6,650–6,670
This is the recent swing low on 4h and sits just above the 1.272 extension (~6,653). It’s the first real higher-timeframe demand pocket of this pullback. A clean tag and strong bounce here would look like a classic trend-pullback low forming. A sustained break under 6,650 would suggest the market isn’t done repricing and opens the door to the deeper fibs.
Support 3: 6,595–6,610
This cluster includes the 1.618 extension (~6,597) and prior breakout structure from earlier in the trend. It’s the “deeper but still healthy” retrace area; if ES flushes into this band on bad data then snaps back, it can still preserve the weekly uptrend. Failing here would start to threaten the bullish structure and invite a test toward the prior weekly low.
Support 4: 6,530–6,560
The 2.0 extension (~6,535) plus the weekly prior low / PML region. This is a major higher-timeframe floor. If ES ever gets here this week, the tape is likely under stress, but it also becomes the zone where large buyers usually test the waters for a bigger swing entry. A weekly close below ~6,530 would be the first real warning that the uptrend is morphing into something more corrective or even distributive.
Support 5 (deeper swing): 6,300–6,350
Older weekly demand and prior quarterly low / PQL area. Not a base case for this week, but important to note as the “catastrophic” downside magnet if something truly breaks (data shock, earnings disaster, geopolitical flare-up).
SETUPS – WEEK AHEAD IDEA PACK
1. Trend-pullback continuation long from support
Location: 6,650–6,670 primary, 6,595–6,610 secondary.
Trigger idea:
Look for an overnight or early-week sweep into 6,650–6,670 that quickly rejects (long lower wick on 1h / 4h, strong reclaim back above 6,680). Ideally, this happens outside the heaviest data windows so it’s more order-flow driven than headline noise.
If that fails and price drives into 6,595–6,610 instead, repeat the same logic there: washout, strong reaction, then a reclaim of 6,620–6,630 as confirmation that buyers stepped in.
Upside path from this setup:
First target is the 6,780–6,800 cap. If that gives way, next magnet is 6,840–6,880, then a possible extension run at the 6,900–6,930 recent high area. Later in the week, if macro tailwinds show up, this move can stretch toward 7,000 and, in an optimistic case, into the 7,100+ fib cluster.
Risk management conceptually:
From a swing perspective, the “line in the sand” for this idea is under 6,595. A clean daily close below that level would invalidate the shallow-pullback idea and suggest we are heading toward 6,530–6,560 or lower.
2. Short-term fade from the 6,840–6,880 / 6,900 pocket
Location: 6,840–6,880 first, 6,900–6,930 as extension.
Trigger idea:
If ES trades up into 6,840–6,880 ahead of Fed minutes or the Nvidia/Walmart prints and shows tired price action (long upper wicks on 15m/1h, loss of intraday momentum, failure to hold above 6,860), that area is attractive for a tactical short aiming back toward the 6,780–6,750 pivot.
A more aggressive fade is possible into 6,900–6,930 if the first test breaches 6,880 but immediately stalls at the prior high.
Downside path from this setup:
First magnet is the 6,780–6,800 band, then the balance base at 6,720–6,740. If that gives way on a macro shock, sellers can push for a retest of 6,650–6,670.
Risk management conceptually:
For shorts initiated at 6,840–6,880, a protective stop makes sense above 6,910–6,920. Fades taken into a full sweep of 6,900–6,930 should respect a hard stop above ~6,950; above that, risk of a proper breakout toward 7,000+ increases sharply.
3. Range-trade scalps inside 6,720–6,780
While ES is stuck inside this intraday box, there is room for mean-reversion trades: buying dips into 6,720–6,730 and selling pushes into 6,770–6,780 with tight intraday stops. This is a lower-quality idea compared to the bigger levels, but it’s relevant if Monday and early Tuesday stay choppy while everyone waits for the meat of the calendar mid-week.
$SPX The trend remain up, but it's crucial to stay alert!SPX: Analyzing the weekly chart, at first glance, it seems that everything is under control. However, since the formation of the doji three weeks ago, the SPX has lost upward momentum, despite Friday's attempt with a positive opening that failed to consolidate by the close of trading.
It's clear that the 10-week simple moving average is on the market's radar and is currently holding. We can also draw a blue oblique support line; however, last week's doji is signalling uncertainty in the market, in addition to having closed below the horizontal support level at 6754.
Meanwhile, the MACD is about to issue a sell signal. For now, the SPX remains fine, but it needs to hold firm; otherwise, it might need to test the strength of the next support level, located at 6550, where the 20-week simple moving average will also be found next week.
The stakes are high!

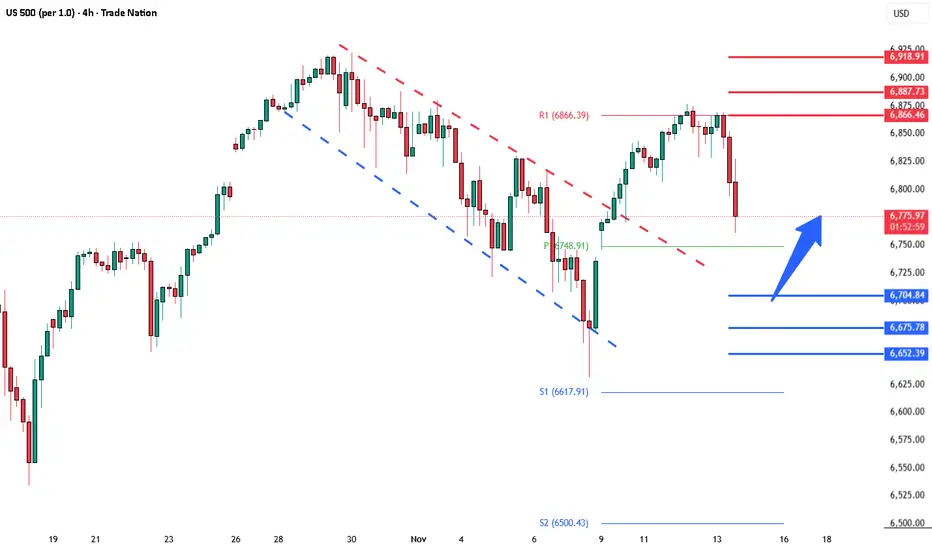
S&P Key Trading LevelsKey Support and Resistance Levels
Resistance Level 1: 6866
Resistance Level 2: 6890
Resistance Level 3: 6920
Support Level 1: 6704
Support Level 2: 6675
Support Level 3: 6650
This communication is for informational purposes only and should not be viewed as any form of recommendation as to a particular course of action or as investment advice. It is not intended as an offer or solicitation for the purchase or sale of any financial instrument or as an official confirmation of any transaction. Opinions, estimates and assumptions expressed herein are made as of the date of this communication and are subject to change without notice. This communication has been prepared based upon information, including market prices, data and other information, believed to be reliable; however, Trade Nation does not warrant its completeness or accuracy. All market prices and market data contained in or attached to this communication are indicative and subject to change without notice.
S&P500 The Week Ahead Key Trading Levels Key Support and Resistance Levels
Resistance Level 1: 6866
Resistance Level 2: 6890
Resistance Level 3: 6920
Support Level 1: 6704
Support Level 2: 6675
Support Level 3: 6650
This communication is for informational purposes only and should not be viewed as any form of recommendation as to a particular course of action or as investment advice. It is not intended as an offer or solicitation for the purchase or sale of any financial instrument or as an official confirmation of any transaction. Opinions, estimates and assumptions expressed herein are made as of the date of this communication and are subject to change without notice. This communication has been prepared based upon information, including market prices, data and other information, believed to be reliable; however, Trade Nation does not warrant its completeness or accuracy. All market prices and market data contained in or attached to this communication are indicative and subject to change without notice.

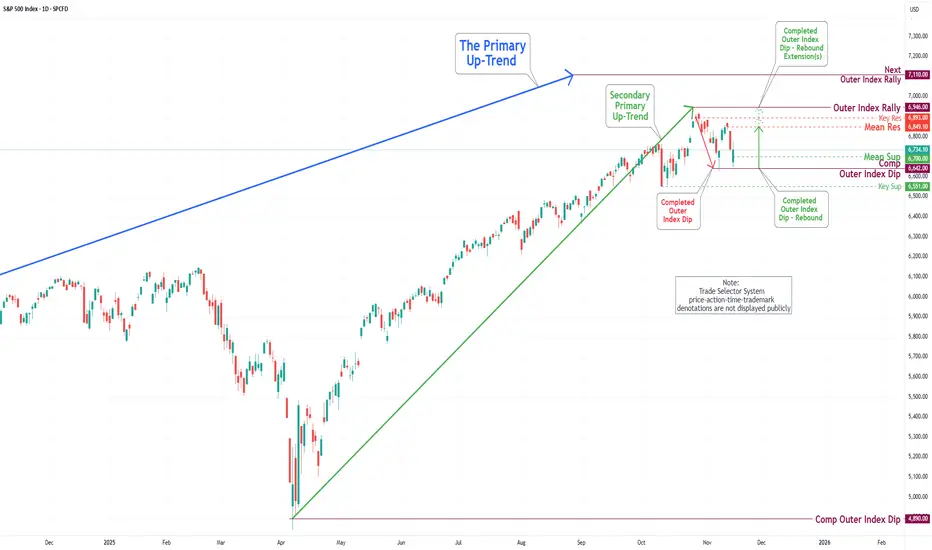
S&P 500 Daily Chart Analysis For Week of Nov 14, 2025Technical Analysis and Outlook:
The most recent trading session exhibited a significant decline in the S&P 500 Index, highlighting the significance of our Key Resistance target, marked as 6893, situated just below the Outer Index Rally 6,946. The index has now retested the Outer Index Dip at 6,642, and it tipped its hand that it wants to go higher. This current position indicates the potential for further upward movement, with the target established at the Mean Resistance level of 6,849 and a well-structured extension towards the Key Resistance level of 6,893, with an ultimate target for the Outer Index Rally set at 6,946.
Nevertheless, it is crucial to acknowledge the possibility of a drawdown in the forthcoming week's trading session, which could nibble at the Mean Support of 6,700, possibly resulting in a further decline to the "Do That to Me One More Time" Outer Index Dip at 6,642 before ultimately resuming an upward trajectory.
Doge Coin 0.06$ inc soon lolHey guys,
Doge coin has been sleeping for a while and its going to wake up soon but first price needs to
Touch down on the key FIB level at 0.06$ which is in my opinion the safest entry price.
We might see a small pump to 0.20$ first but after that 0.06$ is a magnet so don't be fooled
When it pumps a little in the upcoming days.
Let me know what do you guys think about this.

S&P At The End Of The Trend?Seems like on the weekly and monthly charts, the S&P has completed a 5 wave Elliott which started in fall 2022, exactly 3 years ago. The indicators also seem getting weaker on both time frames. Probably there is a distribution going on. Everybody you see is talking about a recession in 2026, mostly towards the middle of the year and we will have a Christmas rally this year. Well, by now we have learned that if everybody is expecting something to happen, either it doesn’t happen or it happens earlier . We’ll see because nobody knows the future. Though, as I see, most people now are in the mood that every fall is a buying opportunity and “this time it’s different” with ai. So many cocky opinions flying around. Maybe this time it’s different but for now, I am thinking that we will have a 3 wave Elliott downwards. Actually, I didn’t like the sentiment that is going around. We’ll see if we will wear our shorts in winter.

S&P500 H1 | Bullish Bounce off Key SupportMomentum: Bullish
Price is currently within the bullish ichimoku cloud.
Buy entry: 6,817
- Strong overlap support
- 23.6% Fib retracement
- 127.2% Fib extension
Stop Loss: 6,774
- Swing low support
Take Profit: 6,874
- Swing high resistance
Stratos Markets Limited (tradu.com/uk ), Stratos Europe Ltd (tradu.com/eu ):
CFDs are complex instruments and come with a high risk of losing money rapidly due to leverage. 70% of retail investor accounts lose money when trading CFDs with this provider. You should consider whether you understand how CFDs work and whether you can afford to take the high risk of losing your money.
Stratos Global LLC (tradu.com/en ): Losses can exceed deposits.

SP500 Santa Claus rally - just backwardsIt is time to short the waaaaay needed correction on the stock market.

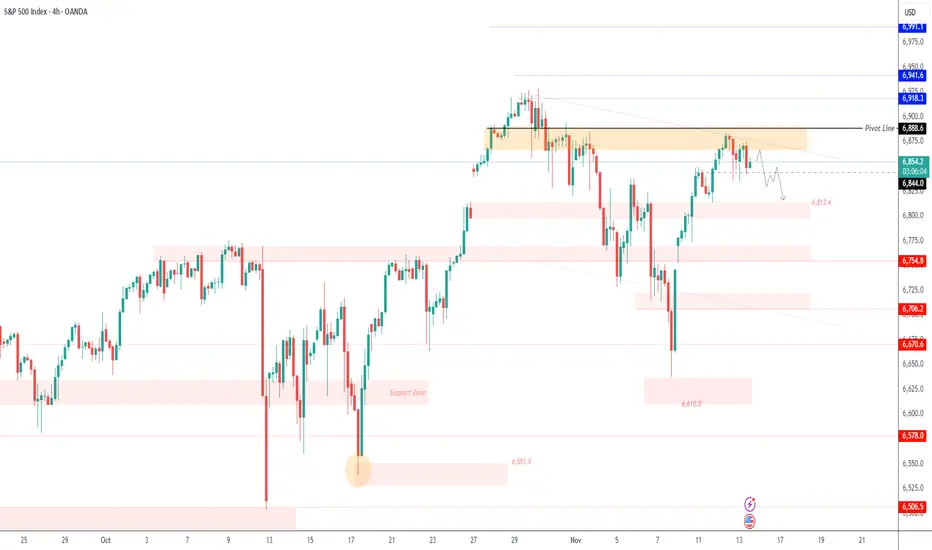
Shutdown Ends, Uncertainty Remains | SPX500 Holds Below 6866SPX500 | Overview
Trump Signs Bill to End Longest U.S. Government Shutdown
U.S. President Donald Trump signed a bill late at night in the Oval Office, officially ending the longest government shutdown in U.S. history, after a dinner with Jamie Dimon and top Wall Street executives.
While markets welcomed the resolution, the White House confirmed that some economic data gaps may be permanent, as October’s employment and CPI reports might never be released—a factor that could influence future Fed decision-making.
Technically:
The SPX500 has stabilized below the pivot zone at 6866, indicating continued bearish momentum with downside potential toward 6844 and 6813.
As long as the price trades below 6866, the bearish bias remains active.
However, a 1H close above 6888 would shift sentiment to bullish, targeting 6918 and a potential new all-time high (ATH) around 6940.
Pivot Line: 6866
Resistance: 6888 · 6918 · 6940
Support: 6844 · 6813 · 6768
ES (SPX, SPY) Analysis, Levels, Setups, for Fri (Nov 14th)
Today’s session revealed a marked risk-off sentiment as the market began to discipline leading sectors, notably large-cap tech, AI, semiconductors, and high-beta growth stocks. This correction coincided with a reassessment of expectations for near-term Federal Reserve easing and an environment defined by unequal economic data in the wake of the record shutdown.
Despite the abrupt decline, the E-mini S&P 500 (ES) remains in a pullback phase within a broader uptrend, still functioning within a weekly premium and supply zone. This movement exhibits characteristics typical of a sharp correction and repositioning rather than the definitive onset of a bear market. Importantly, prices have yet to break below the last significant daily higher-low region, weekly market structure continues to show constructive signs, and the “stress indicators” monitored by institutional investors are elevated but not yet at levels indicative of a crisis.
Dashboard Context
Volatility: Implied volatility surged today, with equity volatility pushing above previously complacent levels, albeit the term structure remains predominantly upward-sloping rather than inverted. This nuance is critical; while funds are investing more for protection and short-term hedges, the volatility landscape does not yet suggest a disorderly liquidation phase.
Options Positioning: The index and overall put/call ratios have transitioned from a state of complacency to caution, reflecting increased demand for hedging. However, levels are not yet extreme enough to signal panic. Skew is elevated, indicating that investors are bidding for downside protection, although it remains within the upper bounds of a normal range. This suggests that while major institutions are leaning into protective strategies and tactical downside plays, the broader market is not universally positioned for a crash.
Breadth: The internal damage today was notable, with decliners outpacing advancers significantly across major exchanges. This shift in breadth oscillators from positive to negative in a single session points to a broad-based distribution rather than a narrow selloff concentrated in a few prominent names. Historically, such internal damage requires several sessions for a market to recover.
Credit and Funding: High-yield spreads have widened modestly from recent lows, and high-yield ETFs have pulled back from their peaks. Nevertheless, there are no current signs of a credit crisis. Spreads remain well within ranges that do not indicate severe stress, and funding markets continue to operate smoothly. Provided that credit conditions stay stable, current equity weakness is likely more reflective of a valuation and positioning reset than systemic risk.
Cross-Asset Risk: The crypto market experienced a sharp selloff, while global equity indices broadly fell. This behavior confirms a classic cross-asset risk-off scenario, as investors reduced exposure to the highest-beta, most speculative areas while simultaneously de-leveraging from U.S. equity leaders. Conversely, traditional defensive stocks and segments of quality value showed relative resilience, a behavior consistent with a managed de-risking rather than an all-encompassing liquidation.
In summary, the dashboard indicates a shift from “overbought complacency” to a higher-volatility, risk-off environment. However, we have yet to enter a full-scale, credit-driven bear market. This context is essential for interpreting today’s decline in the E-mini S&P 500.
Multi-Timeframe Technical Structure (Weekly → Daily → 4H → 1H)
Weekly: The E-mini remains in an upward trajectory, printing higher highs and higher lows. Prices have retreated from a premium zone established at recent highs. The current weekly bar suggests rejection, yet critically, price levels remain comfortably above the last key weekly higher low near the 6,000 mark. Weekly momentum, previously overstretched to the upside, is rolling over, signaling a potential cooling phase – likely a period of consolidation or corrective drift rather than immediate trend failure.
Daily: On the daily chart, the ES has formed a distinct upper range beneath a weak high. Today’s trading produced a significant red candle, indicating a drop from the upper range back toward its center. The prior swing low around 6,620–6,580 remains intact, but the daily oscillator shows mild bearish divergence relative to the last high – a common occurrence in maturing upswings. This situation conveys the message of “bullish but extended, now in corrective mode,” rather than a definitive shift to a pattern of lower highs and lower lows.
4-Hour: The 4-hour structure has entered a short-term downtrend. A lower high was established in the 6,900–6,920 range, leading to an impulsive sell-off toward demand around 6,730–6,700. This selloff exhibited characteristics of liquidation: substantial red candles, minimal counter-rotation, and strong volume. The 4-hour oscillator shows bearish pressure but is beginning to flatten near support, consistent with an early basing attempt after a sharp sell-off, though additional downside remains possible if negative overnight flows persist.
1-Hour: The 1-hour chart portrays today’s price movement as a decisive liquidation wave.
Today's market decline was driven by three converging factors.
First, we saw a mix of valuation adjustments and crowded positioning. Sectors such as AI, semiconductors, and large-cap growth stocks had experienced significant upward momentum. As a result, profit-taking and forced de-leveraging became evident, especially when the largest index components corrected. This simultaneous adjustment made it challenging for the overall index to hold its ground.
Second, the narrative surrounding interest rates and policy has shifted. Recent commentary from the Federal Reserve has adopted a more cautious tone regarding the pace and scale of future interest rate cuts. With inflation remaining above target and some data being impacted by the government shutdown, policymakers appear hesitant to endorse the market's most optimistic expectations for easing. This recalibration towards a "higher for longer" mindset is detrimental to long-duration growth equities and affects the valuations assigned to market leaders.
Third, while the government shutdown has concluded, the subsequent rhythm of the economic calendar has been disrupted. Several critical data releases have been delayed or are now under scrutiny, prompting investors to navigate through somewhat erratic information. In this context, there has been a notable reluctance to take on risk at elevated valuations without clearer data confirmation. Consequently, we are witnessing a trend of de-risking, characterized by a swift rotation from expensive stocks into cash, defensive positions, and protective strategies.
The outcome has been a pronounced selloff, exhibiting broad downside movement and a surge in volatility. Importantly, this occurred without significant turmoil in credit or funding markets, suggesting that we are dealing with a valuation reset rather than a systemic crisis.
Looking ahead, the question arises: Is this the beginning of a more substantial downtrend or merely a temporary flush? From a structural perspective, the market has yet to breach the typical thresholds that signal the onset of a major downtrend. The previous daily higher low remains in place, the weekly uptrend is still intact, and we have not observed the combination of lower highs and lower lows that would signify a broader bearish phase.
Currently, we are witnessing a rejection from a weekly premium/supply zone, with momentum weakening at both daily and weekly levels. Additionally, there is a clear lower high alongside a liquidation move visible on the four-hour chart, which aligns with the expected behavior during the early stages of a significant correction following an extended rally.
As it stands, the prevailing view is that we are experiencing a sharp corrective phase or volatility spike within the upper range of the ongoing uptrend. While the risk of a more profound correction is heightened, particularly if the support range of 6,600 to 6,535 is breached, the current indicators do not yet suggest a completed market top or a fully developed bearish trend.
A genuine trend transition would likely require:
– a decisive break of S3 and a failed retest from below;
– a sustained period of weak breadth rather than a single-day air pocket;
– and, on the macro side, a clear deterioration in credit and funding conditions alongside a persistent inversion of the equity volatility term structure.
At present, those conditions are not fully in place.
Level-KZ Execution Framework for Tomorrow
Asia/London Participation: If overnight trade pushes the ES down into the 6,710–6,680 range and subsequently prints a rejection with a definitive 15-minute close above that zone, consider it a tactical bounce location. This could target a move back toward the 6,770–6,800 region. Given the event risk, participation should be smaller than usual and approached as preparatory rather than primary risk.
PPI Window (08:30–09:15 ET): The initial 15–30 minutes post-PPI release should be regarded as a discovery phase. If the first impulse upward drives the price into R1/R2 but then closes back below 6,780–6,800 with upper wicks and a failure of the 5-minute structure, it sets up a potential short from the underside of the shelf. Targets for this short could be at 6,720 and then 6,680. Conversely, if the initial market reaction results in a drop to S2/S3 that quickly wicks back and closes above that zone on a 15-minute chart, it presents a tactical bounce long toward the 6,740–6,780 area. The decisive 15-minute close after the data release will provide clarity on which side gains control for the session.
NY AM Kill Zone (09:30–11:00 ET): For short positions, the optimal area remains a rejection from 6,780–6,815 after the PPI reaction is digested. A long upper wick and a return close within that range on a 15-minute chart, paired with a failure in the 5-minute attempts to maintain above, supports a short position. Stops should be placed just above the rejection high, with profit targets initially toward 6,720 and subsequently toward 6,680. Conversely, for long opportunities, an ideal scenario involves a constructive reaction from the 6,700–6,660 support band. This would look for a higher low on the 15-minute chart, reclaiming and holding above 6,700, while sellers falter at S1. In this case, stops would belong below the reaction low, targeting 6,770 and 6,810. Standard A-tier protocol applies: anticipate at least 2R to the first target based on a 15-minute-anchored stop, limit attempts per level, and enforce daily risk guardrails.
NY PM Window (13:30–16:00 ET): Should the ES remain constrained between 6,700 and 6,800 by early afternoon, the trade dynamic typically shifts from discovery to mean-reversion. Thus, the afternoon should primarily focus on managing existing positions from the morning rather than initiating new aggressive plays. Fresh entries based on trending strategies should only be considered if there is a clear breakout from the established intraday range, whether below S3 or above R3, accompanied by confirmation.
Big-Picture Takeaway: Fundamentally, today’s decline indicates a reassessment of overly optimistic growth and AI valuations, along with near-term Federal Reserve easing, partly prompted by a complicated post-shutdown data environment. Technically, the ES is retreating from a weekly premium into various support zones while maintaining the core bullish structure. Stress indicators favored by large professional investors—such as volatility, options positioning, breadth, credit, and cross-asset behavior—suggest a serious risk-off event has occurred, but they don't exhibit the persistent stress and credit strain typically seen before a full bear market materializes.
As long as the ES decisively holds above the 6,600–6,535 zone and doesn’t reject that area from below, the higher-probability play in the coming sessions is a volatile corrective range, offering tactical opportunities to sell rallies into resistance and buy deeper, well-defined demand zones—always bearing in mind the heightened volatility and macro event risks on the calendar.
