ES (SPX, SPY) Analysis, Levels, Setups, for Fri (Nov 14th)
Today’s session revealed a marked risk-off sentiment as the market began to discipline leading sectors, notably large-cap tech, AI, semiconductors, and high-beta growth stocks. This correction coincided with a reassessment of expectations for near-term Federal Reserve easing and an environment defined by unequal economic data in the wake of the record shutdown.
Despite the abrupt decline, the E-mini S&P 500 (ES) remains in a pullback phase within a broader uptrend, still functioning within a weekly premium and supply zone. This movement exhibits characteristics typical of a sharp correction and repositioning rather than the definitive onset of a bear market. Importantly, prices have yet to break below the last significant daily higher-low region, weekly market structure continues to show constructive signs, and the “stress indicators” monitored by institutional investors are elevated but not yet at levels indicative of a crisis.
Dashboard Context
Volatility: Implied volatility surged today, with equity volatility pushing above previously complacent levels, albeit the term structure remains predominantly upward-sloping rather than inverted. This nuance is critical; while funds are investing more for protection and short-term hedges, the volatility landscape does not yet suggest a disorderly liquidation phase.
Options Positioning: The index and overall put/call ratios have transitioned from a state of complacency to caution, reflecting increased demand for hedging. However, levels are not yet extreme enough to signal panic. Skew is elevated, indicating that investors are bidding for downside protection, although it remains within the upper bounds of a normal range. This suggests that while major institutions are leaning into protective strategies and tactical downside plays, the broader market is not universally positioned for a crash.
Breadth: The internal damage today was notable, with decliners outpacing advancers significantly across major exchanges. This shift in breadth oscillators from positive to negative in a single session points to a broad-based distribution rather than a narrow selloff concentrated in a few prominent names. Historically, such internal damage requires several sessions for a market to recover.
Credit and Funding: High-yield spreads have widened modestly from recent lows, and high-yield ETFs have pulled back from their peaks. Nevertheless, there are no current signs of a credit crisis. Spreads remain well within ranges that do not indicate severe stress, and funding markets continue to operate smoothly. Provided that credit conditions stay stable, current equity weakness is likely more reflective of a valuation and positioning reset than systemic risk.
Cross-Asset Risk: The crypto market experienced a sharp selloff, while global equity indices broadly fell. This behavior confirms a classic cross-asset risk-off scenario, as investors reduced exposure to the highest-beta, most speculative areas while simultaneously de-leveraging from U.S. equity leaders. Conversely, traditional defensive stocks and segments of quality value showed relative resilience, a behavior consistent with a managed de-risking rather than an all-encompassing liquidation.
In summary, the dashboard indicates a shift from “overbought complacency” to a higher-volatility, risk-off environment. However, we have yet to enter a full-scale, credit-driven bear market. This context is essential for interpreting today’s decline in the E-mini S&P 500.
Multi-Timeframe Technical Structure (Weekly → Daily → 4H → 1H)
Weekly: The E-mini remains in an upward trajectory, printing higher highs and higher lows. Prices have retreated from a premium zone established at recent highs. The current weekly bar suggests rejection, yet critically, price levels remain comfortably above the last key weekly higher low near the 6,000 mark. Weekly momentum, previously overstretched to the upside, is rolling over, signaling a potential cooling phase – likely a period of consolidation or corrective drift rather than immediate trend failure.
Daily: On the daily chart, the ES has formed a distinct upper range beneath a weak high. Today’s trading produced a significant red candle, indicating a drop from the upper range back toward its center. The prior swing low around 6,620–6,580 remains intact, but the daily oscillator shows mild bearish divergence relative to the last high – a common occurrence in maturing upswings. This situation conveys the message of “bullish but extended, now in corrective mode,” rather than a definitive shift to a pattern of lower highs and lower lows.
4-Hour: The 4-hour structure has entered a short-term downtrend. A lower high was established in the 6,900–6,920 range, leading to an impulsive sell-off toward demand around 6,730–6,700. This selloff exhibited characteristics of liquidation: substantial red candles, minimal counter-rotation, and strong volume. The 4-hour oscillator shows bearish pressure but is beginning to flatten near support, consistent with an early basing attempt after a sharp sell-off, though additional downside remains possible if negative overnight flows persist.
1-Hour: The 1-hour chart portrays today’s price movement as a decisive liquidation wave.
Today's market decline was driven by three converging factors.
First, we saw a mix of valuation adjustments and crowded positioning. Sectors such as AI, semiconductors, and large-cap growth stocks had experienced significant upward momentum. As a result, profit-taking and forced de-leveraging became evident, especially when the largest index components corrected. This simultaneous adjustment made it challenging for the overall index to hold its ground.
Second, the narrative surrounding interest rates and policy has shifted. Recent commentary from the Federal Reserve has adopted a more cautious tone regarding the pace and scale of future interest rate cuts. With inflation remaining above target and some data being impacted by the government shutdown, policymakers appear hesitant to endorse the market's most optimistic expectations for easing. This recalibration towards a "higher for longer" mindset is detrimental to long-duration growth equities and affects the valuations assigned to market leaders.
Third, while the government shutdown has concluded, the subsequent rhythm of the economic calendar has been disrupted. Several critical data releases have been delayed or are now under scrutiny, prompting investors to navigate through somewhat erratic information. In this context, there has been a notable reluctance to take on risk at elevated valuations without clearer data confirmation. Consequently, we are witnessing a trend of de-risking, characterized by a swift rotation from expensive stocks into cash, defensive positions, and protective strategies.
The outcome has been a pronounced selloff, exhibiting broad downside movement and a surge in volatility. Importantly, this occurred without significant turmoil in credit or funding markets, suggesting that we are dealing with a valuation reset rather than a systemic crisis.
Looking ahead, the question arises: Is this the beginning of a more substantial downtrend or merely a temporary flush? From a structural perspective, the market has yet to breach the typical thresholds that signal the onset of a major downtrend. The previous daily higher low remains in place, the weekly uptrend is still intact, and we have not observed the combination of lower highs and lower lows that would signify a broader bearish phase.
Currently, we are witnessing a rejection from a weekly premium/supply zone, with momentum weakening at both daily and weekly levels. Additionally, there is a clear lower high alongside a liquidation move visible on the four-hour chart, which aligns with the expected behavior during the early stages of a significant correction following an extended rally.
As it stands, the prevailing view is that we are experiencing a sharp corrective phase or volatility spike within the upper range of the ongoing uptrend. While the risk of a more profound correction is heightened, particularly if the support range of 6,600 to 6,535 is breached, the current indicators do not yet suggest a completed market top or a fully developed bearish trend.
A genuine trend transition would likely require:
– a decisive break of S3 and a failed retest from below;
– a sustained period of weak breadth rather than a single-day air pocket;
– and, on the macro side, a clear deterioration in credit and funding conditions alongside a persistent inversion of the equity volatility term structure.
At present, those conditions are not fully in place.
Level-KZ Execution Framework for Tomorrow
Asia/London Participation: If overnight trade pushes the ES down into the 6,710–6,680 range and subsequently prints a rejection with a definitive 15-minute close above that zone, consider it a tactical bounce location. This could target a move back toward the 6,770–6,800 region. Given the event risk, participation should be smaller than usual and approached as preparatory rather than primary risk.
PPI Window (08:30–09:15 ET): The initial 15–30 minutes post-PPI release should be regarded as a discovery phase. If the first impulse upward drives the price into R1/R2 but then closes back below 6,780–6,800 with upper wicks and a failure of the 5-minute structure, it sets up a potential short from the underside of the shelf. Targets for this short could be at 6,720 and then 6,680. Conversely, if the initial market reaction results in a drop to S2/S3 that quickly wicks back and closes above that zone on a 15-minute chart, it presents a tactical bounce long toward the 6,740–6,780 area. The decisive 15-minute close after the data release will provide clarity on which side gains control for the session.
NY AM Kill Zone (09:30–11:00 ET): For short positions, the optimal area remains a rejection from 6,780–6,815 after the PPI reaction is digested. A long upper wick and a return close within that range on a 15-minute chart, paired with a failure in the 5-minute attempts to maintain above, supports a short position. Stops should be placed just above the rejection high, with profit targets initially toward 6,720 and subsequently toward 6,680. Conversely, for long opportunities, an ideal scenario involves a constructive reaction from the 6,700–6,660 support band. This would look for a higher low on the 15-minute chart, reclaiming and holding above 6,700, while sellers falter at S1. In this case, stops would belong below the reaction low, targeting 6,770 and 6,810. Standard A-tier protocol applies: anticipate at least 2R to the first target based on a 15-minute-anchored stop, limit attempts per level, and enforce daily risk guardrails.
NY PM Window (13:30–16:00 ET): Should the ES remain constrained between 6,700 and 6,800 by early afternoon, the trade dynamic typically shifts from discovery to mean-reversion. Thus, the afternoon should primarily focus on managing existing positions from the morning rather than initiating new aggressive plays. Fresh entries based on trending strategies should only be considered if there is a clear breakout from the established intraday range, whether below S3 or above R3, accompanied by confirmation.
Big-Picture Takeaway: Fundamentally, today’s decline indicates a reassessment of overly optimistic growth and AI valuations, along with near-term Federal Reserve easing, partly prompted by a complicated post-shutdown data environment. Technically, the ES is retreating from a weekly premium into various support zones while maintaining the core bullish structure. Stress indicators favored by large professional investors—such as volatility, options positioning, breadth, credit, and cross-asset behavior—suggest a serious risk-off event has occurred, but they don't exhibit the persistent stress and credit strain typically seen before a full bear market materializes.
As long as the ES decisively holds above the 6,600–6,535 zone and doesn’t reject that area from below, the higher-probability play in the coming sessions is a volatile corrective range, offering tactical opportunities to sell rallies into resistance and buy deeper, well-defined demand zones—always bearing in mind the heightened volatility and macro event risks on the calendar.
S&P 500 (SPX500)

S&P500 (US500): Important Breakout & Bullish Continuation
US500 likely completely a correctional movement,
breaking a resistance line of a bullish flag pattern on a 4H time frame.
I think that a bullish wave is going to start soon
and the market will reach at least to 6917 level.
❤️Please, support my work with like, thank you!❤️
I am part of Trade Nation's Influencer program and receive a monthly fee for using their TradingView charts in my analysis.

SPX500 TIME TO BUY NOWSPX500 is in a clear upwards channel and has broken the last bit of resistance (white line shown) - this is a clear confirmation that the next target will be the next resistance zone to the upside shown above (this is a great buy trade opportunity) - Time to buy!

S&P 500 H1 | Bullish Bounce off Key SupportMomentum: Bullish
Price is currently above the ichimoku cloud.
Buy entry: 6,849.07
- Strong overlap support
- 50% Fib retracement
- 100% Fib projection
Stop Loss: 6,814.5
- Swing low support
Take Profit: 6,883.1
- Strong overlap resistance
Stratos Markets Limited (tradu.com/uk ), Stratos Europe Ltd (tradu.com/eu ):
CFDs are complex instruments and come with a high risk of losing money rapidly due to leverage. 70% of retail investor accounts lose money when trading CFDs with this provider. You should consider whether you understand how CFDs work and whether you can afford to take the high risk of losing your money.
Stratos Global LLC (tradu.com/en ): Losses can exceed deposits.

ES (SPX, SPY) Analysis, Levels, Setups for Thu (Nov 13th)HTF Analysis
Daily Chart: The overall trend remains bullish. Currently, the price is situated near the upper range, just below the previous swing high in the 6,960–6,980 zone. The market structure is characterized by a sequence of higher highs and higher lows, indicating that we are experiencing a temporary pause rather than a confirmed peak.
4-Hour Chart: We’re observing a robust V-shaped recovery from the 6,63x–6,66x support zone, with the price now consolidating sideways beneath overhead resistance. The recent 4-hour candles are overlapping within today’s range, suggesting a coiling pattern under resistance rather than a decisive breakout.
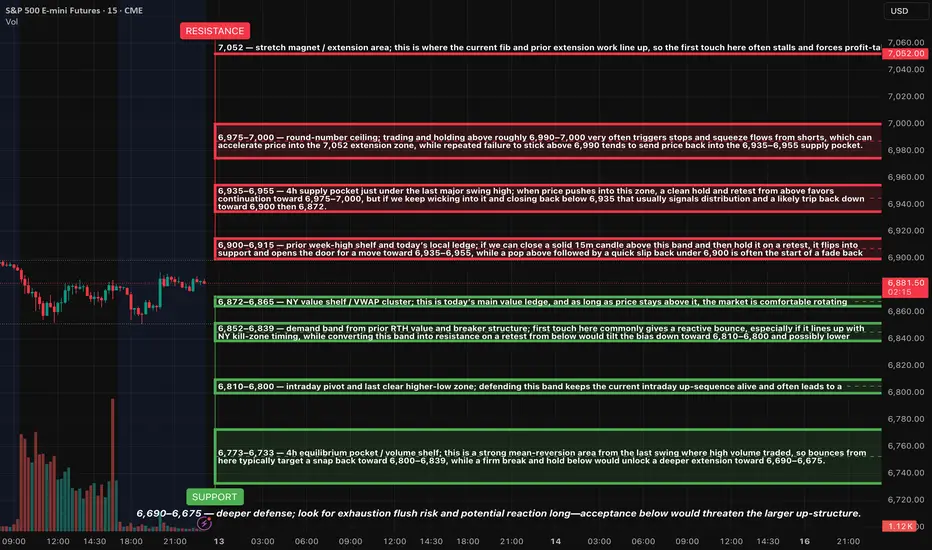
15-Minute to 30-Minute Charts: There’s a well-defined range forming. The highs are established around the 6,900–6,915 level, while the lows are consistently found between the 6,872–6,865 shelf, with further lower shelves below. Today's price action has effectively mapped out a framework for potential trading opportunities moving into tomorrow.
MACRO / EVENTS
The government shutdown has officially ended, and normal operations are resuming across agencies. This removes the associated headline risk. The market can now return its focus to the usual macroeconomic drivers: inflation data, the Federal Reserve's policy path, and corporate earnings.
However, there remains some uncertainty regarding the timing and form of upcoming inflation releases due to previous disruptions in data collection. The 8:30 AM ET time slot is still considered a potential source of market volatility. Aside from that, the economic calendar is relatively light, meaning that trading activity around our key levels will likely drive most of the intraday market movements.
SETUPS FOR TOMORROW (LEVEL–KZ STYLE)
Long setup 1 – bounce from 6,872–6,865
Idea: Look for Asia or London to probe into 6,872–6,865 and hold. If we see a clean rejection candle on 15m or 5m and then price reclaims 6,880 and holds above, that sets up a continuation long.
Trigger concept: Reclaim and hold above 6,880 after testing 6,872–6,865.
Risk anchor: Below 6,865, with a little room for noise depending on spread and volatility.
Initial target: 6,900–6,915.
Secondary target: 6,935–6,955.
Stretch idea: If 6,955 holds as new support and order flow remains strong, leave a small runner with eyes on 6,975–7,000.
Long setup 2 – deeper dip buy at 6,852–6,839 or 6,810–6,800
Idea: If 6,872–6,865 fails cleanly but overnight selling is controlled, watch for a fade into 6,852–6,839 or, in a stronger flush, 6,810–6,800. Look for exhaustion and quick reclaim of the upper edge of the band as a signal that buyers are stepping back in.
Trigger concept: Fast rejection wick through the band followed by a close back above the upper edge on 5m–15m.
Risk anchor: Below the lower edge of the chosen band (either under 6,839 or under 6,800).
Targets: First push back to 6,872–6,865, then 6,900–6,915 if momentum improves.
Short setup 1 – fade 6,900–6,915 pop-and-fail
Idea: If price rips into 6,900–6,915 during NY AM without first testing the lower shelves and then quickly fails to hold above 6,900, that is often a spot to fade the top of the range.
Trigger concept: Wick above 6,900–6,915 with a 5m–15m close back below 6,900.
Risk anchor: Above 6,915–6,920.
Initial target: 6,872–6,865.
Extended target: 6,852–6,839 if 6,872 cracks and holds below.
Short setup 2 – rejection from 6,935–6,955
Idea: If we get a clean breakout above 6,900–6,915 but the first test of 6,935–6,955 stalls with heavy wicks and no follow-through, you can look for a tactical fade of that 4h supply pocket.
Trigger concept: Failure to hold above 6,955, with a rotation back under 6,935 on a 15m close.
Risk anchor: Above 6,960–6,965.
Initial target: 6,900–6,915.
Secondary target: 6,872–6,865 if selling expands.
RISK NOTES
Avoid trading in the middle of the 6,872–6,865 and 6,900–6,915 band; let price push into the edges and then trade the reaction.
Size down if price is very slow and overlapping ahead of the 8:30 ET window; there is no need to swing full size into dead tape.
If you see a sudden spike around the data or headline window, focus first on how price behaves at the key shelves 6,872, 6,900, and 6,935 rather than trying to guess the news.
Moon Boys don't want you to see this Bitcoin/Gold chart !Hi Guys,
We have a massive head & shoulders on the Bitcoin / Gold chart that almost nobody talks about! With all the major players being openly bullish on Bitcoin and while everyone is waiting for the AI bubble to burst ..Bitcoin will be the first one to react considering how easy it can be sold and how volatile it usually is.
The charts don't lie and all markets are clearly at the top so protect you capital at all cost while you still can.
Let me know what do you guys think about this.

S&P500: Slightly higherS&P 500 futures edged slightly higher in yesterday’s session. The index appears to remain within the upward trajectory of magenta wave (5), which is expected to continue pushing higher. Once this wave reaches its peak, the larger blue wave (III) should also complete. Afterward, we anticipate a corrective phase in the form of magenta wave (A), which could put renewed pressure on the index. However, if prices reverse course and fall below the support level at 6,371, our alternative scenario will come into play. In that case, alternative wave alt.(4) would likely extend further downward, targeting a low within the corresponding alternative zone between 6,055 and 5,822 points (probability: 30%).

There might be sudden pump in $LKQ If we can stay above $31,10 we are about to go toward $34. Lets see how this will play out. Good luck for you all

S&P500 H1 | Bullish Bounce off Key SupportMomentum: Bullish
Price is currently above the ichimoku cloud.
Buy entry: 6,811.61
- Pullback support
- 50% Fib retracement
- 100% Fib projection
Stop Loss: 6,773.85
- Swing low support
Take Profit: 6,848.7
- Overlap resistance
Stratos Markets Limited (tradu.com/uk ):
CFDs are complex instruments and come with a high risk of losing money rapidly due to leverage. 68% of retail investor accounts lose money when trading CFDs with this provider. You should consider whether you understand how CFDs work and whether you can afford to take the high risk of losing your money.
Stratos Europe Ltd (tradu.com/eu ):
CFDs are complex instruments and come with a high risk of losing money rapidly due to leverage. 70% of retail investor accounts lose money when trading CFDs with this provider. You should consider whether you understand how CFDs work and whether you can afford to take the high risk of losing your money.

December 2025 is Hurst's 9 Years Cycle!Margin of Error "Adjusted" on the chart:
9 Years, 4.5 Years and 18 Months !
1: September 2025 is our early trough
2: 2027 is our late trough
3: Or we are having one right now !

Nike by April 2025 we should have break out or breakdown !101 Trend lines analysis. By April we should could/might reach the Red line in which we will have a break out to a new ATH in the next years or so or a break down to the 40ish/50ish region.!

Congress Set to End Shutdown | SPX500 Holds Strong Above 6877SPX500 | Overview
U.S. Congress Poised to Get Back to Work
The U.S. government is on the verge of reopening, potentially restoring pay to federal workers and reviving key economic data releases that have been halted for weeks — leaving the Federal Reserve operating with limited visibility.
Renewed optimism over a resolution in Washington has boosted investor sentiment, supporting further upside in U.S. equities.
Technically:
The SPX500 has pushed higher and is now stabilized above the pivot level at 6877, indicating continuation of the bullish trend toward 6918 and 6941, with potential to reach new all-time highs (ATH) if momentum persists.
However, if the price closes a 1H candle below 6866, it would signal short-term weakness, leading to a bearish correction toward 6844 and 6814.
Pivot Line: 6877
Resistance: 6918 · 6941 · 6991
Support: 6845 · 6814 · 6797

The mistake that kept me broke for 2 years!Hey @TradingView Community, I want to tell you something personal...
For two years, I was stuck.
I kept losing trades and I couldn’t figure out why.
It wasn’t because I didn’t work hard.
It wasn’t because I didn’t study the charts.
It was because I was following a trading style that looked smart on paper but failed in real life.
Every week, I waited for that ONE “perfect” setup.
I told myself, “This is how real traders do it.”
But most weeks, nothing came.
And when I finally saw something, I was either late or scared to take it.
Then came the worst part.
After waiting for days and missing good trades, I got frustrated.
So I started forcing trades just to feel like I was doing something.
And of course, I lost even more.
It became a loop:
Waiting → Missing → FOMO → Losing.
Even more? I traded based on emotions and started to add to losing positions! And of course, more losses.
It was too complicated, too slow, and not made for real traders like us.
And of course, everything was built on a foundation of simple to advanced chart patterns and Smart Money Concepts (SMC), candlestick patterns, Elliott waves... I’ve experimented with nearly every well-known form of technical analysis you can think of.
After thousands of hours of studying and backtesting the charts, we discovered a powerful and consistent edge rooted in Wave Analysis.
From our research and findings, we developed our own unique system, the We Trade Waves Wave Analysis Concept. You can see the proven results on our website.
But we also realized that analysis is only one part of the equation, the most important part is building the right mindset and finding your own balance, all while following a proven trading system like the one we’ve built and refined today.
We created a trading system you can follow in a simple and calm way.
You need a working trading system that takes about 15 to 30 minutes a day, and it actually works.
The system that helped me get my time, focus, and money back.
It's the same We Trade Waves system we are teaching to We Trade Waves members now.
And don't forget WTW 4 Golden rules!
1) Do not jump in
2) Do not over risk/trade
3) Do not trade without Stop Loss
4) Never ever add to a losing position!
Take with care,
Alain M(Coach)
WTW Team
TVC:GOLD NYSE:DOW SP:SPX NASDAQ:NDX

ES (SPX, SPY) Analysis, Levels, Setups for Wed (Nov 12)Price closed near the prior week’s highs after a clear four-hour impulsive leg from last Friday’s low. Momentum appears constructive while the 15-minute swing structure holds higher lows above the New York value shelf.
Setups:
Play A — Acceptance Long: Wait for a 15m full-body close ≥6,900 and a 5m pullback that holds ≥6,892–6,895. Enter on a 1m HL reclaim. Hard SL = 15m trigger-wick low minus 0.25–0.50. TP1 6,915. TP2 6,935. TP3 6,955–6,975. Viability gate: TP1 must be ≥2.0R versus the 15m stop.
Play B — Rejection Fade: If 6,900–6,915 rejects with a 15m close back inside ≤6,889, enter on a 5m re-close lower and a 1m LH. Hard SL = 6,905–6,912 (above rejection wick). TP1 6,872. TP2 6,852. TP3 6,839→6,810 if momentum accelerates.
Bias & Invalidation: Bias is mildly bullish while 6,865–6,872 holds on 15m closes. Bias flips neutral-to-bearish on decisive 15m body-through below 6,839.
Kill-Zones (ET): NY AM 09:30–11:00 for entries. Manage through Lunch. NY PM 13:30–16:00 for follow-through or fades into exhaustion.
News & Events (tomorrow): No CPI risk on the docket. Watch the U.S. 10-Year Note auction around 13:00 ET and headline risk from the OPEC and IEA monthly oil reports in the morning; both can sway rates and index tone.

$SPX: DIP BUYNG IS THE RULE FOR NOW The strategy of buying on dips has proven effective once again, underscoring the current strength of the market. The 10- and 20-day moving averages are no longer relevant as support or resistance levels; instead, their slopes indicate the short-term trend. We will focus on the 20-day simple moving average (SMA), which remains in a positive slope. The key moving average for maintaining the upward trend is the 50-day SMA. The S&P 500 has easily recovered above the 0.618 Fibonacci retracement level and is just 73 points away from its all-time high; it appears quite feasible to set a new record.
However, there is a slight concern regarding the technology sector, which seems to be carrying more weight in the market. If the end of the shutdown is indeed approaching, the uncertainty will likely conclude with the release of economic data. Therefore, given this display of market strength, a wait-and-see approach may develop, which could lead to sideways trading—a situation that could be quite frustrating.

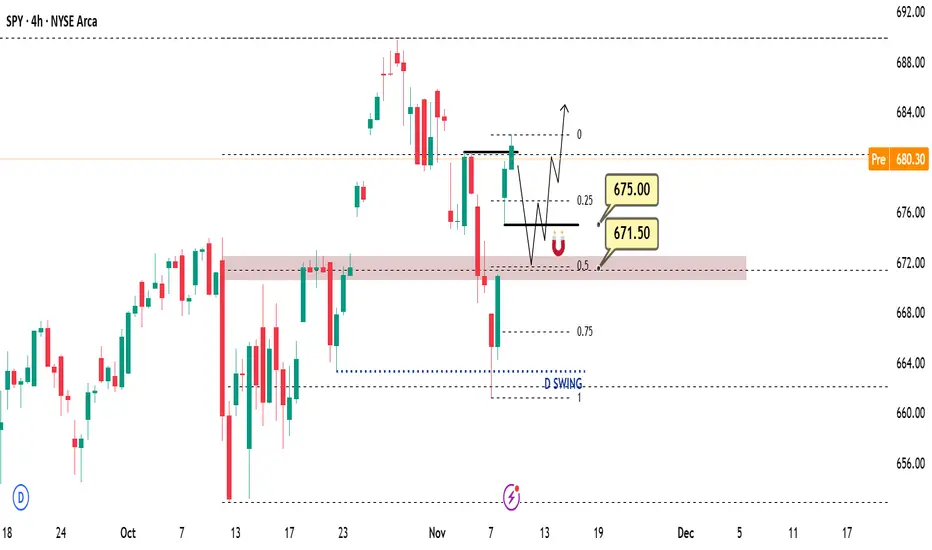
Daily SPY (US500) Outlook - Prediction (11 NOV)Daily SPY (US500) Outlook - Prediction (11 NOV)
📊 Market Sentiment
The market is turning bullish following the potential resolution of the U.S. government shutdown, along with the proposed $2,000 incentives for U.S. citizens. These factors could create strong inflows into equities and improve short-term sentiment.
📈 Technical Analysis
Price moved sharply higher on Monday, reaching the 681 level as expected (see my previous SPY outlook). The 681 level remains a strong resistance zone, and we have already seen a rejection from that area.
📌 Game Plan
In my opinion, the market may turn short-term bearish today. After rejecting 681, the price could target the 675 level and possibly though not necessarily reach 671.5.
My plan is to short the market toward 675 and observe if a bounce occurs. If it does, I will look to buy calls, expecting a move toward new highs around 685.
💬For detailed insights and broader market context, please check my Substack link in profile.
⚠️ For educational purposes only. This is not financial advice.
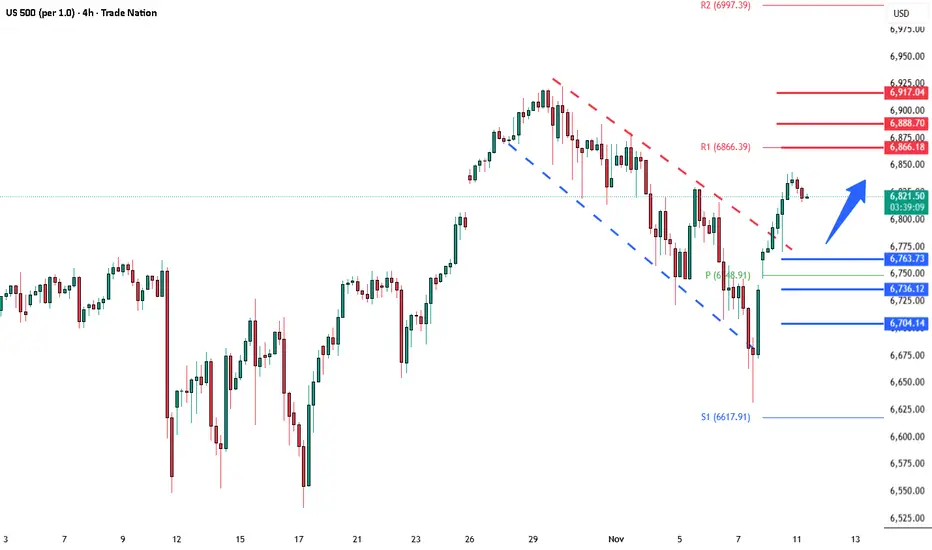
S&P500 Positive sentiment from tech reboundOverview:
Wall Street rallied strongly yesterday, led by tech stocks. The NASDAQ gained +2.27%, and the Magnificent 7 surged +2.79%, with Nvidia (+5.79%) leading after its biggest jump since April. Broader gains were more moderate — the equal-weight S&P 500 rose +0.52%, and Russell 2000 +0.94% — showing the rally was concentrated in large-cap tech.
Drivers of Sentiment:
Tech rebound: Nvidia’s recovery and strong performance in other mega-caps fueled optimism.
Trade optimism: Trump said the US is “pretty close” to trade deals with India and Switzerland, potentially reducing tariffs.
Political progress: The US government funding deal advanced in the Senate, easing shutdown concerns.
Market Takeaway for Today:
S&P 500 likely to open steady to slightly higher, supported by risk-on momentum from tech.
Focus on whether the rally broadens beyond mega-caps — equal-weight S&P lagging suggests narrow leadership.
Short-term tone: Positive sentiment from tech rebound, trade deal hopes, and easing US political risk, but watch for consolidation after strong gains.
Key Support and Resistance Levels
Resistance Level 1: 6866
Resistance Level 2: 6889
Resistance Level 3: 6917
Support Level 1: 6763
Support Level 2: 6736
Support Level 3: 6700
This communication is for informational purposes only and should not be viewed as any form of recommendation as to a particular course of action or as investment advice. It is not intended as an offer or solicitation for the purchase or sale of any financial instrument or as an official confirmation of any transaction. Opinions, estimates and assumptions expressed herein are made as of the date of this communication and are subject to change without notice. This communication has been prepared based upon information, including market prices, data and other information, believed to be reliable; however, Trade Nation does not warrant its completeness or accuracy. All market prices and market data contained in or attached to this communication are indicative and subject to change without notice.
SPX wedge breakout: Reopen relief, 6780 tetest, 7k in SightS&P500 breaks out of a broadening wedge and retests 6780 support as government reopening odds fuel a relief bid.
Senate progress towards ending the record shutdown has lifted the overhang on data releases and growth, triggering a risk-on bounce across US indices. Price action confirmed a breakout with a clean throwback to 6780, aided by hidden bullish divergence on momentum before the surge to 6850.
Key drivers:
Government reopening: bipartisan Senate advance and White House support shift odds towards a near‑term resolution.
Technical confirmation: breakout from falling/broadening wedge, successful retest and RSI reset from overbought at 6850 towards midline supports continuation higher if 50 line holds.
Levels in play: support 6800–6775 and 6750; resistance 6850–6890 then 6930 with psychological 7000 on extension if momentum rebuilds.
Risk: reopening unleashes delayed macro data. A miss or policy hiccup could pull the price back toward the 50% area before the trend resumes and ahead of Nvidia earnings next week.
Bias stays long while above 6775: buy dips to 6750 with invalidation below 6725; If 6690 fails on a daily close, step aside and reassess.

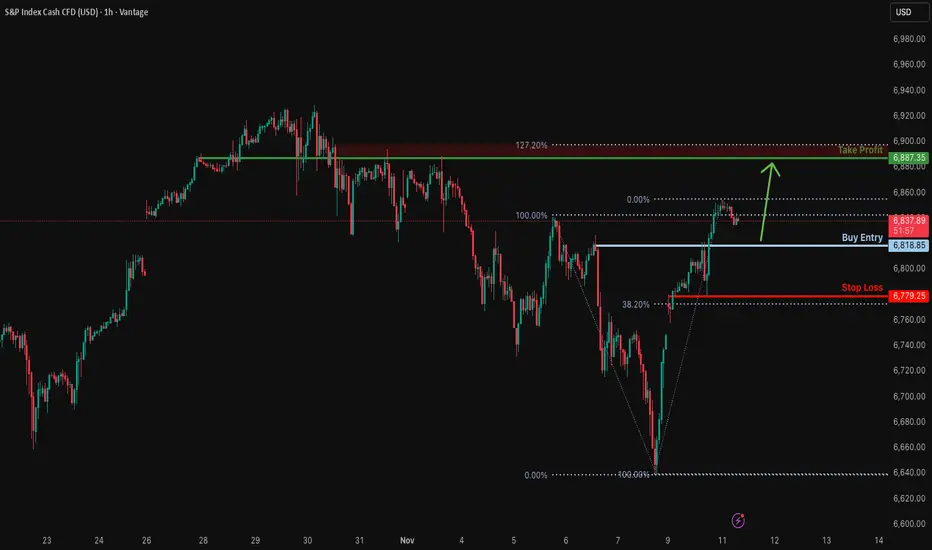
Bullish continuation setup?S&P500 is falling towards the support level, which is a pullback support and could bounce from this level to our take profit.
Entry: 6,618.85
Why we like it:
There is a pullback support level.
Stop loss: 6,779.25
Why we like it:
There is a pullback support that lines up with the 38.2% Fibonacci retracement.
Take profit: 6,887.35
Why we like it:
There is an overlap resistance that is slightly below the 127.2% Fibonacci extension.
Enjoying your TradingView experience? Review us!
Please be advised that the information presented on TradingView is provided to Vantage (‘Vantage Global Limited’, ‘we’) by a third-party provider (‘Everest Fortune Group’). Please be reminded that you are solely responsible for the trading decisions on your account. There is a very high degree of risk involved in trading. Any information and/or content is intended entirely for research, educational and informational purposes only and does not constitute investment or consultation advice or investment strategy. The information is not tailored to the investment needs of any specific person and therefore does not involve a consideration of any of the investment objectives, financial situation or needs of any viewer that may receive it. Kindly also note that past performance is not a reliable indicator of future results. Actual results may differ materially from those anticipated in forward-looking or past performance statements. We assume no liability as to the accuracy or completeness of any of the information and/or content provided herein and the Company cannot be held responsible for any omission, mistake nor for any loss or damage including without limitation to any loss of profit which may arise from reliance on any information supplied by Everest Fortune Group.
Hellena | SPX500 (4H): LONG to max of wave "3" area of 6929.4.Good afternoon colleagues, it looks like the correction is ending and soon I expect wave “5” in the upward movement. Perhaps wave “4” will update the low of 6637.8 before the upward movement.
I expect to reach the maximum of wave “3” at 6929.4. Further we will observe the price behavior in this area.
Fundamental Background
The US stock market remains positive: business activity data showed a steady expansion, which strengthens confidence in corporate earnings.
Manage your capital correctly and competently! Only enter trades based on reliable patterns!

S&P 500 Extreme Breadth Reading! Caution!Why It Matters
Strong breadth = healthy rally, broad participation → more sustainable trend.
Weak breadth = top-heavy rally, fragile momentum → prone to correction.
Think of it like an airplane:
If all four engines (hundreds of stocks) are pushing, you can climb easily.
If one engine (a few mega-caps) is doing all the work, you can stay aloft — but not for long!
CAUTION! is in order!
Click boost, follow, comment nicely for more authentic, no BS, raw analysis. Let's get to 6,000 followers. ))

ES (SPX, SPY) Analysis, Key Levels, Setups for (Nov 11th)S (Dec) Plan for Tue, Nov 11 — Level-KZ Protocol (15/5/1).
Bias is constructive while trading above the 6,838–6,845 range; the first test into 6,880–6,900 serves as a decision point. Thinner liquidity is expected around the U.S. holiday, so execute trades only within NY kill zones.
Setups (trade the level → next level; 15m→5m→1m sequence)
Long — Bounce at 6,838–6,845: sweep/quick-reclaim → 5m re-close → 1m HL entry. Hard SL below 6,830 wick. TP1 6,872–6,880, TP2 6,900, TP3 6,930. Viability gate: TP1 ≥ 2.0R.
Long — Acceptance above 6,900: full 15m body close >6,900 → hold the retest → 1m HL. SL below trigger wick. TP1 6,930, TP2 6,955–6,970, runner eyes weak-high cleanup.
Short — Rejection fade 6,900–6,930: wick through → 15m close back below 6,895 → 5m LH. SL above session high. TP1 6,872, TP2 6,845, TP3 6,805; lose 6,805 and momentum can slide toward 6,770 then 6,733.
News & session conditions (ET)
U.S. Veterans Day — equities open; U.S. bond market closed; U.S. macro slate is light. Overnight focus: NZ inflation expectations (evening ET), U.K. Labour Market (pre-London), Germany ZEW (pre-NY). Expect patchy liquidity around the holiday; be strict with the 2R viability gate and trade only inside NY AM/PM kill-zones.

S&P 500 (ES1!): Is This The Dip We Were Waiting For? Yes!Welcome back to the Weekly Forex Forecast or the week of Nov. 10-14th.
In this video, we will analyze the following FX market: S&P 500 (ES1!)
The S&P500 is respecting the Weekly +FVG... barely! Friday's rally may indicate the pullback is over and the resumption of the bullish momentum is upon us.
Look for valid buy setups only! Sells are not valid unless there is a bearish break of structure!
Enjoy!
May profits be upon you.
Leave any questions or comments in the comment section.
I appreciate any feedback from my viewers!
Like and/or subscribe if you want more accurate analysis.
Thank you so much.
Disclaimer:
I do not provide personal investment advice and I am not a qualified licensed investment advisor.
All information found here, including any ideas, opinions, views, predictions, forecasts, commentaries, suggestions, expressed or implied herein, are for informational, entertainment or educational purposes only and should not be construed as personal investment advice. While the information provided is believed to be accurate, it may include errors or inaccuracies.
I will not and cannot be held liable for any actions you take as a result of anything you read here.
Conduct your own due diligence, or consult a licensed financial advisor or broker before making any and all investment decisions. Any investments, trades, speculations, or decisions made on the basis of any information found on this channel, expressed or implied herein, are committed at your own risk, financial or otherwise.
