Spx500analysis

SP500 WeeklyLooking at the SP500 Weekly chart, we have so far retraced about 11% from the top, and it doesn't seem to be the bottom. The market appears to be going for another test of the 4200-4250 area. If the support breaks, we could reach the 4000-3900 zone.
If we try to simulate Covid not happening, consider that the market has seen a higher growth before Covid, take into account all other factors (FED, inflation, current tensions) and try to simulate longer-term behavior, it also brings us towards the 3900-4000 area.
The area of 3900-4000 seems to be where Weekly EMA200 would be touched, which SP500 likes to test. On top of that, the correction of SP500 would be close to 20%, which doesn't sound unreasonable.
If SP500 weekly support at 4200-4250 breaks, it could take up until late May for the market to find the bottom and reverse the trend.
Better safe than sorry.

SPX500 about to fall! Good FX-Trades incoming!Hey Tradomaniacs,
Here two key-notes that shows a divergence of the ECB and FED:
1️⃣ Very hawkish FED
"The market now sees a strong chance of the Federal Reserve starting its monetary policy tightening with a 50 basis point hike in March, especially after St. Louis Fed President James Bullard stated that he has become "dramatically" more hawkish. He added that he now wants a full percentage point of interest rate hikes over the next three U.S. central bank policy meetings."
2️⃣ Very cautious ECB
"European Central Bank President Christine Lagarde warned on Thursday that tightening monetary policy too quickly could harm the eurozone’s economic recovery, warning that the Eurozone can’t be compared to other major regions."
Read the article 👉 www.investing.com
Just in this post we can see clearly find nice opportunities as the euro is likely to fall while the Us-Dollar should continue its rally from yesterday.
Look at SPX500 and the fakeout 👉
You remember this chart? The rumors by JP Morgan have caused a rally.
One concern I have is that short-term-yields are currently stronger than long-term-yields. As long as these moves are not too extended we won`t see inverted yield-curves but as soon as that happens the markt could expect the FED to overthink its current plans as an inverted yield-curve is a sign for a recession. (I`ve explained why and how thats a problem for banks)
However, we finally might get good moves after this choppy week since we have seen the important inflation-data. 👌

ES megaphone at play?Will we find a low at 4330/4350 range or are we heading lower to 4225/4250? Time will tell.

SPX is about to reverse, wave 5 of C is almost completed.Hi everyone, SPX is about to complet the C wave inside this Zig Zag ABC. Max wave 5 target (the 261.8%) fib is at 4500. It's a very clean pattern, impulse down in A, ABC in B and impulse down in C on the 100% fib. SPX is already diverging (bullish Divergence Class A on the RSI).
The big question is what's next...?
It can be 2 things now, a new higher high or the beginning of a WXY in what i think can be a Cycle Wave 4 retracement.
Where this Wave 4 can go ? At least to 3935 in the 0.24 fib from our last wave 2 we made in March 2009. But in between 0.3 and 0.5 more common (probable).
Best to you !! Thanks for your comments !

SPX500 hrly long | Algorithm Trading SPX500 hrly long
buystop @ 4415
TP #1 @ 4445 74.63% wr
TP #2 @ 4511 47.76% wr
SL @ swing low 4285 17.91% hr
WR and HR determined from past trades.
More trades like this on my profile or Bifrosttrades.com

S&P500 day trade targetafter a powerful short momentum it need a good correction until wee see what will happen for interest rate

S&P INDEXHello traders. I expect the price to correct at least 50% of its previous uptrend after the end of the pullback. Be profitable

SPX500 BEAUTIFUL FREE Entry + Exits!Ignore green entry!
The 1on1 video is currently out, if you would like it in order to understand how to play my analysis FULLY, please let me know privately.
All likes/comments and feedback are very much appreciated!
How to play my chart:
Buy at support, sell at resistance. When you open this chart you'll see a green entry and a red entry. When the candlestick hits the green entry, you place a buy. If however that support buy doesn't go into profit and goes negative -35 or -60 pips (depending if it was a fast break/or if the break landed on a minute 15 zone), if it breaks you would then exit your buy and immediately enter the sell. You would then ride that sell down to green TP1, or you could then repeat and play the buy/break there.
The same exact thing goes for resistance sell/break plays!

S&P downside target 4350S&P is completing right shoulder. On neck line break, 4350 level may be reached.

S&P500 INDEX - ATH is comingHello friends.
Please support my work by clicking the LIKE button(If you liked).Thank you!
Everything on the chart.
I'm waiting for an upward movement from the current ones or through ~4650.
TP: 4850 and 5000
cancellation of growth, consolidation below 4500
risk is justified
Good luck everyone!
Follow me on TRADINGView, if you don't want to miss my next analysis or signals.
It's not financial advice.
Dont Forget, always make your own research before to trade my ideas!
Open to any questions and suggestions.

SPX500 Long Setup$SPX500 Weekly Analysis (Long)
Based on the formed ascending channel, I believe price is currently in overbought territory, and as such it will retrace back down to the lower trend line. The zone of interest is between $4,646 and $4,710.
That is of course in case the price doesn't go through the highest high level ($4,815), in which case I will either be buying the breakout or wait for a pullback in order to open a long.
Those with higher risk appetite may decide to short the security down to the above mentioned level. I personally may do that, but I'm still waiting for some more solid confirmation

SPXUSD#SPXUSD Sell Trade setup now price on supply zone best trade for short term selling. Multiple time frame analysis.
Thank you..

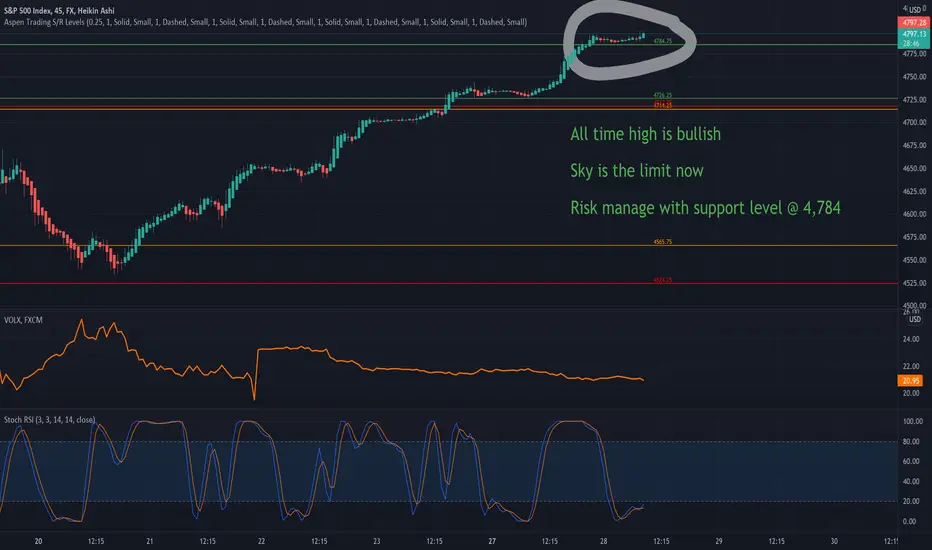
SPX sky is the limit now SPX is trading at all time highs now. We remain bullish but will keep a support level at 4784 to manage our risk.
We use Aspen Trading Support & Resistance Levels to risk manage our positions. These levels are invite only and can be accessed through url in my profile information.
Disclaimer: This analysis is for information purpose only and does not constitute any investment advice.
SPX500USDHello. Due to the negative divergence and the formation of a lower floor, I predict that the 4500 will decrease again

S&P 500 Forecast: Index Pulls Back From 4700 Yet AgainThe S&P 500 has pulled back during the trading session on Thursday to show signs of weakness at the 4700 level yet again. This hesitation is something that we have seen more than once, therefore it suggests that it is going to take a significant amount of momentum to finally break out to the upside. The 50 day EMA underneath sits just below the 4600 level, which is an area that has been noisy here recently as well. That being said, I think the market is probably going to continue to see a lot of volatility as we head towards the end of the year, but I do believe that the “Santa Claus rally” is still going to be the big story.
On a pullback, I will be looking at this market for signs of strength and a bounce, therefore I will get long again. I have no interest in shorting this market, we are far too strong and although the last couple of days have been a bit difficult to deal with, we are only down about 0.2% or so from the all-time highs. This is hardly a market that is falling apart, so I think it is only a matter of time before we see value hunters taking control of this market yet again. I think at this point in time it is difficult to get overly aggressive one way or the other, but if we get a significant selling move, then I will be looking to “leg into the position.” I will add slowly and wait for opportunities on signs of recovery to get involved in a market that is obviously heading in one direction over the longer term.
I believe that the 4500 level is going to be a bit of a floor in the market, and therefore I think we continue to see plenty of money managers out there willing to pick up value due to the fact that they are chasing those returns. If we were to break down below the uptrend line, then we could go looking towards the 200 day EMA, but it is very unlikely that we will see that happen. If we do, then it could be due to a lack of liquidity as we head towards the holidays. That being said, this is a market that retains its overall shape.

ConclusionAt the morning I posted the the S&P will go long but it didn't, unfortunately it decided to stay consolidating in the channel you see in the picture, by going to the daily chart we have a beautiful spring box which is an acceleration of the bullish trend.
See you tomorrow in a new forecast !

BUY SPX500Good morning traders !
You might wonder why I said that the market will go long while it's consolidating and we can't decide if it surely will. Following my strategy and some analysis I've made it will long.
Buy S&P now and place SL and TP on your own.

SPX500 Short Setup$SPX500 Long Setup
🔵 Entry Level: $4560.0
🟢 Take Profit: $4500.0 (2.31R)
⛔ Stop Loss: $4586.0
Reasons:
- Reached upper trendline in a descending channe

S&P 500 Forecast: Index Wipes Out Most of Wednesday LossesThe S&P 500 has rallied significantly during the course of trading on Thursday to wipe out the losses from the Wednesday session. We managed to close above the 50 day EMA, as it looks like markets are ready to continue to go to the upside for a longer-term move. All things being equal, this is a market that I think continues to see plenty of interest, as we have seen so much in the way of bullish behavior over the last several months.
Yes, the market has negative for a while, but that has been the most recent behavior, and at this point in time it is but a blip on the radar of the longer-term trend. That being said, the market is likely to continue to see buyers looking for value, especially as the end of the year approaches, and people will be looking to reach some type of benchmark for their clients. Because of this, we have the so-called “Santa Claus rally” that typically happens at the end of every year, and I do not see this year being any different. Because of this, I think what we have is a scenario where every dip will be bought into, and we will eventually go looking towards the 4800 level.
The market is currently hanging around the 50 day EMA, so that will attract a lot of trading, but at the end of the day the most important thing to pay attention to here is the fact that the jobs number is coming out on Friday, and it will almost certainly cause a significant amount of volatility. The market selling off quite drastically on Friday will almost certainly be bought back into, which is typically the case with the Non-Farm Payroll Friday situation. This is because liquidity disappears, and people will find some type of narrative to start buying the dips. That is what Wall Street does, it finds reasons to go higher. Furthermore, even though the Federal Reserve is pretending like it is worried about inflation, the reality is that the first time Wall Street throws a serious tantrum, they will step in and save the banks. Because of this, it is not really a market so much as it is a bidding war to see who can push things higher over the longer term.

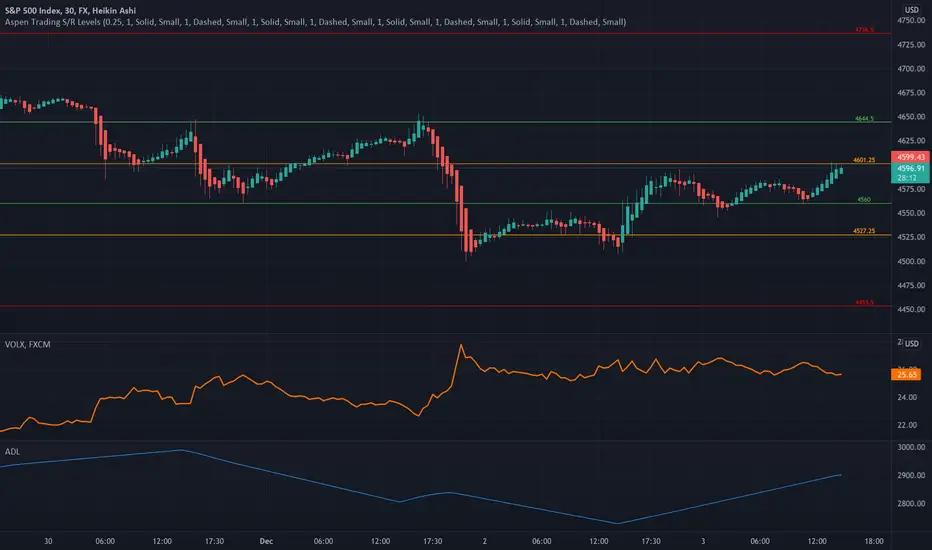
S&P volatility is high - focus on the support & resistance levelCan't stress this enough, especially in terms of the S&P’s, trade the levels and stop trying to forecast. The volatility intra-day is insane.
Aspen Trading S/R levels are invite only and can be accessed through my profile information. They can be automatically drawn on your charts.
Disclaimer: This analysis is for information purpose only and does not constitute any investment advice.
SPX500 Long SetupS&P 500 Long Setup
🔵 Entry Level: $4485.5
🟢 Take Profit: $4598.5 (2.59R)
⛔ Stop Loss: $4441.8
Reasons:
- Expecting price to respect the lower trendline in the descending channel one more time before correcting to the upper one
- Entry level is also previous resistance level from August and September

SOLOMON NUMBER of SPX (S&P 500)The Solomon Number of SPX is: 4705
Instructions:
A- Every DECREASE in price is an opportunity to BUY. The Target is Solomon Number 4705.
B- Once the Solomon Number is touched the analysis is no longer valid to enter OR take long again.
D- Apply proper risk management according to your balance.
1st long entry@ now 4594
2nd long entry@ 4550
TP@ 4705
