S&P500 - $8.000 is the ultimate target!🎊S&P500 ( TVC:SPX ) continues the bullrun:
🔎Analysis summary:
Over the course of the past couple of months, the S&P500 has been rallying +40%. However, this does not mean that the bullrun is over any time soon. Since the S&P500 perfectly respects the rising channel pattern, a move to the upper trendline is the target.
📝Levels to watch:
$8,000
SwingTraderPhil
SwingTrading.Simplified. | Investing.Simplified. | #LONGTERMVISION
Spx500long

BUY SPX - S&P500- Profitable trade opportunity!Based on our deep analysis we can see that SPX (S&P500) will head to the upside. Great time to BUY - it is currently in a uptrend and is holding on to powerful support levels. The next target is the resistance level to the upside. This is a great low risk high reward trade. BUY NOW!

BUY SPX - S&P500- Amazing low risk high reward trade!Based on our deep analysis we can see that SPX - S&P500 will head to the upside. Great time to buy - it has broken major resistance levels + trends.

SPX500 | HULL MA & Fibo Confluence Setting Up the Move!🎯 SPX500: The "Polite Thief" Strategy - Stealing Profits Like a Gentleman 🎩💰
📊 Market Overview
Asset: SPX500 (S&P 500 Index CFD)
Trade Type: Swing/Day Trade Opportunity
Bias: Bullish 🐂
Strategy Style: Multi-Layer Entry (The "Thief Method")
🔍 Technical Setup
The Plan: We're eyeing a bullish confirmation with a clean retest/pullback at the 38.2% Fibonacci level, aligned beautifully with our HULL Moving Average. This confluence zone is screaming "buy the dip" louder than your portfolio manager at a market crash! 📈
🎯 Entry Strategy Options:
Option 1: The "Polite Thief" Multi-Layer Approach
Instead of going all-in like it's a Vegas buffet, we're using calculated limit orders:
📍 Layer 1: 6620
📍 Layer 2: 6640
📍 Layer 3: 6660
📍 Layer 4: 6680
Feel free to add more layers based on your account size and risk appetite!
Option 2: Market Execution
Jump in at any current price level if the setup confirms during live hours.
🛡️ Risk Management
Stop Loss: 6580
⚠️ Disclaimer: Dear Ladies & Gentlemen (Thief OG's), this is MY stop loss based on MY analysis. You're the captain of your own ship! 🚢 Set your risk parameters according to YOUR comfort level and account size. Risk management is YOUR responsibility.
💎 Profit Target
Target Zone: 6860
This level represents our "Electric Shock Wall" 🔌⚡ - a confluence of:
Strong historical resistance
Overbought territory potential
Bull trap zone (where late entries get caught)
Exit Strategy Note: I'm not your financial advisor! 💼 When you see green, secure those gains at YOUR discretion. The market doesn't care about our targets - take profit when YOU feel comfortable!
🌐 Related Pairs to Watch
Keep your eyes on these correlated instruments:
📈 AMEX:SPY (S&P 500 ETF) - Moves in lockstep with SPX500; watch for volume confirmation
📈 NASDAQ:QQQ (Nasdaq-100 ETF) - Tech-heavy index; bullish momentum here supports SPX strength
📈 AMEX:DIA (Dow Jones ETF) - Broader market sentiment indicator
📈 TVC:VIX (Volatility Index) - Inverse correlation; falling VIX = bullish for equities
💵 TVC:DXY (US Dollar Index) - Typically inverse to equities; weakening dollar supports stocks
Key Correlation: When tech leads (QQQ pumping), SPX usually follows. Watch for VIX to stay subdued below 15 for sustained bullish momentum.
📝 Key Technical Points
✅ 38.2% Fibonacci retracement acting as dynamic support
✅ HULL Moving Average confluence strengthens the setup
✅ Multi-layer entry reduces average cost and timing risk
✅ Clear risk/reward structure with defined zones
✅ Resistance zone identified for disciplined exits
⚡ The "Thief Strategy" Philosophy
We're not robbing the market - we're borrowing profits with permission! 😉 The layered entry approach allows us to build positions like a professional, not gamble like a reckless amateur. Scale in, scale out, and live to trade another day!
✨ If you find value in my analysis, a 👍 and 🚀 boost is much appreciated — it helps me share more setups with the community!
⚠️ Final Disclaimer
IMPORTANT: This "Thief Style" trading strategy is for educational and entertainment purposes only! 🎪 This is NOT financial advice. I'm sharing my personal analysis and trade ideas - what you do with your money is 100% YOUR decision. Trade at your own risk, manage your own capital, and never risk more than you can afford to lose. Past performance doesn't guarantee future results. Always do your own research! 🔍
#SPX500 #SP500 #TradingIdeas #SwingTrading #DayTrading #TechnicalAnalysis #FibonacciRetracement #SupportAndResistance #RiskManagement #TradingStrategy #StockMarket #IndexTrading #ThiefStrategy #LayeredEntry #PriceAction #MarketAnalysis #TradingCommunity #ChartAnalysis

SPX500 Long From Support!
HI,Traders !
#SPX500 made a retest
Of the wide horizontal
Support level of 6581.19
And a local rebound is
Already taking place so
We are bullish baised
And we think that a local
Bullish correction is to
Be expected !
Comment and subscribe to help us grow !

From 'pullbacks' to a 'correction' (S&P 500)Setup
Still Bullish. Be patient for entry near end of the corrective move lower
Evidence..
-Trend is up, no top pattern
-No longer 'dips' to 50 DMA, now into a 'correction' with possible move towards 100 DMA
-Large bearish engulfing weekly candle
-The 4 month old trendline has broken.
-RSI has dropped under support - but not yet characteristic of bearish trend by going oversold
-Price has landed at a demand zone under 6500 (could rebound from here)
Signal
Looking to go long on another test of the demand zone OR
at next supports found at matching lows of 6350 then 6200

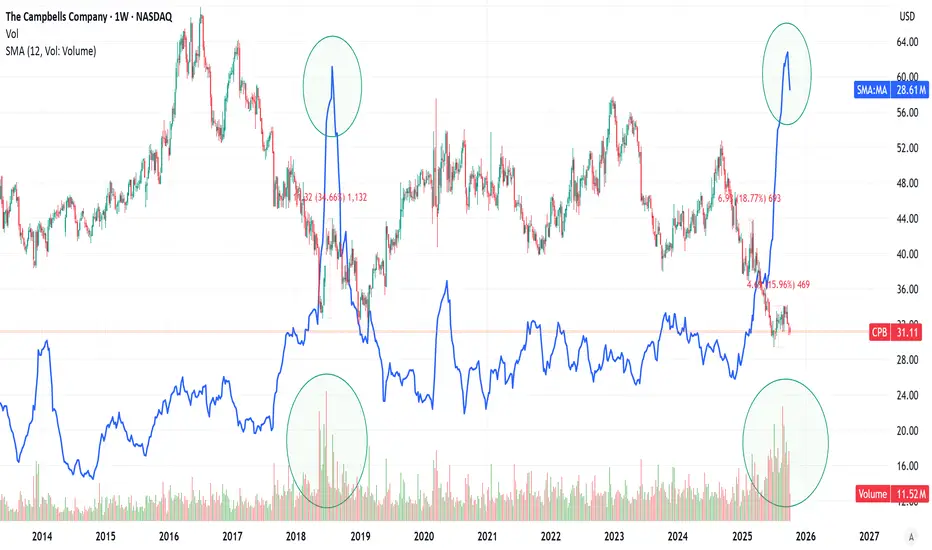
The Campbell's Company "Volume" guys out there, this is for YOU!" Volume of trade measures the total number of shares or contracts transacted for a specified security during a specified time period. It includes the total number of shares transacted between a buyer and seller during a transaction. When securities are more actively traded, their trade volume is high, and when securities are less actively traded, their trade volume is low."
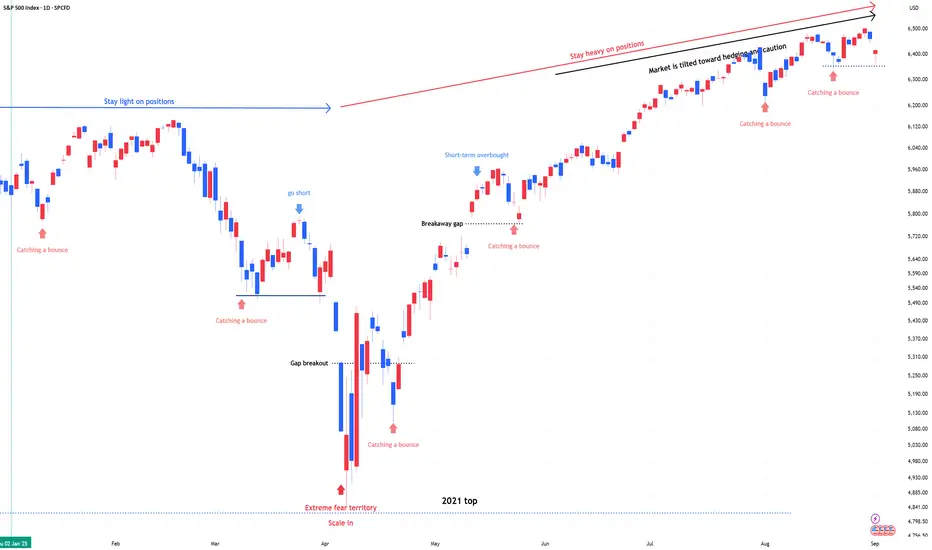
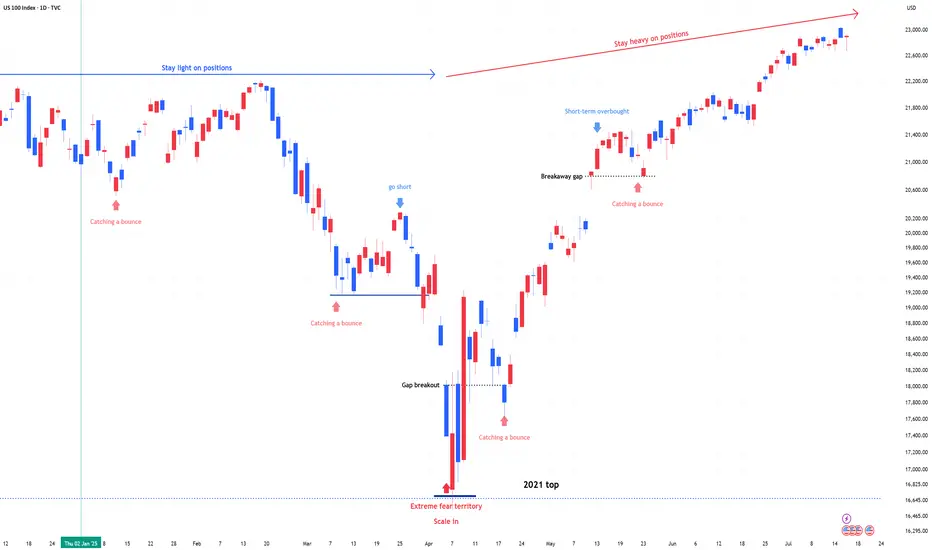
SPX & NDX : Stay heavy on positionsSPX & NDX : Stay heavy on positions (2x leverage)
Same view as before. No change
** This analysis is based solely on the quantification of crowd psychology.
It does not incorporate price action, trading volume, or macroeconomic indicators.
SPX500 Bullish Breakout!
HI,Traders !
#SPX500 is trading in a
Strong uptrend and is made a bullish
Breakout of the key
Horizontal level of 6470.89
Which is now a support
And as the breakout is
Confirmed we will be
Expecting a further bullish !
Comment and subscribe to help us grow !

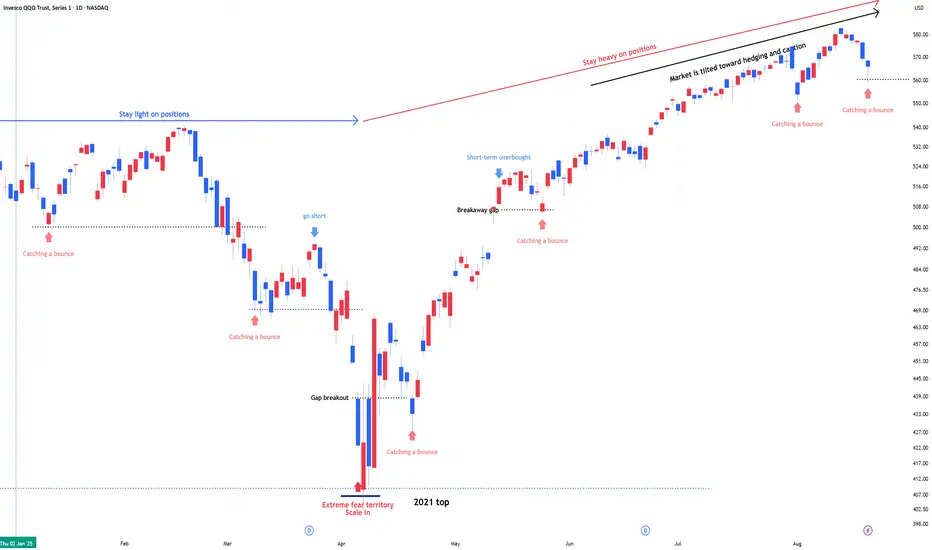
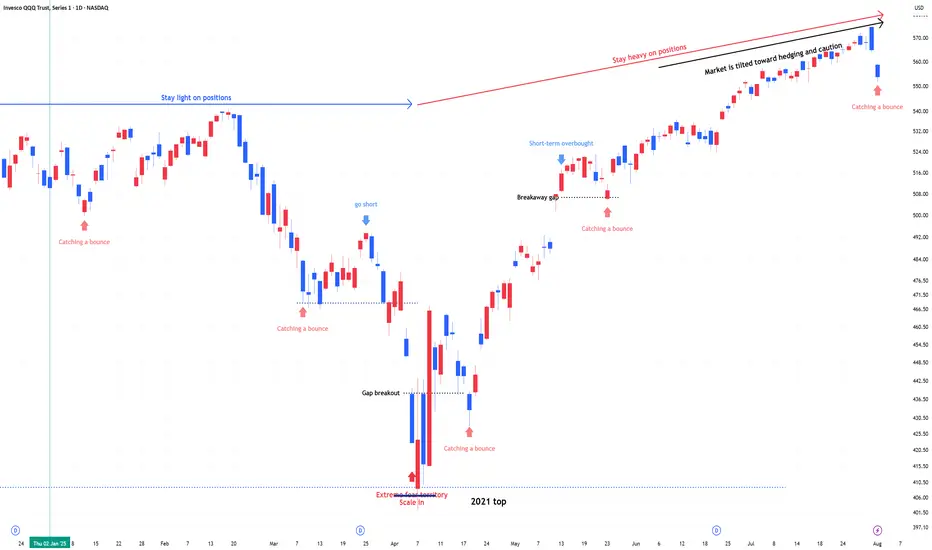
QQQ , Stay heavy on positions. QLD or TQQQ , Stay heavy on positions.
Same view as before. No change.
A signal for catching a bounce has emerged.
The bounce signal reflects a swing-to-intraday view and is not tied to the broader trend.
In stay light on positions zones, I hold QQQ and reduce exposure.
In stay heavy on positions zones, I increase allocation using a mix of QLD and TQQQ.
** This analysis is based solely on the quantification of crowd psychology.
It does not incorporate price action, trading volume, or macroeconomic indicators.
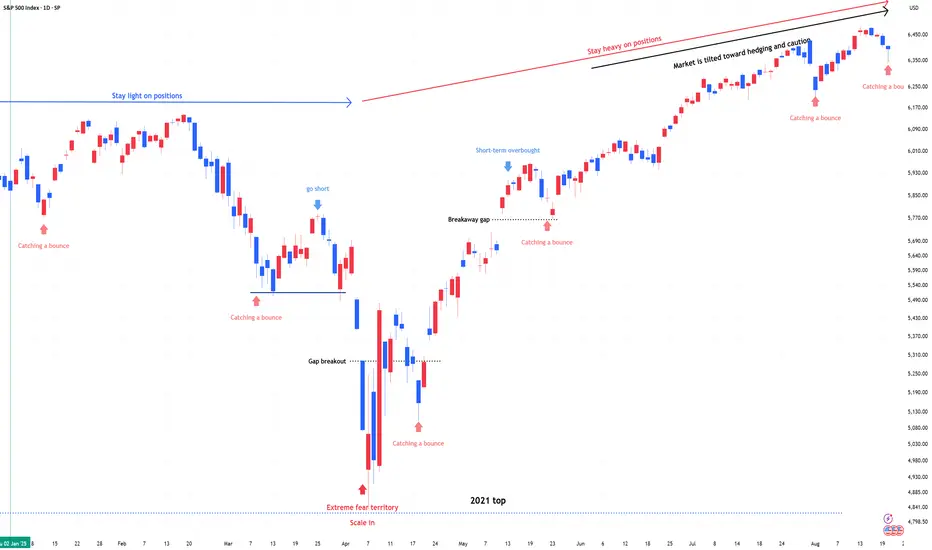
SPX & NDX , Stay heavy on positions.SPX & NDX , Stay heavy on positions. (2x leverage)
Same view as before. No change.
A signal for catching a bounce has emerged.
The bounce signal reflects a swing-to-intraday view and is not tied to the broader trend.
** This analysis is based solely on the quantification of crowd psychology.
It does not incorporate price action, trading volume, or macroeconomic indicators.
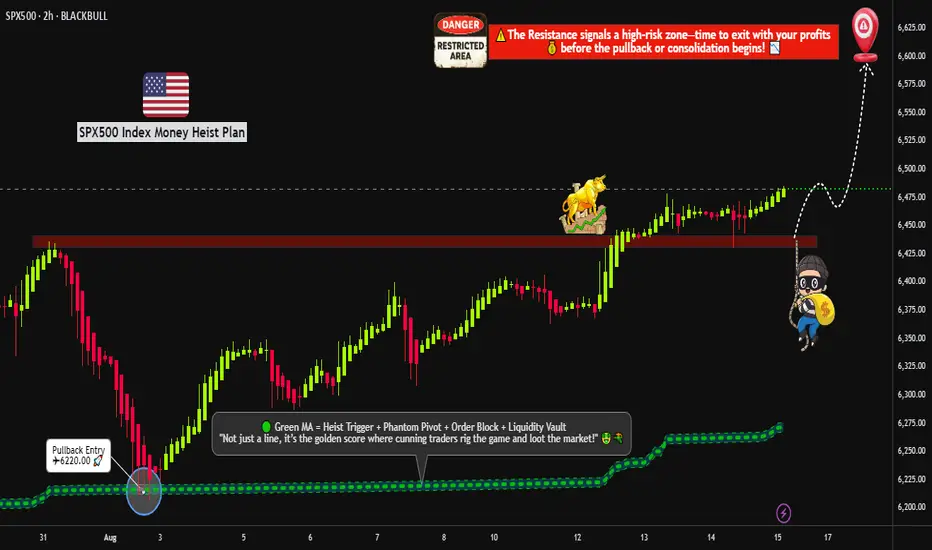
"US500 BREAKOUT – TIME TO LOAD LIMIT ORDERS FOR THE PUMP?"🔥🦹♂️ "SPX500 BANK HEIST – LAYERED BULL RAID IN PROGRESS!" 💰📈
(Thief Trader’s Multi-Limit Order Bullish Ambush – No Weak Hands Allowed)
📍 ASSET: US500 / SPX500 (S&P 500 INDEX)
🎯 HEIST PLAN: BULLISH BREAKOUT
💣 ENTRY: ANY PRICE LEVEL (Thieves use Layered Limit Orders – adapt like a pro!)
🔫 SAMPLE LAYERS: (Scale in like a boss!)
BUY LIMIT LAYER 1: 6475.00
BUY LIMIT LAYER 2: 6460.00
BUY LIMIT LAYER 3: 6440.00
(Add more layers if needed – flexibility is key!)
🛑 STOP LOSS: 6400.00 (Thief’s Emergency Exit – adjust based on your risk!)
🎯 TARGET: 6600.00 (First profit zone – trail or take gains!)
🦹♂️ THIEF TRADER’S MASTER PLAN:
"We don’t ask for permission – we take profits."
🔹 ENTRY TACTICS:
Use multiple limit orders (LAYERED STRATEGY) – like planting timed explosives at key levels.
No panic entries – thieves strike with precision, not emotion.
DCA if needed – but keep bullets for the real move.
🔹 STOP LOSS RULES:
6400 = Danger Zone – if price breaks, abort mission & regroup.
SL too tight? You’ll get stopped out by market noise. SL too wide? You’ll bleed. Find balance.
🔹 TAKE PROFIT STRATEGY:
First TP @ 6600 – secure partial profits.
Let runners ride with trailing stop – or full exit if momentum fades.
🚨 THIEF’S GOLDEN RULES:
✅ Only LONG – no revenge shorts, no greed traps.
✅ Trade in SILENCE – avoid high-impact news (CPI, NFP, Fed).
✅ Risk management = Survival – don’t blow your account on one play.
✅ BOOST & SHARE – if this plan helps, spread the word!
📢 FINAL WARNING:
"This is not financial advice – it’s a thief’s blueprint.
Plan your escape before entry. Market heists require discipline."
💬 COMMENT "ROBBING SPX" if you’re in!
🔥 LIKE & BOOST if you ride with the Thief Trader crew!
🦹♂️ THIEF TRADER OUT.
💸 STEAL SMART. GET RICH. REPEAT.
This V-Pattern on SPX500 Is Stupid CleanHey, it’s Skeptic.
In this video, I’m breaking down a clean V-pattern setup on SPX500 — right in line with what I taught in yesterday’s educational post.
We’re starting from the Daily time frame and walking through the logic behind my long trigger, why the previous fakeout was actually useful, and how to set your stop-loss depending on your trading style (H4 vs 15min).
This isn’t just chart talk — it’s about reading the story behind the candles.
If it helped you see things clearer, give it a boost and drop your thoughts below.
Let’s keep learning — one trap at a time.
Until next time, peace out.
📌 Disclaimer: This video is for educational purposes only and does not constitute financial advice. Always do your own research and manage your risk.

Rob the Rally SPX500: Enter Before Resistance Catches You🦹♂️💎 “SPX500 Vault Breach – Layered Robbery in Progress!” 💼📈
(Thief Trader's Multi-Limit Entry Bullish Blueprint – No Mercy, Just Money)
📍Asset: SPX500 / US500
🎯Plan: Bullish Heist
🧠Style: Layered Limit Orders | Thief Strategy Entry | Zero Mercy Execution
📈Target: 6600.00
🛑Stop Loss: 6200.00
💣Entry: Any level — thieves adapt, not wait!
🌍 Welcome to the Global Robbery Room, Traders!
It’s your boy Thief Trader, back in the vault with another plan to crack the SPX500 like a safe on Wall Street. This one’s for the bold bulls who like to rob with precision, not permission. 🎯💰
💼 The Setup – High Stakes, High Floors
SPX500 is lining up for a classic breakout breach. This isn’t just technical — it’s tactical warfare. Market noise? Ignore it. We operate on strategy and steel nerves. 🧠🔫
🔥 Entry Protocol – Layer Up or Miss Out
🧱 Multiple limit orders across price zones — like planting C4 charges on every door.
🎯 Enter wherever price dips — don’t wait for permission from retail traders.
🎯 No fixed entry — this is Thief Layering: get in where you fit in.
🚪 Escape Plan – Stop Loss Strategy
📍 SL: 6200.00
Why? That’s where the guards start showing up. If price drops below, we vanish.
💡 Be flexible — smart robbers don’t get caught, they regroup.
💎 Target Loot – The Golden Zone
📍 Primary TP: 6600.00
Once we breach the 6500+ resistance, it's a moonwalk. Lock gains or trail with confidence.
📢 Warning for Scalpers & Swing Thieves Alike:
Only play Long-side. Don’t try to rob both ends — that’s suicide.
Big wallet? Scale heavy. Small bag? Layer light but tight.
Always use trailing stops — never trust the market with your escape bag. 🎒💸
📊 Thief Intel – Why We’re Bullish
✅ Index rotation favors large-cap strength
✅ Macro sentiment + institutional bias points UP
✅ No bearish COT signals in sight
✅ Fed tone & economic backdrop: neutral to supportive
This isn’t hopium. It’s strategy.
🚨 NEWS FLASH – Stay Stealthy!
Do NOT enter during economic bombs 💣 (NFP, CPI, Fed minutes, etc.)
Market noise kills precision. We only move in silence and with SLs trailing tight.
💬 Smash that BOOST 💖 if you’re riding with the Thief Army.
Share this plan, spread the word, and let’s rob the markets the smart way.
📢 Tag your crew, stack your layers, and let’s hit 6600 like pros.
📌Disclaimer: Not financial advice — this is a market operation plan for educational use. Trade at your own risk. Smart thieves plan exits before entries. 💼📉📈
🦹♂️ Thief Trader out.
💸 Rob smart. Rob clean. Rob global.

QQQ (+ QLD, TQQQ) , Stay heavy on positionsQQQ (+ QLD, TQQQ) , Stay heavy on positions
Despite downside volatility, the trend remains intact. I’m maintaining the same view as before—this is still a zone to stay heavy.
SPX500 Will Go UP!
HI,Traders !
#SPX500 made a retest
Of the horizontal support
Level of 6277.78 and we
Are already seeing a
Bullish rebound so we are
Locally bullish biased and
We will be expecting a
Further bullish move up !
Comment and subscribe to help us grow !

S&P500 (CASH500) SHORT - Double top H6Risk/reward = 3.7
Entry price = 6432.6
Stop loss price = 6 454.1
Take profit level 1 (50%) = 6367.7
Take profit level 2 (50%) = 6332.6
Still need confirmation from some variables before entering the trade
NDX & SPX , Stay heavy on positionsNDX & SPX , Stay heavy on positions (QLD, TQQQ)
Market sentiment is currently tilted toward betting on downside volatility, which ironically supports the case for the stock market to continue its upward trend.
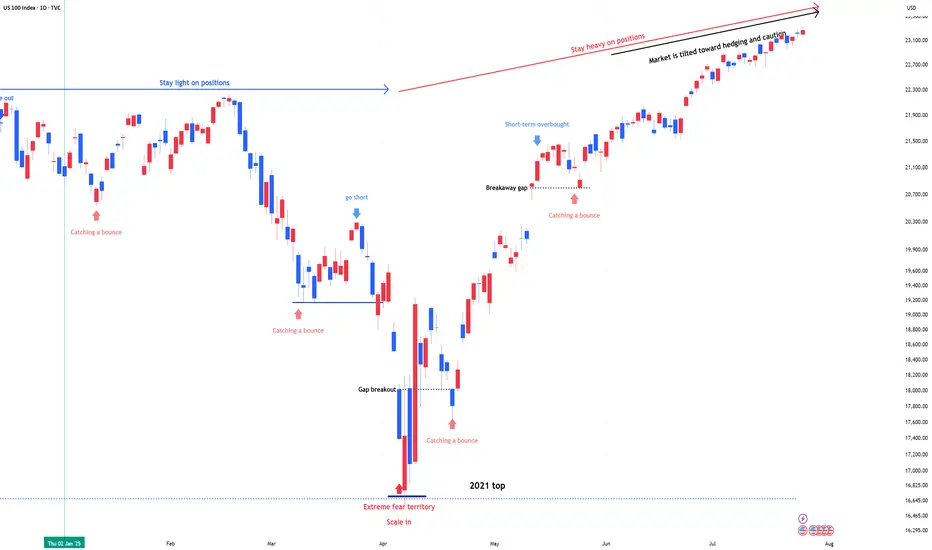
US 100 (NDQ) : Stay Heavy on Positions1) April Fear & Buy Signals
In early April, the Nasdaq 100 experienced a sharp sell-off, triggering extreme fear sentiment across the market.
At that point, scale-in buy signals appeared—classic "buy the fear" conditions.
2) Current Market State: No More Fear, but Watching
Since then, the market has stabilized.
The fear has disappeared, but we are still in a wait-and-see mode as traders assess the next move.
Momentum is holding, but participation remains cautious.
3) Stay Heavy on Positions
Despite short-term uncertainty, I’m maintaining an overweight position on the Nasdaq 100.
As long as we don’t see a major breakdown, the bias remains bullish.
SPX500 Update: Monster Trigger Ready to Launch!Welcome back, traders, it’s Skeptic from Skeptic Lab! 😎 With news of the unemployment rate rising, stock and crypto markets have been surging hard, and right now, we’ve got a killer trigger on SPX500 you don’t want to miss. Its breakout could spark the next major bullish leg. Let’s dive into the Daily and 4-hour timeframes to unpack this setup. here’s the play:
✔️ Daily Timeframe:
After a strong rally, SPX500 hit an all-time high (ATH) at 5,249.14 before entering a deep correction. Here’s what many traders miss: support/resistance levels aren’t static—they shift over time. The resistance that was at 6,146.89 has now climbed to 6,290. Breaking 6,290 signals the start of a major bullish trend after 146 days of correction. This is our primary long trigger.
📊 4-Hour Timeframe (Futures Triggers):
Long Trigger: After a solid uptrend with strong momentum, we entered a time-based correction within a box pattern. Breaking the box ceiling at 6,290 is the long trigger, aligning with the Daily breakout.
Short Trigger: Breaking the box floor would trigger a short, but this goes against the trend, so stop-loss risk is higher, and your win rate could take a hit—stay cautious.
📉 Key Insight: The 6,290 breakout is the big move to watch, fueled by market momentum from the unemployment news. Shorts are riskier due to the bullish trend, so prioritize longs with volume confirmation.
🔔 Confirmation: For longs, confirm the 6,290 break with RSI entering overbought.Risk management is critical—cap risk at 1%–2% per trade to survive the market’s swings.
🔼 I’ll update if the structure shifts! Thanks for vibing with this analysis! <3
💬 Let’s Talk!
Which SPX500 trigger are you locked on? Hit the comments, and let’s crush it together! 😊 If this update lit your fire, smash that boost—it fuels my mission! ✌️

S&P500: Target Zone DeactivatedThe S&P 500 extended its bullish trend yesterday, moving beyond our now-deactivated (formerly magenta) Target Zone. Existing positions remain intact, as the stop set 1% above the upper boundary has not been triggered. In our updated primary scenario, we anticipate continued upward movement within magenta wave (B), potentially reaching the resistance at 6675 points. Once this peak is established, we expect a corrective decline to begin in the form of wave (C), which should guide the index into the green Long Target Zone between 4988 and 4763 points. There, the larger green wave is expected to complete. A sustained breakout above the 6675-point level would shift the outlook in favor of the alternative scenario. In that case, green wave alt. would be considered complete—a trajectory we currently assign a probability of 40%.
📈 Over 190 precise analyses, clear entry points, and defined Target Zones - that's what we do.

SPX'S BULLS !6200 Will get touched easily soon !
because the much vol up there waiting to be hunted at 6100+
𓄀𝓈𝓉𝒶𝓎 𝓉𝓊𝓃ℯ𝒹 𓃓

Skeptic | SPX 500 Analysis: Long Triggers Ready to Rip!Hey, what’s good? It’s Skeptic! 😎 Last week, we scored a nice R/R on SPX 500, and now it’s looking ready for another big move, super close to our long trigger. Let’s check it out with a multi-timeframe breakdown to grab those long and short triggers!
Daily Timeframe: The Big View
The SPX was riding a strong bullish wave, then hit a deep correction. Here’s what’s up:
It’s bounced back most of that drop and is nearing its ceiling at 6128.55. 🏔️
A break and hold above 6128.55 could kick the bullish trend into high gear, per Dow Theory.
Watch the daily RSI—if it goes overbought, we might see a fast, big rally. 🚀
This is our long-term play, so let’s zoom in for the short-term action!
4-Hour Timeframe: Long & Short Triggers
On the 4-hour chart, here’s the plan for our trades:
Long Trigger: Break above 5990.67, with RSI above 66.57 to show the move’s got juice.
Stop Loss: Your choice—put it below 5955.77, or check 1H or 15-minute charts for a tighter stop under the last low. 🎯
Short Trigger: A drop below 5856.93 lets you short, but it’s against the trend, so keep it low-risk. Take profits quick, use a small stop loss, and close when you hit a good R/R. ⚠️
Shorts are tricky here, so play it safe and don’t go all-in!
RSI Trick & Your Input
Love RSI? I’ve been using it forever, and I think most guides get it wrong. They say overbought RSI means sell, but for me, it’s a go sign for longs! Want a full RSI tutorial? Tell me in the comments, and I’ll hook you up! 📢
💬 Let’s Talk!
If this got you hyped, hit that boost—it helps a ton! 😊 Got another pair or setup you want me to hit? Drop it in the comments. Thanks for chilling with me—keep trading smart! ✌️
