Brace for Impact (I hope I am wrong)This market is reminiscent of the action before the 2020 crash. Above is now and below is 2020 covid crash. The charts are self explanatory so not much for me to say.
This is not a financial advice but for entertainment only. Please do your research!
Spxshort

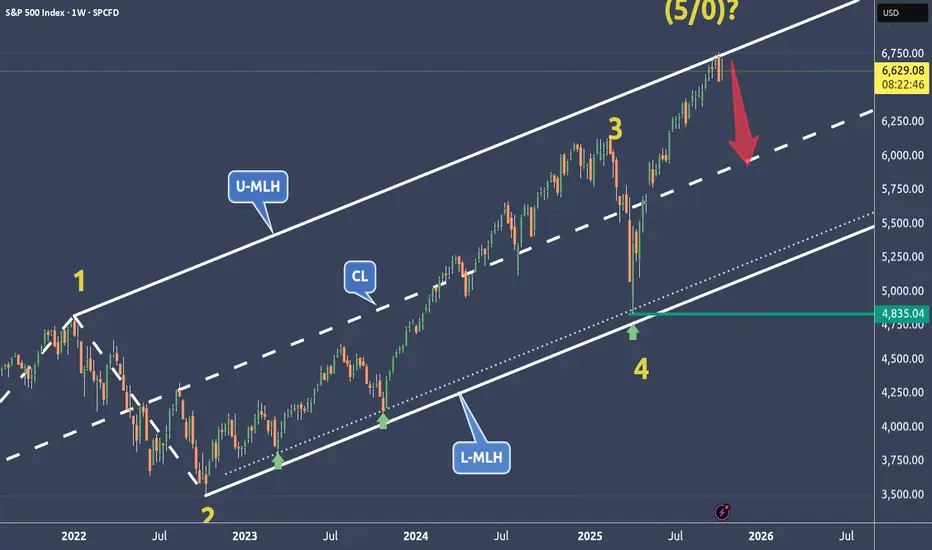
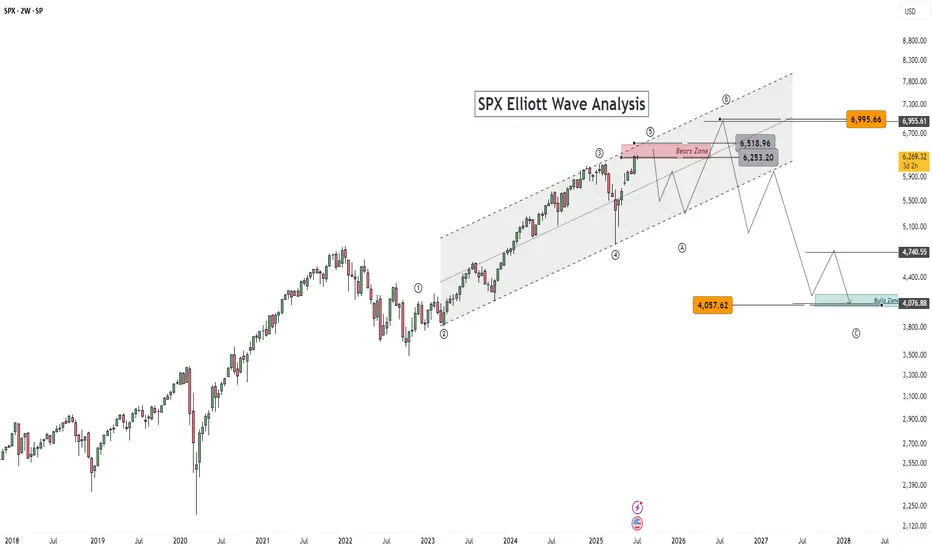
SPX is weakening at a very dangerous price level🔱 SPX is at a very dangerous price level ⚠️
...right at the Upper Median Line Parallel.
💰 If this market turns, the Centerline becomes the next target.
The 0-5 Count is also a good indication when prices start to turn at these extreme levels.
⚠️ Stay sharp — momentum is fading.
I wish you all a relaxing weekend.
SPX - That's all folks?The world has gone nuts, but markets didn't even blink.
Now the SPX has reached it's U-MLH, which means, it's at a real extreme.
This is a level where price starts to stall, then turn.
Often we see "a last attempt" to break through, and it really could happen. But then, gravity again takes it's toll and the rocket starts to turn south.
Here are the scenarios I see:
1. Immediate turn at the U-MLH. Target is the Centerline.
2. A break of the U-MLH, then back into the fork and a fall down to the Centerline.
3. Break the U-MLH, continuation to the WL1.
The most unlikely would be 3.
In my view, Party People should have left allready, but they refused to.
And that's why this time headaches will be the least problem they face.
Wating for a short signal, to load up heavy.

SPX shortSame like 2000 the concentration in AI related companies is 5 times as of russell 2000 combined companies.
Technical - Divergence in breadth and momentum
Fundamental - Expecting 3 rate cuts this year, when not delivered will start panic selling.
Chart pattern - Weekly doji

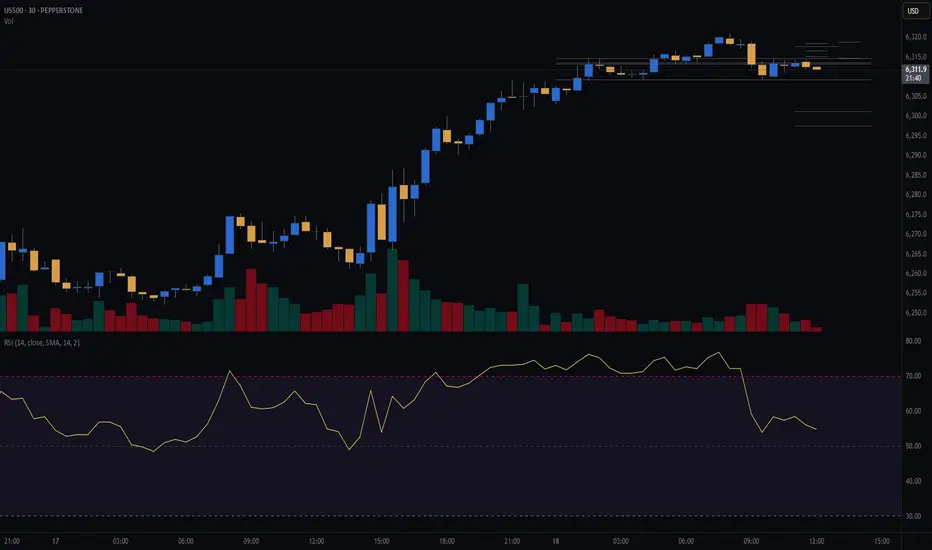
S&P 500 (CASH500) - Double Top H1Risk/reward = 2.7
Entry price = 6388.4
Stop loss price = 6399.7
Take profit level 1 (50%) = 6360.4
Take profit level 2 (50%) = 6352
Also, waiting on confirmation on some variables

S&P500 (CASH500) SHORT - head and shoulders 30minRisk/reward = 4.1
Entry price = 6378
Stop loss price = 6385.9
Take profit level 1 (50%) = 6349.2
Take profit level 2 (50%) = 6337.2
Still waiting on confirmation of a few variables at close of this 30min candle at 17.00

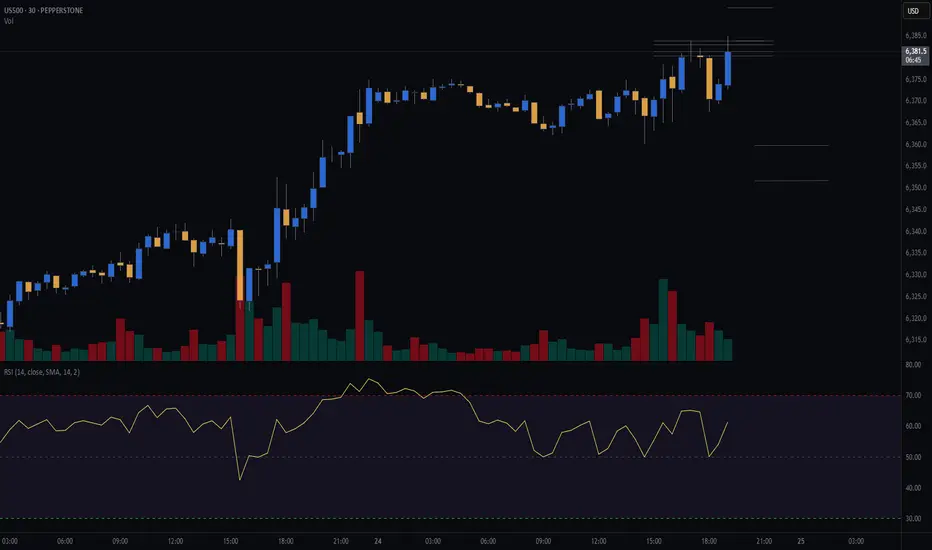
S&P (CASH500) SHORT - Double top 30minRisk/reward = 2.7
Entry price = 6384
Stop loss price = 6393.8
Take profit level 1 (50%) = 6359.8
Take profit level 2 (50%) = 6351.8
Will get confirmation of remaining variables at close of this 30min candle at 19.30.
S&P500 (CASH500) SHORT - Head and shoulders Risk/reward = 5.8
Entry price = 6321.1
Stop loss price = 6333.5
Take profit level 1 (50%) = 6257.3
Take profit level 2 (50%) = 6234.9
Still waiting for confirmation on a few variables before I enter the trade.
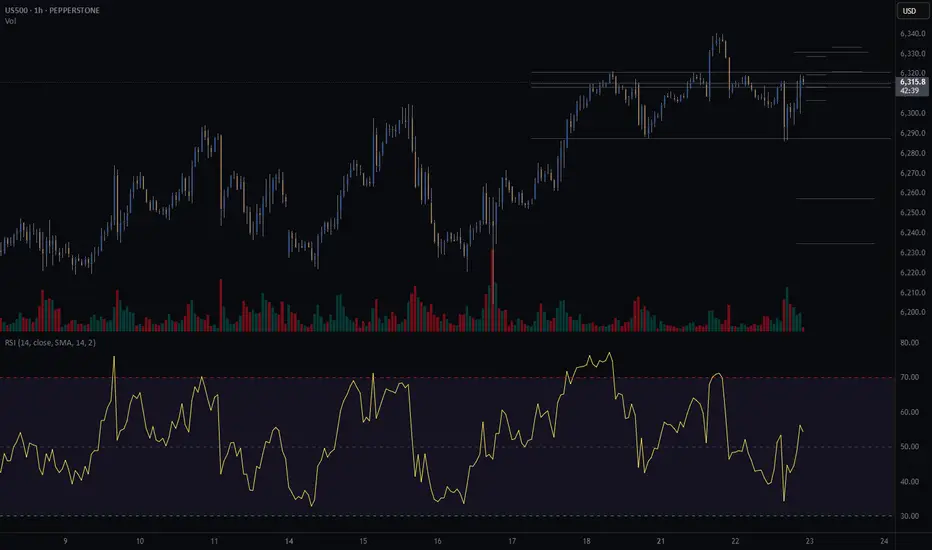
S&P500 (CASH500) (SPX500) SHORT - Head and shoulders 30minRisk/reward = 3.3
Entry price = 6314.8
Stop loss price = 6318.4
Take profit level 1 (50%) = 6301.3
Take profit level 2 (50%) = 6297.5
Waiting on validation from a few other variables.
For example, waiting for the current 30min candle to close in range.
Letssss goooooo
This is just my Elliott Wave Analysis not financial Advice. $SPThis is just my Elliott Wave Analysis not financial Advice. SP:SPX #SPX SP:SPX
S&P 500 (CASH500) Short - Head and shoulders H1Potential short on S&P 500.
Risk/reward = 3.4
Entry = 6264.9
Stop loss = 6280.3
TP level 1 = 6221.7 (50%)
TP level 2 = 6200.5 (50%)
Need current candle to close back in range at 10.00 for all variables to be met.
Volume exception applied since current candle is the open of European markets.
Little Rest For SPXI think the SPX structure is more prone to bearishness. There is a structure that will probably move quickly in one direction. I don't think a good structure has been formed for a bottom. And the rise does not seem very strong. For this reason, I expect an increase after the first fall.
Since this situation will probably reflect on crypto, my bearish contracts are still in place. But I am thinking of buying a bullish contract until the FOMC time.

SELL SPX FROM 4100 OR 4000 AND TP ON 3800 AND WAIT Patience !! Time to Sell or Wait to 4100 anyways Going back to 3800 TP and wait for second confirmation Going back to 3200 !!!
stay Profitable
do not add to losers
add to winners
do not over leverage
do not open many positions
only trade what you know
dot get sentimental with trades . close it if did not work !!!
HAVE A GOOD WEEKEND !!!
SEE YOU GUYS ON PROFIT FRIDAYS !!!

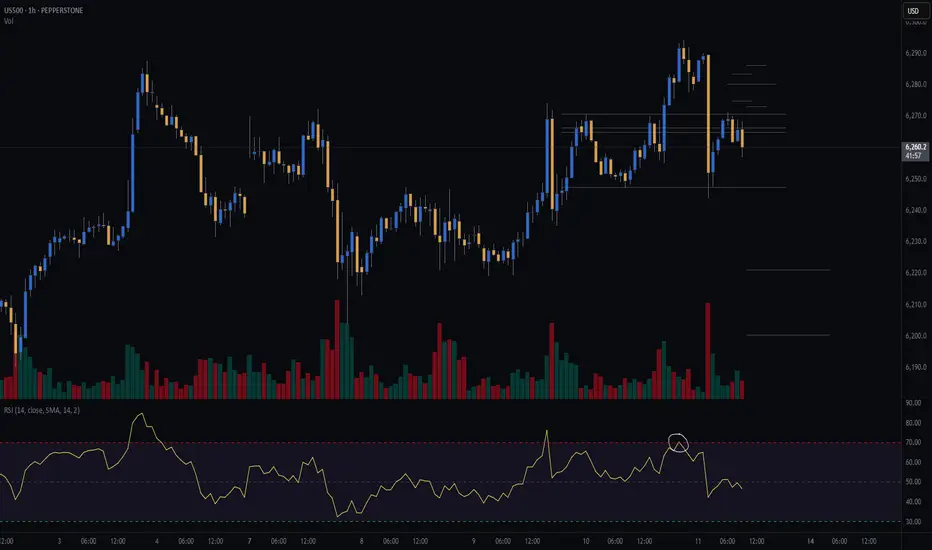
SHORT NVIDIA for a 15% Profit Target from yesterdays close...**NIVIDA** Failed to create a new High and Broke Support in yesterdays session on higher Volume circled below, see the stock falling at least another 15% from here dragging the S&P index with it, first target would be $110 with stop loss placed above all time high $152.90 ...

SPX500Pair : SPX500 Index
Description :
Completed " 12345 " Impulsive Waves
Break of Structure
RSI - Divergence
Rising Wedge as an Corrective Pattern in Short Time Frame
Resistance Level
SPX - SHORT [Capital]50 BPS cut is just ridiculous, we are facing dark times. Are you sure it is a bull market now?
Old man Warren already answered this.
Stay tuned.

SPXPair : SPX500 Index
Description :
Double Top Pattern in Long Time Frame
RSI - Divergence
Resistance Level
Rising Wedge as an Corrective Pattern in Short Time Frame
Completed " 12345 " Impulsive Waves

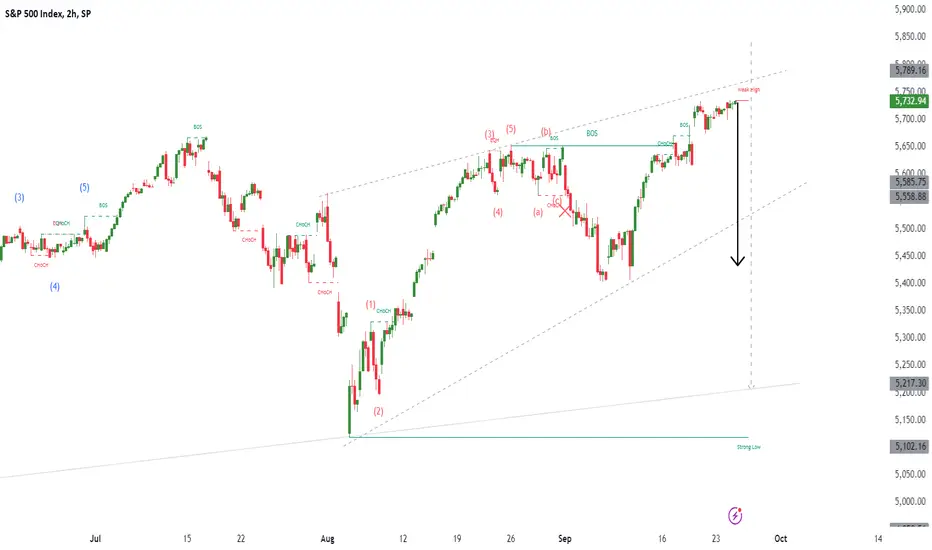
S&P 500 Index (SPX) Analysis: Key Levels and Expectations.SP:SPX My Take:
Looking at the 4-hour chart of the S&P 500 Index, it's clear that we're approaching a critical juncture. The price recently rallied up to the $5,630 - $5,655 resistance zone, which has been a significant barrier in the past. However, this level has proven to be tough for the bulls to break through, and we're now seeing signs of potential exhaustion.
Key Levels:
Resistance:
$5,620 - $5,630: This is the zone where the price is currently facing resistance. It’s a crucial area to watch because a failure to break above it could result in a pullback.
Support:
$5,480 - $5,440: If we see a rejection from the current resistance, I'm expecting the price to retrace towards this support zone. This area has acted as a strong floor in the past, and it's likely where buyers might step in again.
Trendline Support:
The upward trendline, originating from the lows earlier this year, is still intact. This trendline could provide additional support around the $5,280 level if the price breaks through the aforementioned support zone.
Expectations:
Pullback Potential:
Given the current price action, I wouldn’t be surprised to see a pullback from this resistance zone. The first area I'll be watching for potential support is the $5,480 - $5,440 zone. A break below this could bring us down to test the trendline around $5,280.
Continuation of the Uptrend:
If the bulls manage to push through the $5,620 - $5,630 resistance zone, we could see a continuation of the uptrend with a possible target towards $5,700 and beyond. But for now, I’m leaning towards the possibility of a short-term pullback before any further upside.
Food for Thoughts:
Right now, I’m closely watching how the price reacts around this resistance zone. A pullback could offer a good buying opportunity, especially if it holds above the $5,480 - $5,440 support area. On the other hand, a strong breakout above $5,630 would signal that the bulls are in control and could push the market to new highs.
Stay tuned for more updates as the situation develops! Happy Trading from Deno Trading!

US100 + S&P 500 WEEKLY MULTI TF ANALYSISHELLO TRADERS
Hope everyone is doing great
📌 A look at NAS 100 & S&P500 from HTF - MULTI TIME-FRAME ANALYSIS
NAS100 WEEKLY TF
* 2 WEEKS bullish run delivering from the +OB On the NAS100 & S&P500 from the weekly.
* We are opening bullish on the weekly signalling strong signs of cont.
* But with (PO3) possible breather on the index's to see some reversal.
* with a -FVG & -OB looking for a small reversal but momentum strength brings doubts or some skeptism.
* Because The weekly & daily TF show we are still trading in BULLISH conditions on the NAS100 & S&P500.
NAS100 & S&P500 DAILY TF
* It becomes interesting on the Daily as we see an SMT on NAS & the S&P.
* S&P 500 is mitigating the POI -FVG.
* As NAS100 Is just shy of this PD ARRAY.
* Opening bullish i am looking for some rejection to confirm this SMT.
*WITH (PO3) RULES
Either than that as we drop to the 4H
* still bullish on NAS100 Trend cont. favoured until otherwise price shows some significant bearish move.
SENTIMENTS THE SAME ON THE S&P500
* Looking for reversal patens other wise continuation of the move.
1H TF
* Sentiment remains, remain bullish unless otherwise.
* Probably be looking for short OPPORTUNITIES otherwise .
* We will see what does the market dish.
🤷♂️😉🐻📉🐮📈
HOPE YOU ENJOYED THIS OUT LOOK, SHARE YOUR PLAN BELOW,🚀 & LETS TAKE SOME WINS THIS WEEK.
SEE YOU ON THE CHARTS.
IF THIS IDEA ASSISTS IN ANY WAY OR IF YOU ENJOYED THIS ONE
SMASH THAT 🚀 & LEAVE A COMMENT.
ALWAYS APPRECIATED
____________________________________________________________________________________________________________________
* Kindly follow your entry rules on entries & stops. |* Some of The idea's may be predictive yet are not financial advice or signals. | *Trading plans can change at anytime reactive to the market. | * Many stars must align with the plan before executing the trade, kindly follow your rules & RISK MANAGEMENT.
_____________________________________________________________________________________________________________________
| * ENTRY & SL -KINDLY FOLLOW YOUR RULES | * RISK-MANAGEMENT | *PERIOD - I TAKE MY TRADES ON A INTRA DAY SESSIONS BASIS THIS IS NOT FINACIAL ADVICE TO EXCECUTE ❤
LOVELY TRADING WEEK TO YOU!

The doomsday retracementWow, what a week it has been. SPX down 3.5% and up 2.5% the day after.
My thought is this backtrack is going to be the biggest retracement for the drop, just like we saw on bitcoin. APPL seems to have DOJ issues, NVIDIA chip issues in Taiwan... all seems to be lining up for potential lower for longer. My only buy this year will be TSLA. More on that.
Goldilocks is not going to bring us back to pre-pandemic levels, rate cuts are not going to save the market. The narrative has already changed on July 17th when Trump said he didn't want to invade Taiwan, good luck buying after august.

Short Sell Analysis of SPX Based on Technical AnalysisThe S&P 500 (SPX) is presenting a short-selling opportunity based on technical resistances on chart.

S&P500Analysis of the S&P 500
Weekly and daily time frame
The S&P 500 index is near the daily and weekly supply area, and long positions have higher risk.

SPX500 IndexPair : SPX500 Index
Description :
Completed " 123 " Impulsive Waves
Demand Zone
Bullish Channel as an Corrective Pattern in Short Time Frame
Break of Structure
Fibonacci Level - 50.00% / 61.80%
