$SPY & $SPX Scenarios — Tuesday, Dec 9, 2025🔮 AMEX:SPY & SP:SPX Scenarios — Tuesday, Dec 9, 2025 🔮
🌍 Market-Moving Headlines
• Small business sentiment + job openings hit Tuesday morning — both matter for labor tightness and inflation interpretation ahead of Wednesday’s FOMC.
• Shutdown-delayed JOLTS data finally drops. Market will react to whether openings continue to cool or stay elevated.
📊 Key Data & Events (ET)
6 00 AM
• NFIB Small Business Optimism (Nov): 98.2
10 00 AM
• Job Openings, JOLTS (Oct, delayed): 7.2 million
⚠️ Disclaimer: For informational use only — not financial advice.
📌 #SPY #SPX #trading #macro #JOLTS #NFIB #markets #investing
SPDR S&P 500 ETF (SPY)

ES (SPX, SPY) Analysis, Key-Zones, Setups for Tue (Dec 9th)ES Market Overview (Daily/4H/1H)
The daily trend in the ES market remains bullish, with prices consistently above the most recent higher low while approaching a significant multi-month supply zone characterized by the 6,980-7,020 range. Although momentum has moderated, it has not completely reversed, suggesting that buyers continue to support dips, while larger market participants exercise caution around the 7,000 mark.
On the 4-hour chart, we have identified a new swing high near 6,900, followed by a notable pullback that touched the 6,820-6,840 area and subsequently rebounded. This development maintains the sequence of higher lows; however, sellers are becoming increasingly active with each attempt to rally towards the 6,880-6,900 range.
Examining the shorter-term 1-hour and 30-minute charts reveals that Monday experienced a lower high compared to last week's peak, leading to a decline towards the 6,820s before regaining ground in the 6,860s. Currently, the ES is positioned midway within the support band and beneath the intraday highs around 6,875-6,895, indicating a balanced short-term outlook: buyers are engaged below the 6,850 level, while selling pressure emerges near 6,890.
Macro Backdrop for Tomorrow
As we approach the December FOMC meeting, which kicks off tomorrow with the decision and subsequent press conference from Fed Chair Jerome Powell expected on Wednesday, market positioning is likely to remain cautious, especially near the upper range.
Key U.S. data releases scheduled for tomorrow include the NFIB Small Business Optimism Index at 6:00 ET for November and the postponed JOLTS job openings report at 10:00 ET for October. These reports provide insights into hiring trends and business sentiment following the autumn slowdown and recent government shutdown. In particular, the 10:00 ET release could trigger increased volatility. Furthermore, the global tone appears somewhat apprehensive, with Asian markets showing signs of weakness ahead of the Fed's decision.
OVERNIGHT SESSION FORECAST FOR NY MARKETS
In the base case scenario, we anticipate that the E-mini S&P 500 (ES) will navigate between support level S1, situated between 6,840 and 6,850, and the band of 6,875 to 6,895 as traders position themselves ahead of the JOLTS report and the commencement of the Federal Reserve meeting. A retreat to S1 that holds above the approximate level of 6,835 is considered constructive, potentially setting the stage for a recovery into the upper range of Monday’s session, specifically around 6,880 to 6,895, as we transition into London trading and early New York.
On the upside, should buyers successfully propel and maintain prices above 6,900 during the New York morning session, the next significant target would be resistance level R2, ranging from 6,920 to 6,945. This area is likely to attract selling activities as market participants position themselves ahead of the Fed's Wednesday decision, making sustained trading above R2 before the announcement less probable.
Conversely, if S1 does not hold and we witness hourly closes below approximately 6,835, this could indicate a shift toward a more bearish outlook, paving the way for a decline towards support level S2, which lies between 6,780 and 6,805—aligning with the 4-hour higher low region. Such a breakdown would frame the next trading day as a corrective phase within the broader uptrend.
Overall, the bias heading into tomorrow leans mildly bullish yet appears to be capped. We expect a two-sided trading range, with initial dips towards S1 likely attracting buying interest, while pronounced selling pressure is anticipated around the 6,890-6,905 region and more so at 6,920-6,945 as traders await further guidance from the Federal Reserve.
A++ Setup 1 - Short from R1
Entry: 6,892 - 6,900 short
SL: 6,912
TP1: 6,850
TP2: 6,815 - 6,820
TP3: 6,790 - 6,800
A++ Setup 2 - Long from S1
Entry: 6,842 - 6,850 long
SL: 6,828
TP1: 6,882 - 6,890
TP2: 6,905
TP3: 6,920 - 6,930
Good Luck !!!
Analysis of USA Rare Earth $USAR Investment PotentialOverview of Government Investment in Strategic Minerals
USA Rare Earth ( NASDAQ:USAR ) has emerged as a potential candidate for government investment, following in the footsteps of other strategically significant companies. For instance, the Department of Defense (DoD) acquired a 15% stake in MP Materials for $400 million in July 2025, becoming the company's largest shareholder. Additionally, the administration has taken equity positions in Lithium Americas and Trilogy Metals. These actions are part of a broader initiative aimed at securing domestic supply chains for critical minerals.
Current Status and Prospects of USAR
At present, USA Rare Earth is considered a speculative investment due to its lack of profitability. Nevertheless, the company's future prospects appear favorable as it continues to develop rare earth mines and processing facilities. The strategic importance of these resources adds to the potential upside of the company.
Technical Analysis and Trading Strategy
A positive chart pattern has been identified for USAR, characterized by a rounded bottom, a recent pocket pivot, and a flat base formation. As of today, the stock is retracing toward its 21 Day Exponential Moving Average (EMA), indicated in blue on the chart. Ideally, further consolidation around this level would allow the stock to form a clear higher low. Should NASDAQ:USAR achieve this and resume its upward trend, initiating a starter position is planned. If the stock subsequently breaks above the established resistance area, the intention is to build out the position further.
Risk Considerations and Recommendations
Readers are strongly encouraged to conduct their own analysis and to adhere to their individual trading strategies. It is important to recognize that all investments carry inherent risk. Careful and informed decision-making is essential when allocating capital in financial markets.

GOLD vs SP500 Bullish!Gold is outperforming the S&P 500 by 38%+
It is currently in the process of what seems to be a nice and bullish old-fashioned cup and handle.
More data is needed, but keep an eye on it.
Ask yourself, why is so much money pouring into gold over the SP500??
Let's get to 6,000 followers. ))

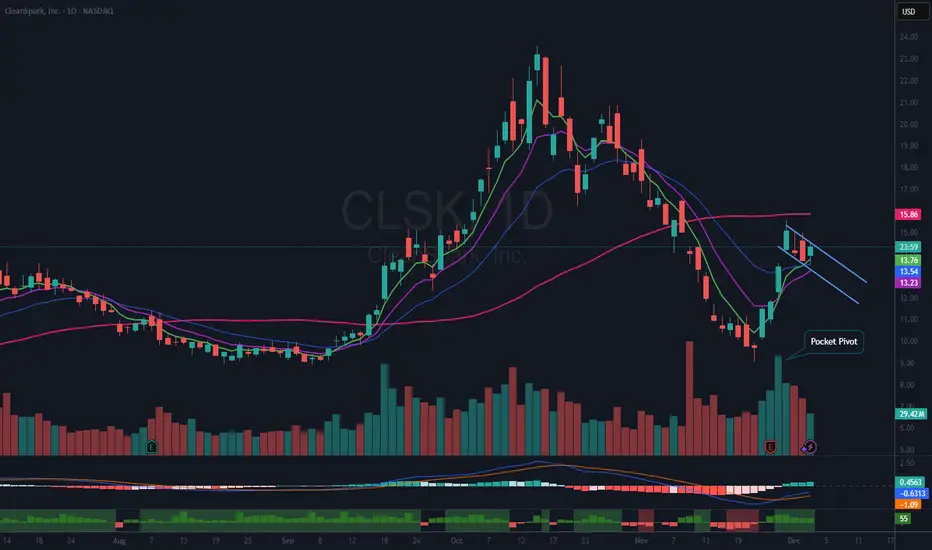
CleanSpark $CLSK Bull Flag Pattern and Earnings AnalysisOverview of Recent Earnings
On Tuesday, November 25, 2025, at 4:02 PM ET, CleanSpark, Inc. (CLSK), a Nevada-based energy technology and clean Bitcoin mining company, reported its financial results for the fiscal fourth quarter ended September 2025. The company posted a loss of $0.01 per share on revenue of $223.65 million. This result fell short of the consensus earnings estimate of $0.04 per share on revenue of $238.76 million, missing consensus by 125.00%. Despite the earnings miss, revenue demonstrated significant year-over-year growth, increasing by 150.52%.
Market Reaction and Technical Analysis
Following the earnings report, investors responded positively to CleanSpark’s revenue growth, as evidenced by a stock price increase of over 30%. The price movement on the chart indicates that market participants appreciated the strong top-line performance, even though the company missed earnings expectations.
Currently, the chart displays an orderly pullback on decreasing volume, forming a classic bull flag pattern. This technical setup suggests a period of consolidation after the recent sharp upward move, with the potential for another breakout should positive momentum continue. Notably, the stock has touched and bounced off the 21-day Exponential Moving Average (EMA), which is represented by the blue line on the chart.
Trading Strategy and Risk Management
An alert has been set on the upper downtrend line of the bull flag formation. If this alert is triggered, it will serve as a signal to initiate a position in the stock. To manage risk, a stop will be placed just below the most recent low, which provides an attractive risk-reward ratio for the trade.
In summary, while CleanSpark missed its earnings estimate, the substantial revenue growth and positive market reaction, combined with a constructive chart pattern, present a favorable technical and fundamental outlook for the stock.
Risk Disclaimer
Readers are strongly encouraged to conduct their own analysis and adhere to their personal trading strategies. It is crucial to understand that all investments carry inherent risks. Making informed decisions is essential when allocating capital within the financial markets.
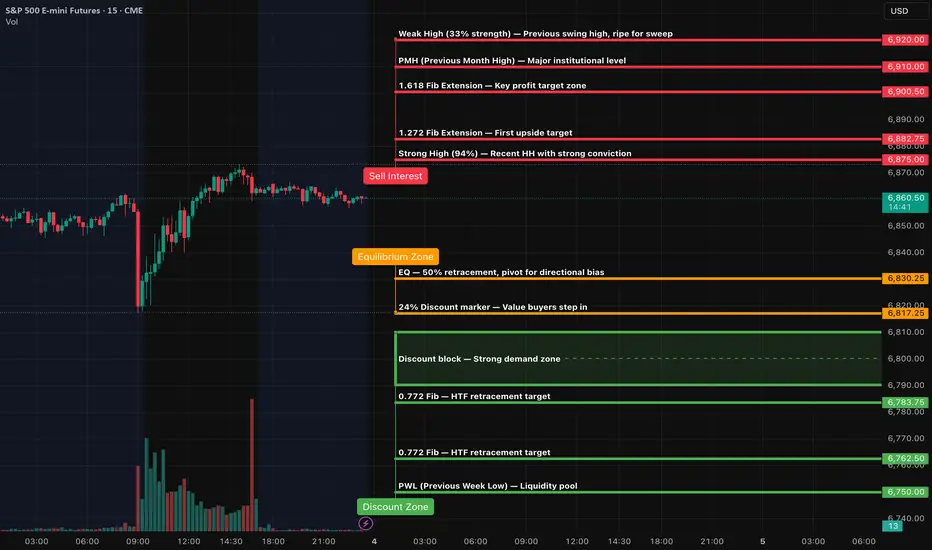
ES (SPX, SPY) Week-Ahead Analyses (Dec 8th - 12th)Market Analysis: Multi-Timeframe Structure Indicates Continued Bullish Sentiment, Yet Signs of Fatigue Emerge
Weekly Trend Assessment
The weekly trend remains robustly bullish, characterized by a series of higher highs and higher lows since the spring lows. The latest significant weekly higher low was established in the low 6,200s, with current price action oscillating just below the resistance zone around 6,900. This positioning indicates that price is trading at a premium against the last substantial weekly swing range (approximately 6,250 to 6,900), with a key equilibrium point at around 6,575. With prices situated nearly 300 points above this mid-range, new long positions in this area are likely paying a premium, contingent upon sustained price movement rather than favorable entry points.
The current weekly candle displays a small body resting at the top of the preceding expansion bar, a classic sign of balance at the top of an ongoing trend rather than a definitive reversal.
Daily Trend and Range Overview
The daily structure also points towards bullish momentum: since the November lows near the low 6,300s, prices have generated higher highs and higher lows, currently thriving within the strong resistance band of 6,850 to 6,900. Recent trading sessions have produced a tight range below this recent peak, with support forming around 6,840-6,860 and resistance capping at 6,890-6,905. Until there is a decisive move above the 6,905-6,920 range or a daily close beneath 6,840, the market remains in a sideways consolidation pattern at the pinnacle of this uptrend.
4-Hour Structure Insight
The 4-hour chart reflects a sharp upward leg originating from approximately 6,780, reaching into the 6,900 territory, followed by overlapping candles and shallow retracements. This price action suggests that the preceding move was impulsive, and present conditions may represent a pause rather than a full reversal. The latest significant 4-hour swing demonstrates a higher high around 6,900-6,905 followed by a higher low at 6,870, with current prices positioned in the upper half of this micro-range.
Momentum within the 4-hour timeframe appears to be waning: candles are producing smaller bodies, with wicks protruding in both directions, coupled with diminished trading volume. This behavior often precedes either a marginal high or a retreat towards the earlier price base.
1-Hour Contextual Analysis
On the 1-hour chart, the market is currently trapped between a short-term support floor around 6,870-6,875 and a resistance cap in the 6,895-6,905 range. Overnight trading has developed within this mid-range, setting the stage for today's session. As traders enter the New York trading hours, a critical factor will be whether the market can decisively break and maintain levels above 6,905, or if that resistance will invite profit-taking and selling pressure.
Momentum Indicators: Weekly and Daily Perspectives
The weekly oscillator has retraced from prior overbought extremes and is now gradually ascending from a neutral zone - a constructive medium-term indicator. Although the trend remains upward, the substantial momentum surge may have already occurred. The daily oscillator presents an elevated stance, yet it is not at a new extreme and is beginning to form slightly lower highs while prices concurrently touch or slightly exceed previous highs. This presents a mild bearish divergence: the overarching trend is up, but each successive high lacks the same vigor as its predecessors.
In summary, while the structural analysis continues to favor a bullish outlook, momentum indicators signal a potential slowdown in the pace of price increases. The current scenario depicts an uptrend approaching resistance, exhibiting signs of fatigue but not yet forming a definitive topping pattern. Traders should remain vigilant in this environment as they navigate the interplay of momentum and price action going forward.
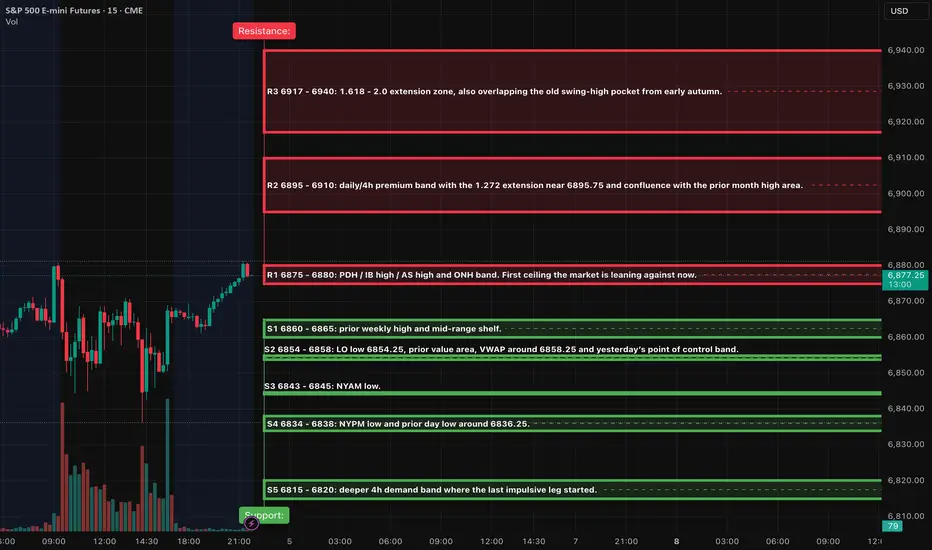
Key levels and zones
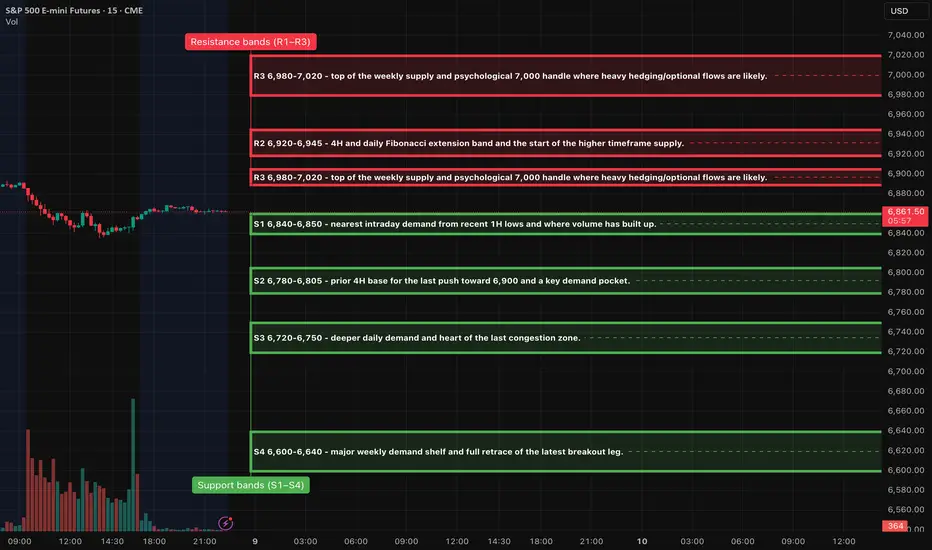
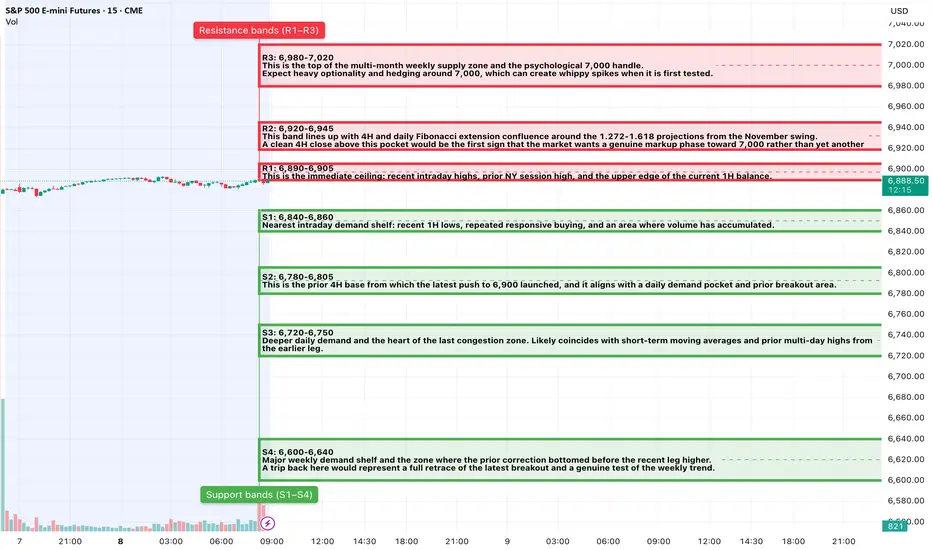
Resistance bands (R1–R3)
R1: 6,890-6,905
This is the immediate ceiling: recent intraday highs, prior NY session high, and the upper edge of the current 1H balance.
It also aligns with short-term extension targets from the last 4H leg. A lot of short-term stops will sit just above it.
Expect the first NY push into this pocket to attract profit-taking from longs and counter-trend scouts.
R2: 6,920-6,945
This band lines up with 4H and daily Fibonacci extension confluence around the 1.272-1.618 projections from the November swing.
It sits inside the broader weekly supply shelf and represents the first real “air pocket” above the current range.
A clean 4H close above this pocket would be the first sign that the market wants a genuine markup phase toward 7,000 rather than yet another rejection.
R3: 6,980-7,020
This is the top of the multi-month weekly supply zone and the psychological 7,000 handle.
It is labeled as a weak high area on higher timeframes: structurally important because a decisive break and hold above here would confirm a fresh weekly expansion leg, while another rejection would likely start a meaningful corrective phase.
Expect heavy optionality and hedging around 7,000, which can create whippy spikes when it is first tested.
Support bands (S1–S4)
S1: 6,840-6,860
Nearest intraday demand shelf: recent 1H lows, repeated responsive buying, and an area where volume has accumulated.
As long as NY closes keep holding above this band, the current congestion can be framed as a high-level pause, not a breakdown.
First test in NY AM is a candidate for a tactical bounce; repeated tests with weaker response increase the odds of a deeper flush.
S2: 6,780-6,805
This is the prior 4H base from which the latest push to 6,900 launched, and it aligns with a daily demand pocket and prior breakout area.
A 4H close back into and through this band would mean the most recent breakout has fully retraced. That is where swing buyers from the last leg begin to feel pain.
This is also near the top of a thicker volume shelf; structurally a very attractive support for A++ bounces if reached with a fast, emotional flush.
S3: 6,720-6,750
Deeper daily demand and the heart of the last congestion zone. Likely coincides with short-term moving averages and prior multi-day highs from the earlier leg.
If we are in a simple pullback within an ongoing weekly uptrend, this band should hold on a closing basis.
A stop-run into S3 that quickly reclaims S2 is classic “flush and spring” behavior.
S4: 6,600-6,640
Major weekly demand shelf and the zone where the prior correction bottomed before the recent leg higher.
A trip back here would represent a full retrace of the latest breakout and a genuine test of the weekly trend.
If this zone were to fail on a weekly close, you would be talking about trend damage rather than a routine shakeout.
One Decisive Pivot
The S&P futures are currently operating at a crucial make-or-break level between 6,780 and 6,800. This threshold acts as the dividing line between what could be characterized as an “orderly pullback within an ongoing trend” versus a “failed breakout.” Should the S&P maintain its position above 6,780 on both a 4-hour and daily closing basis, it will likely signal a high-level consolidation phase, potentially setting up for a breakout. Conversely, if the index witnesses a sustained decline below this pivot, particularly in conjunction with a rise in volatility, we could anticipate a deeper correction targeting key support levels S3 and possibly S4 in the coming weeks.
Volatility Environment
The VIX is sitting comfortably in the mid-teens, reflecting relative tranquility in the options market despite the index hovering just below all-time highs. The upward-sloping term structure of implied volatility indicates that the market anticipates modest near-term fluctuations while demanding a premium for longer-dated protection-classic contango behavior. This suggests an expectation for calm leading up to the upcoming central bank decision, with an inherent potential for volatility spikes should the Fed’s declaration differ from expectations.
Options Positioning and Skew Dynamics
A look at the equity-only put/call ratio, which currently stands at approximately 0.43 - significantly below the 20-day average of 0.60 - signals a robust call market and a degree of optimism prevailing within single-stock and broad equity options. Meanwhile, an uptick in demand for index puts persists, as evidenced by the index put/call ratio at around 1.07 and the SPX-specific ratio at approximately 1.13. This trend implies institutional preferences for hedging mechanisms even as spot indices flirt with historic highs. Furthermore, the SKEW index, around 149, remains considerably elevated compared to its long-term average, indicating that out-of-the-money downside insurance is costly relative to at-the-money options. This reflects ongoing concerns regarding tail risks in the current subdued market environment.
Overall, this paints a picture of a classic "call-happy, hedged-underneath" setup: the speculative fervor on the surface is balanced by institutional strategies focusing on downside protection. It's reasonable to infer that dealers are modestly long gamma at these index levels, which typically supports mean reversion around significant strike prices, such as 6,900, leading up to the Fed meeting - though these assumptions should be approached with caution.
Market Breadth and Internals
As we assess the broader market landscape, major indices concluded the previous week with modest gains, remaining within 1% of their all-time highs. Day-to-day breadth trends have exhibited a mixed demeanor; recent indicators show approximately 45% of stocks advancing while around 52% declined in one of the sessions, which leans towards a mildly negative sentiment, aligning with typical “fade at the highs” behavior rather than outright selling pressure.
Technology and growth sectors have continued to lead the market, while defensive plays, particularly utilities, have trailed - a development consistent with a risk-on market sentiment as opposed to classic late-cycle caution. Collectively, these internal metrics do not appear to confirm a market top but rather suggest a consolidation phase characterized by rotation at elevated price levels.
Credit and Funding Landscape
High-yield credit remains resilient, with HYG trading around 80.7 and JNK near 97.3, both positioned well within a narrow range proximal to their recent highs without signs of sudden outflows. The stability observed in high-yield ETFs indicates that credit spreads remain largely intact, contributing to overall orderly funding conditions without evident stress signals to undermine equity strength.
Sentiment and Crowd Positioning Analysis
The latest AAII survey reveals about 44.3% of respondents are bullish, 24.9% neutral, and 30.8% bearish, positioning the bull-bear spread at approximately +13.5 percentage points - well above the long-term average and indicative of rising optimism. When coupled with the low equity put/call ratio, this sentiment reflects a cautiously optimistic outlook that could risk complacency; however, it does not yet indicate a level of extreme sentiment typically preceding major market tops.
In summary, sentiment appears to support continued upward movement but carries an enhanced risk that any adverse macroeconomic developments could prompt a swift and pronounced market correction as overly crowded long positions seek exits.
Cross-Asset and Global Risk Tone
On the global stage, equity indices remain largely firm. The S&P 500 is experiencing a year-to-date increase of approximately 17% and is just shy of its record high. European indices like the DAX are also nearing their peaks, while Asian markets reflect mixed signals without evident distress. Additionally, the cryptocurrency market is displaying a risk-on attitude, with Bitcoin trading above $91,000 and Ethereum above $3,000 - both of which have risen recently ahead of the Fed meeting.
As we move forward, the interplay of these factors will be pivotal in shaping market expectations and movements in the wake of key policy announcements.
Macro and Data Calendar Context
This week, all eyes are on the Federal Reserve's meeting and rate decision scheduled for Wednesday. Futures markets currently reflect a strong expectation for a 25-basis-point cut from the existing range of 3.75-4.0 percent. However, internal divisions within the Fed indicate that this meeting could be one of the most contentious in recent memory. Market participants will also closely scrutinize updated projections and the tone during the press conference for insights into the anticipated rate trajectory through 2026.
On the data front, traders can expect delayed JOLTS figures and employment cost data. However, no significant inflation metrics are on the immediate agenda to influence the Fed's decision.
As for the week’s trading landscape, the narrative is quite clear: today and tomorrow are likely to involve positioning and range-trading at elevated levels, with Wednesday’s rate decision and subsequent press conference acting as critical catalysts that could break the current trading range of 6,850-6,900.
Scenario Mapping and Odds
Forecasting the market trajectory involves qualitative assessments rather than precise calculations, but the analysis reflects the prevailing structure, sentiment, and macroeconomic environment.
Primary Path (Approximately 55% Probability)
We expect a period of consolidation with a slight positive bias. The E-mini S&P 500 (ES) is anticipated to fluctuate between support (S1 at 6,840-6,860) and resistance (R2 at 6,920-6,945) leading up to the Fed meeting. We may witness multiple attempts to test the 6,890-6,905 ceiling, leading to sharp but controlled pullbacks. Market breadth appears mixed but stable, with the VIX remaining in the mid-teens and high-yield credit markets demonstrating resilience. A decisive directional breakout is likely to occur post-Fed - either a bullish push through R2 toward the 7,000 mark if the rate cut and guidance are deemed supportive or a bearish reaction if the Fed's tone leans hawkish.
Bear-Extension Path (Around 25% Probability)
This scenario suggests a failed breakout resulting in a deeper correction. Should the ES spike toward R1/R2 but decisively falter, a breakdown below S1 with a four-hour close under approximately 6,840 - either before or immediately after a hawkish Fed surprise - could trigger accelerated declines toward S2 (6,780-6,805) and potentially S3 (6,720-6,750). In this case, we would likely see the VIX rising above 20, deteriorating market breadth, and softness in high-yield indices (HYG/JNK). If these indicators remain stable, the likelihood of this path diminishes.
Confirmation Triggers: A four-hour close beneath 6,840, coupled with a spike in volatility and weakening credit conditions, will signal that this bearish scenario is gaining traction.
Bull-Surprise Path (Approximately 20% Probability)
In this scenario, a clean breakout could initiate a year-end rally. The ES would break through R1, consolidate briefly, and then surge past R2, ideally closing above 6,945, thereby converting the 6,900 level into support. A dovish Fed decision paired with guidance perceived as growth-supportive - without reigniting inflation concerns - could easily lift prices into the R3 band (6,980-7,020) this week. Under this outcome, we would expect lowered VIX levels, a broadening of sector leadership beyond just mega-cap technology stocks, and a potential euphoric sentiment among investors.
Confirmation Triggers: Sustained trading above 6,945, with S1 holding as support on any pullbacks, would confirm the validity of this bullish scenario.
Order-Flow and Micro-Structure Analysis: Key Levels for Today's New York Session
In today's intraday trading environment, particularly within the New York session, attention will be focused on critical resistance and support levels.
Resistance Levels (R1 and R2):
- At R1 (6,895-6,905), traders should monitor for late buyers entering the market. If this occurs without a corresponding increase in volume and 1m-5m candles start to show upper wicks, it may indicate potential weakness. A shift in Delta from strongly positive to neutral or negative during this price action would support a bearish outlook.
- Should the price advance to R2 (6,920-6,945), the essential factor will be whether it can sustain above this level on 15-minute closes. A clean acceptance accompanied by tight consolidations in the shorter time frames would suggest a bullish continuation. Conversely, if spikes and sharp rejections are noted, this could favor a fade in prices.
Support Levels (S1 and S2):
- At S1 and particularly at S2, the long thesis strengthens if there is a notable expansion in volume during a flush, followed by a marked slowdown and stable buying activity. A pattern of 1m-5m candles producing higher lows, while still operating within the support zone, would further bolster the long case.
In instances where the micro-structure fails to align with the broader market narrative at these pivotal levels, the prudent approach may be to refrain from trading until the market clarifies its direction in relation to impending Fed announcements.
Market Forecast for Today's NY Session:
- For today, the baseline expectation is for the ES to continue fluctuating within the 6,840-6,905 range, with an early attempt to breach overnight highs into the 6,895-6,905 zone. If this upward movement struggles, particularly with weak market breadth and the Nasdaq lagging, a pullback towards the 6,865-6,875 mid-range is anticipated, potentially extending down to S1 at 6,840-6,860, where we can expect responsive buyers to re-enter.
- A decisive break and sustained hold above the 6,905-6,920 level ahead of Fed statements would signal market anticipation of a dovish outcome, possibly triggering an earlier test of R2. On the downside, a breach below 6,840 on a 4-hour closing basis would suggest a shift toward a bearish continuation leading into the event.
Traders should focus on two A++ setups as primary strategies: consider fading any exhausted rallies approaching 6,900 and prepare to enter long positions on a genuine flush down to the 6,780-6,805 support area if the opportunity arises.
A++ Setup 1 - Short from upper shelf (R1)
Enter: Short ES in the 6,895-6,905 zone once you see a 5-15m rejection candle and a 1m-5m lower high back inside 6,900.
SL: 6,918-6,922, above the rejection wick and inside R2.
TP1: 6,860, at the top of the S1 shelf (take about 70% off and move stop to breakeven or slightly in the green).
TP2: 6,810-6,800, targeting the top of S2 if momentum extends.
Notes: Treat this as a high-probability fade of stretched prices into event risk; if you get a clean 4H close above ~6,920, the idea is invalid and you stand aside.
A++ Setup 2 - Long from 4H base (S2)
Enter: Long ES in the 6,780-6,805 zone after a fast flush into S2, a 15m candle that sweeps below and closes back above ~6,790, and then a 5m higher low above that reclaim.
SL: 6,770-6,775, below the reaction low and under the S2 pocket.
TP1: 6,860-6,870, back toward the S1/mid-range band (scale about 70% and move stop to breakeven or slightly positive).
TP2: 6,920-6,945, targeting the R2 band if the bounce evolves into a full reclaim of the upper range.
Notes: This is your preferred “flush-and-spring” play; a 4H close below ~6,780 invalidates the bounce thesis from S2 and shifts focus to lower bands.
$SPY & $SPX Scenarios — Week of Dec 8 to Dec 12, 2025🔮 AMEX:SPY & SP:SPX Scenarios — Week of Dec 8 to Dec 12, 2025 🔮
🌍 Market-Moving Headlines
🏦 FOMC week: Wednesday’s rate decision and Powell press conference are the dominant catalysts. Markets will focus on wording around inflation progress, growth risks, and timing of future cuts.
🧾 Shutdown-delayed data continues: Job openings, Employment Cost Index, and several September reports are still rolling in late, creating uneven visibility for traders.
📉 Labor and inflation signals midweek: ECI, jobless claims, and trade balance provide additional color on wage pressures and global demand.
🧺 Quiet Monday — then the calendar heats up fast.
📊 Key Data & Events (ET)
MONDAY, DEC 8
• None scheduled
TUESDAY, DEC 9
⏰ 6 00 AM
• NFIB Small Business Optimism (Nov): 98.3
⏰ 10 00 AM
• Job Openings (Oct, delayed): 7.2 million
Note: From the shutdown backlog
WEDNESDAY, DEC 10 — FOMC DAY
⏰ 8 30 AM
• Employment Cost Index, ECI (Q3, delayed): 0.9 percent
⏰ 2 00 PM
• FOMC Interest Rate Decision
• Monthly United States Federal Budget (Nov): –139.6 billion
⏰ 2 30 PM
• Fed Chair Powell Press Conference
THURSDAY, DEC 11
⏰ 8 30 AM
• Initial Jobless Claims (Dec 6): 220,000
• United States Trade Deficit (Sept): –61.6 billion
FRIDAY, DEC 12
⏰ 10 00 AM
• Wholesale Inventories (Sept): Not released for this cycle
Note: September report was canceled; August was the last available
⚠️ Disclaimer: For educational and informational use only — not financial advice.
📌 #SPY #SPX #trading #macro #FOMC #Powell #inflation #labor #economy #markets #investing

MOVE INDEX COMPLACENCE SELL SIGNAL The chart posted is the Bond market VIX . As you can see the green arrows and now we have a double green This is now setup for an I.T. SELL IN BONDS and Rates to rise and sharp and fast into spring of 2026 . I am starting Re short the Spy Smh and soon Qqq all within 48 hours or less . on 12/11 I will be 100 % short I have started to short smh and spy today . Best of trades WAVETIMER !

SPY: Bearish Forecast & Bearish Scenario
Looking at the chart of SPY right now we are seeing some interesting price action on the lower timeframes. Thus a local move down seems to be quite likely.
Disclosure: I am part of Trade Nation's Influencer program and receive a monthly fee for using their TradingView charts in my analysis.
❤️ Please, support our work with like & comment! ❤️

Weekly US Market Outlook – SPY, QQQ, DXY, VIX (30 NOV)Weekly US Market Outlook – SPY, QQQ, DXY, VIX
Bullet points:
Market sentiment turned bullish again as the probability of a December Fed rate cut climbed to 87%.
Fear & Greed Index recovered from extreme fear (9) to 24.
Options sentiment still signals extreme fear → room for upside continuation.
DXY remains bearish until 99, supporting risk assets.
VIX continues to decline toward 15.70–14.20, but these levels historically precede sharp corrections.
Heavy data week ahead (ADP, Jobless Claims, PCE) → major volatility drivers.
SPY targets 690 → 700 zone; QQQ targets 625 → 637 → 647.5.
Market Sentiment
Market sentiment has shifted decisively toward a bullish stance after the probability of a December rate cut surged back to 86%. Markets are now pricing in one more cut before 2026, creating a supportive macro backdrop for equities. At the same time, the Fear & Greed Index has rebounded from extreme fear levels of 9 to 24, indicating a slow but clear improvement in risk appetite.
Stronger than expected earnings from NVDA continue to reinforce the narrative that the AI cycle is intact and far from bubble conditions. Additionally, easing geopolitical tensions specifically the US–China trade agreement have reduced risk premia across global markets. Taken together, these developments support a short to mid term bullish environment and increase the likelihood of a Santa Rally.
Options Sentiment
Despite improving market sentiment, options markets remain deeply positioned in the extreme fear zone. This divergence between spot indices and options positioning typically suggests that market participants remain hedged or underexposed, allowing equities to extend higher as positioning normalizes. In other words, options sentiment indicates there is still significant room for markets to explore higher price levels.
DXY – US Dollar Index
Monitoring the DXY is essential because of its direct correlation with risk assets. A rising dollar weighs on equities, while a declining dollar supports them. The DXY was rejected at the 100.30 level and is now retracing toward the HTF Key Zone, highlighted around 99.
My base case is a move down into the 99 region, followed by short term accumulation and a potential bounce back above this level. Until DXY reaches 99, the trend remains bearish, which historically provides strong support for equities, commodities, and other USD sensitive assets.
VIX – Volatility Index
VIX, which reflects S&P 500 options based volatility expectations, has been declining since the November 21 peak, which aligned with the recent local bottom in the S&P 500. I expect VIX to continue trending lower toward 15.70 and potentially 14.20 levels previously associated with S&P 500 all time highs.
However, it is crucial to note that when VIX reaches these zones, markets often experience rapid and unexpected corrections. Therefore, while volatility compression favors short-term bullish continuation, the risk of a sharp reversal increases as VIX approaches these historically significant thresholds.
Upcoming Data Releases
A high-impact macro week is ahead, especially between Wednesday and Friday. The key releases include:
ISM Manufacturing PMI – Monday
JOLTS Job Openings – Tuesday
ADP Nonfarm Employment – Wednesday
Services PMI – Wednesday
ISM Non-Manufacturing PMI – Wednesday
Initial Jobless Claims – Thursday
PCE Inflation (September, delayed) – Friday
Michigan Consumer Sentiment – Friday
The most influential dataset will be the combination of ADP Employment, Initial Jobless Claims, and PCE Inflation. If labor data comes in stronger than expected, the Fed may interpret it as a sign of a resilient labor market reducing the need for additional cuts. Conversely, if PCE inflation comes in hotter than expected, policymakers may see it as a reason to delay cuts.
Given that this PCE print is delayed due to the U.S. government shutdown, the market reaction may be muted, but it still matters for the December policy narrative.
SPY Weekly Outlook – Prediction
In my opinion, SPY is positioned to target new all time highs early in the week. Price may first test 686, followed by a brief retracement or consolidation, and then continue higher toward 690, marking a fresh ATH. Under strong bullish momentum, SPY may extend into the 700 zone by the end of the week. These levels represent the primary upside targets I will be monitoring closely.
QQQ Weekly Outlook – Prediction
QQQ remains structurally weaker than SPY, yet it also maintains strong bullish momentum. The 617 level is a key zone for potential call entries. Price may initially target 625, where a short term rejection could occur, followed by a small pullback. Afterward, QQQ could advance toward its all time high at 637, and in a stronger continuation scenario, possibly extend to 647.5.
Conclusion
Overall, market conditions have turned constructive again. Sentiment is stabilizing, central bank expectations are supportive, volatility is compressing, and the dollar remains weak all providing a tailwind for equities. This week’s heavy macro calendar may bring volatility spikes, but unless data significantly challenges the rate cut narrative, both SPY and QQQ appear positioned to continue their upward trajectory toward new highs.
⚠️ This analysis is for educational purposes only and does not constitute financial advice. Always conduct your own research before trading or investing.

SPY SELLERS WILL DOMINATE THE MARKET|SHORT
SPY SIGNAL
Trade Direction: short
Entry Level: 685.68
Target Level: 671.00
Stop Loss: 695.40
RISK PROFILE
Risk level: medium
Suggested risk: 1%
Timeframe: 9h
Disclosure: I am part of Trade Nation's Influencer program and receive a monthly fee for using their TradingView charts in my analysis.
✅LIKE AND COMMENT MY IDEAS✅

SPY FREE SIGNAL|SHORT|
✅SPY price is reacting inside a major supply zone after a displacement shift, signaling downside intent as liquidity above has been swept. Favoring continuation lower as price seeks inefficiency fill.
—————————
Entry: 686.84$
Stop Loss: 690.00$
Take Profit: 682.00$
Time Frame: 4H
—————————
SHORT🔥
✅Like and subscribe to never miss a new idea!✅

Stock Market Forecast | BTC TSLA NVDA AAPL AMZN META MSFTStock Market Forecast | CRYPTOCAP:BTC SP:SPX NASDAQ:NDX CME_MINI:ES1!
Mag 7 | TSLA NVDA AAPL AMZN META MSFT GOOGL

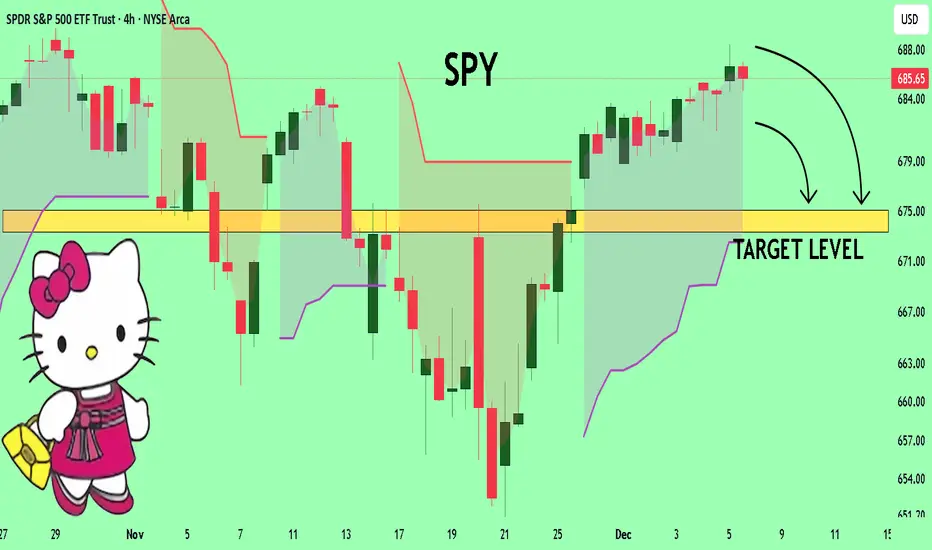
SPY Set To Fall! SELL!
My dear followers,
I analysed this chart on SPY and concluded the following:
The market is trading on 685.65 pivot level.
Bias - Bearish
Technical Indicators: Both Super Trend & Pivot HL indicate a highly probable Bearish continuation.
Target - 675.10
About Used Indicators:
A super-trend indicator is plotted on either above or below the closing price to signal a buy or sell. The indicator changes color, based on whether or not you should be buying. If the super-trend indicator moves below the closing price, the indicator turns green, and it signals an entry point or points to buy.
Disclosure: I am part of Trade Nation's Influencer program and receive a monthly fee for using their TradingView charts in my analysis.
———————————
WISH YOU ALL LUCK
SPY Free Signal! Sell!
Hello, Traders!
SPY is tapping into a premium supply zone after a sharp displacement, with liquidity resting below the recent swing structure. Price is expected to retest the rejection block before delivering a move into downside objectives. Time Frame 6H.
Sell!
Comment and subscribe to help us grow!
Check out other forecasts below too!
Disclosure: I am part of Trade Nation's Influencer program and receive a monthly fee for using their TradingView charts in my analysis.

15M/30M Possible Wyckoff Distribution on $SPYFor tomorrow for me it's pretty simple, looking at the 15M and 30M charts.
Break above $685 with some force and I re-analyze what I thought was a Wyckoff Distro on the 15M/30M charts.
Chop between $683 & $685, then look for a break below $685 and it aligns with Phase C > Phase D LPSY.
Not financial advice, I am a regard.

$SPY & $SPX Scenarios — Friday, Dec 5, 2025🔮 AMEX:SPY & SP:SPX Scenarios — Friday, Dec 5, 2025 🔮
🌍 Market-Moving Headlines
🧨 Big inflation catch-up day: A cluster of delayed PCE reports hits at once — this is the Fed’s preferred inflation gauge and will dictate rate-path expectations into year-end.
🧭 Consumer sentiment & credit: Adds read-through on household stress, spending durability, and recession probability.
📊 Key Data and Events (ET)
⏰ 8 30 AM — Heavy Macro Drop
• Personal Income (Sept, delayed): 0.3% vs 0.4%
• Personal Spending (Sept, delayed): 0.4% vs 0.3%
• PCE Index (Sept, delayed): 0.3% vs 0.3%
• PCE YoY: 2.9% vs 2.9%
• Core PCE Index (Sept, delayed): 0.2% vs 0.2%
• Core PCE YoY: 2.8% vs 2.7%
⏰ 10 00 AM
• Consumer Sentiment (prelim, Dec): 52.0 vs 51.0
⏰ 3 00 PM
• Consumer Credit (Oct): $10.5B vs $13.1B
⚠️ Disclaimer: Educational and informational only — not financial advice.
📌 #SPY #SPX #PCE #inflation #macro #fed #consumer #markets #stocks #trading #investing

ES (SPX, SPY) Analysis, Key-Zone, Setups for Fri (Dec 5th)Market Overview
The daily trend remains firmly upward, with prices pressing against the November swing-high band, characterized by a sequence of higher lows and a gradual ascent toward previous peaks. Momentum indicators on both the daily and 4-hour charts are on the rise, yet they have not entered extreme levels, suggesting a likelihood of continued upward movement into the upper premium band rather than an imminent substantial reversal.
On the 4-hour and 1-hour charts, the E-mini S&P 500 (ES) has been consolidating in a narrow range, roughly between 6835 and 6880, as it builds energy just below the prior high. This range coincides with the 1.272 to 1.618 Fibonacci extension zone, located around 6895 to 6917. Given this setup, the outlook for tomorrow appears slightly bullish, provided the price remains above the mid-range support levels.
Market Brief: Key Developments for December 5, 2025
As we approach the final Federal Open Market Committee (FOMC) meeting of the year scheduled for December 9 -10, market participants are increasingly pricing in a substantial likelihood of a 25 basis point rate cut, along with further easing anticipated in the coming year.
For tomorrow, however, it’s important to note that the widely followed November employment situation report (including Non-farm Payrolls and the unemployment rate) has been officially postponed to December 16 due to the ongoing government shutdown. While some generic calendars may still reflect the original December 5 date for the payroll figures, this information has become outdated. At this time, it appears unlikely that any partial wage data will be released in lieu of the full report.
Nevertheless, many calendars are still marking U.S. hourly earnings and related labor indicators for the morning session. Expectations are set for hourly earnings, nonfarm payrolls, and unemployment rate placeholders around 8:30 AM ET, alongside the University of Michigan consumer sentiment and inflation expectations reports at 10:00 AM ET.
In practical terms, traders should expect regular liquidity levels in Asian and London markets. However, be prepared for potential volatility spikes around the 10:00 AM ET release of the U. Michigan data, especially if any unexpected headlines arise concerning the delayed labor report.
Market Outlook: Overnight Trends into New York Trading Session
As we head into the New York trading session, the key focus remains on the E-mini S&P 500 (ES). The base case scenario suggests that as long as ES maintains support above the significant range of 6854 to 6858 - often referred to as S2 - during any dips seen in the Asian and London sessions, we can anticipate a gradual upward movement. This trajectory would likely involve repeated testing of resistance levels around 6875 to 6880 (R1). Should we witness consistent hourly closes that approach this resistance with only modest pullbacks toward 6860, the likelihood of a breakout toward the premium zone of 6895 to 6910 increases, potentially occurring before or during the New York session.
On the other hand, the alternative scenario would unfold if the market decisively breaks below S2, resulting in a series of hourly closes beneath 6854. Such a development would signal a shift in sentiment and a potential rotation toward support levels S3 and S4, which target 6835. This would likely create a mean-reversion environment, with trading in New York focused more on the lower half of the 6835 to 6880 range rather than pushing for a breakout above resistance. Investors should tread carefully as these scenarios develop.
A++ setup 1 - Long breakout continuation above 6875
Bias: continuation long, only if we see real acceptance above R1.
Trigger conditions:
15m candle closes with a solid body above 6880, turning the 6875 - 6880 band from
Entry zone: 6878 - 6882 on the first 1m/5m higher low after that pullback holds.
Initial stop: 6869, tucked below the 6870 intraday pivot and just under the reclaimed band.
• TP1: 6904 - 6908, inside the 6895 - 6910 premium band, giving you roughly 2R or better if you are filled near the middle of the entry band and respect the tight stop.
• TP2: 6915 - 6918, near the 1.618 extension.
A++ setup 2 - Short reversal from failed break 6895 - 6910
Bias: high-quality fade only if the market runs stops into the premium band and then traps longs.
Entry zone: 6890 - 6896 on a retest of 6895 from below after that rejection is confirmed.
Initial stop: 6908, above the rejection high and inside the upper part of the premium band.
• TP1: 6858, back into the VWAP / prior value area pocket. That gives you roughly 2R or better if you are filled near mid-band with a 10 - 12 point stop.
• TP2: 6843 - 6845, test of NYAM low.
Tomorrow is shaping up to be a pivotal decision point following a robust advance in the market. As long as the support level around 6855 remains intact, any dips should be viewed as buying opportunities, particularly targeting the premium range of 6895 to 6917. However, a decisive rejection from this premium zone, with prices falling back through 6870, may signal an A++ short opportunity, potentially driving prices down toward 6858 and beyond.
Good Luck !!!
IWM - Buy The Rumor Sell The News?Today the IWM saw massive bullish flow, almost piercing the all time high double top.
Many high beta stocks absolutely ripped higher today on huge rate cut expectations.
There a strong chance they may keep small caps strong into the rate cut, which could set up a buy the rumor sell the news.
The rate cut is next week December 10th and it sure has fueled this rally.
we have been trimming some of our long positions into this strength and still have long exposure in key names.
Today we closed
AMEX:UMAC NASDAQ:DPRO FOR 15 - 17% GAINS
NYSE:SLB CALLS 45% GAIN
NYSE:ACN CALLS 102% GAIN

$GLXY Galaxy Digital Inc. Earnings and Technical AnalysisQ3 Earnings Report Overview
On Tuesday, October 21, 2025 at 7:46 AM ET, Galaxy Digital Inc. (GLXY) released its third quarter earnings report for the period ended September 2025. The company announced earnings of $1.12 per share on revenue totaling $29.22 billion. This performance significantly surpassed the consensus estimates, which had projected earnings of $0.38 per share on revenue of $14.69 billion. Overall, Galaxy Digital Inc. exceeded expectations by 194.74%.
Company Background
Galaxy Digital Inc. is recognized as a global leader in digital assets and data center infrastructure. The company delivers innovative solutions aimed at accelerating advancements in finance and artificial intelligence.
Market Reaction and Technical Analysis
Despite reporting strong earnings and revenue figures, Galaxy Digital Inc.’s stock price declined by over 45% following the announcement. This unexpected reaction highlights the challenge of predicting investor sentiment based solely on earnings results. Recently, however, buyer interest has returned, as indicated by a rounded bottom formation on the stock chart. The stock broke above a previous resistance level and has also reclaimed the 20-day Exponential Moving Average (EMA).
Investment Approach
In response to these technical developments, a 1/4 size position was initiated with a stop set just below the previous day's low. The plan is to increase the position once the stock demonstrates a clear higher low and remains above the key resistance level.
Important Considerations
Readers are encouraged to conduct their own analysis and adhere to personal trading strategies. All investments carry inherent risk, and informed decision-making is crucial when allocating capital in financial markets.

Opening (IRA): SPY January 30th 605/615/730/740 Iron Condor... for a 1.25 credit.
Comments: Structuring the setup such that the credit received is about 1/10th the width of the wings which results in the short option legs being at about their respective 10 delta strikes.
Metrics:
Max Profit: 1.25 ($125)
Max Loss/Buying Power Effect: 8.75 ($875)
ROC at Max: 14.28%
ROC at 50% Max: 7.14%
Will generally look to adjust on side test or on side approaching worthless. Am looking to take profit at .25, resulting in a 1.00 ($100) realized gain.

ES (SPX, SPY) Analysis, Levels, Setups for Thursday (Dec 4th)Market Outlook: Key Event and Trading Strategy
Main Event: Tomorrow's primary focus will be the release of US Initial Jobless Claims at 8:30 AM ET. Market participants should anticipate a significant increase in volatility during the premarket session surrounding this announcement. Notably, no other major US economic indicators of similar significance are scheduled to be released, which typically influence the E-mini S&P 500 (ES) as consistently as Jobless Claims does.
Investors should consider the 8:30 AM release as the initial decision point. It is advisable to allow for the initial volatility spike to materialize before assessing market levels as they begin to normalize. The A++ trading setups detailed below are designed to activate following the 8:30 move, ideally capitalizing on opportunities that arise during the morning session in New York.
Market Analysis: Current Landscape and Outlook
Daily Overview: The E-mini S&P 500 (ES) has maintained an upward trajectory, approaching the swing high levels from November. Currently, the price is positioned within the upper range of recent activity, just below a significant resistance zone situated in the high 6800s to low 6900s. While daily momentum indicators remain in positive territory, they are showing elevated levels, suggesting potential for upside continuation. However, the reward for initiating new long positions in proximity to resistance appears limited at this juncture.
An examination of the four-hour chart reveals a sideways trading band beneath the recent highs. Despite repeated attempts to breach the upper boundary, gains have not been sustained, though buyers continue to defend pullback levels. Below the current price, a notable demand zone exists between 6815 and 6825, with a deeper support area around 6780 to 6790. Should the 6815 level hold on a closing basis, the medium-term trend remains favorable.
Today’s price activity has formed a tight range, approximately between 6857 and 6865, with the previous day’s high located near 6873 and early lows today around 6820. The market appears to be consolidating near last week’s highs, with clear liquidity zones identified both above 6873 and below 6840.
For the overnight session extending into the New York trading day, the expectation is sideways-to-up as long as the price remains above 6815. This scenario suggests potential squeezes toward the 6885 to 6900 range before a more significant decision point emerges. Conversely, a decisive break and 15-minute close below the 6815 level would open the door to the 6780 to 6790 region and would likely temper the bullish outlook heading into Friday's session.
A++ Setup 1 - Short from upper band 6885-6898
Entry zone: 6882-6888 short on the first clean 5m lower high after the 15m rejection.
Initial stop: above 6898 (or 2-3 points above the rejection wick if that printed higher). From a mid-band entry, this is roughly 10-12 points of risk.
• TP1: 6860-6863 (return to the top of today’s box and prior week high zone).
• TP2: 6835-6840 (mid-band support).
• Optional runner TP3: 6818-6822 if 6840 fails and selling pressure accelerates.
Invalidation
A decisive 15m close above 6898 that then holds on a pullback. In that case, the short idea is downgraded and price is more likely aiming for 6915-6925.
A++ Setup 2 - Long from demand pocket 6815-6825
Entry zone: 6820-6826 long after the first clean 5m higher low and reclaim of 6825.
Initial stop: under 6808-6810, below the rejection wick and the lower edge of the pocket. From a 6823 entry this is about 13-15 points of risk.
• TP1: 6857-6860 (today’s box floor and first resistance on the way back up).
• TP2: 6868-6873 (prior day high and recent NYPM highs).
• Optional runner TP3: 6885-6895 if price continues squeezing toward the upper resistance band.
Invalidation
A 15m close beneath 6810 that is not reclaimed quickly. That opens the way toward 6780-6790 and downgrades the long.
Good Luck !!!
$SPY & $SPX Scenarios — Thursday, Dec 4, 2025🔮 AMEX:SPY & SP:SPX Scenarios — Thursday, Dec 4, 2025 🔮
🌍 Market-Moving Headlines
🧱 Labor pulse before the weekend: Weekly claims remain a key gauge of cooling versus resilience in the labor market — especially with jobs data still disrupted from prior shutdown delays.
🎤 Bowman speaks at noon: Moderate-impact event, but tone on regulation, credit conditions, and inflation watch may move yields slightly in a light-data session.
📊 Key Data and Events (ET)
⏰ 8 30 AM
• Initial Jobless Claims (Nov 29): 220,000 vs 216,000
⏰ 12 00 PM
• Fed Vice Chair for Supervision Michelle Bowman — Remarks
⚠️ Disclaimer: Educational and informational only — not financial advice.
📌 #SPY #SPX #macro #labor #joblessclaims #fed #markets #stocks #trading #investing