May 12th Trade Journal & Stock Market Analysis May 12th Trade Journal & Stock Market Analysis
EOD accountability report: +778.75
Sleep: 6 hour, Overall health: 👍
Just arrived to BKK, and adjusting to the new place.
day 5 of taking the morning pill stacks consistency and noticing the lions mane working pretty effectively with the new supplements.
trading has been very clear and easy.
Daily Trade recap based on VX Algo System
— Yesterday at 9:30 AM Market Structure flipped bearish on VX Algo X3
Yesterday at 1:00 PM Market Structure flipped bullish on VX Algo X3!
— Yesterday at 1:21 PM VXAlgo ES X1 Sell Signal
— Yesterday at 1:30 PMVXAlgo ES X7 Sell signal,
3:37 PM Market Structure flipped bearish on VX Algo X3!
— Yesterday at 3:50 PM VXAlgo ES X1 Buy signal (triple buy)
Next day plan--> Under 5875 = Bearish with X7 sell signal, Over 5900 = Clearly bullish breakout
Video Recaps -->https://www.tradingview.com/u/WallSt007/#published-charts
SPDR S&P 500 ETF (SPY)

$IWM, small caps, not YET giving the "all clear"AMEX:IWM is the lone index still not in the clear 🚩 — backtesting its 200dma today and tagging the weekly mid-BB , just like in '22. Will it matter by week's end? If not, the bull is likely back across the board 🐂
This week's #CPI (Consumer Price Index) and #PPI (Producer Price Index) prints could significantly influence market direction across major indices — AMEX:SPY , NASDAQ:QQQ and AMEX:IWM — especially with rate cut expectations in flux. 🧵Here's how:
1. Hot CPI or PPI (above expectations):
AMEX:SPY : Likely to pull back as sticky inflation pressures broader S&P names, especially rate-sensitive sectors like real estate and utilities.
NASDAQ:QQQ : Could see sharper downside—tech stocks (many of which are high duration assets) are highly sensitive to interest rate expectations.
AMEX:IWM : Likely the hardest hit. Small caps suffer from tighter financial conditions and depend more on domestic borrowing costs.
🟥 Result: Bearish across the board, with small caps underperforming.
2. Cool CPI or PPI (below expectations):
AMEX:SPY : Broad lift, particularly in consumer discretionary and financials.
NASDAQ:QQQ : Strong rally—mega cap tech loves the prospect of lower yields.
AMEX:IWM : Outperforms if cooling inflation suggests easing ahead, since it's more leveraged to rate cycles and domestic growth.
🟩 Result: Bullish, with small caps possibly leading a relief rally.
3. In-line CPI/PPI :
Markets may stay choppy or consolidate, with AMEX:SPY and NASDAQ:QQQ more stable.
AMEX:IWM remains at risk of drifting lower unless there’s a strong dovish narrative from the Fed or other macro catalysts.
With small caps already lagging, this week’s inflation data could either validate its bearish divergence or spark a rotation rally if inflation
AMEX:SPY NASDAQ:QQQ TVC:VIX $ES_F $NQ_F $RTY_F TVC:TNX NASDAQ:TLT TVC:DXY #Tariffs #Stocks

$HII Earnings Beat and Breakout ContinuationI have been long this name since April 17th. I held through earnings as it has been a slow but steady gainer.
Revenue did fall about 2% YOY. However, this is a good candidate for the new ship building initiative.
If you like this idea, please make it your own and be sure to follow "your" rules of trading. If you like this idea or any others I publish (and they are not always right) follow me on X where I post more often.
Huntington Ingalls Industries Beat Expectations
Thursday, May 1, 2025 at 7:15 AM ET
Huntington Ingalls Industries (HII) reported earnings of $3.79 per share on revenue of $2.73 billion for the first quarter ended March 2025. The consensus earnings estimate was $2.90 per share on revenue of $2.79 billion. The Earnings Whisper number was $3.00 per share. The company beat expectations by 26.33% while revenue fell 2.53% compared to the same quarter a year ago.
The company said it continues to expect 2025 revenue of $11.80 billion to $12.20 billion. The current consensus revenue estimate is $11.95 billion for the year ending December 31, 2025.
HII is a global, all-domain defense partner, building and delivering the world’s most powerful, survivable naval ships and technologies that safeguard our seas, sky, land, space and cyber.

MAY 12th Major and Minor SPIRAL TURN Well we are now Knocking at the door of .786 of the drop and have met this at the spiral turn from feb 18th top 2020 and feb 18th 2025 I have moved back to a short based on 4 things 1 st PUT/call models 2nd fib relationship 3 rd wave structure 4th spirals best of trades WAVETIMER

$SPY still bearish unless $584 and trendline break as resistanceI'll be the first to admit that the rally has gone further than I expected. That said, everything on the chart still looks like this is a bearish rally and not a new bull trend.
Unless we can break the blue trend line and the strong overhead resistance between $581.63 and $583.57, I think the most likely scenario is we fall further and see one last leg down before we bottom.
I think the bottom will come between the lower supports at $409 and $538.
Again, invalidation of the bearish idea is a break and flip of the resistances above, the upside targets are on the chart as well.
Let's see what happens over the coming weeks.

Swing Pick $13 to $210 per share in less than 2 months$13 Buy in March to $200/share today! 😱
Swing Pick on 14th March to buy NASDAQ:RGC at $13.10 per share
Today's high is $210 per share 🔥
15X in less than 2 months, I wish I was still holding, congrats to those that still are 💸
You can also see posts about NASDAQ:RGC on my trading view from 2 months ago even the one mentioning it at $4 per share

SPY/QQQ Plan Your Trade for 4-12 : Rally In CountertrendIn today's video, I try to highlight the TREND features in the SPY CYcle Pattern data window for all of you to use.
Yesterday, I received a comment from a friend/client asking about the strength in the markets compared to my expectations.
My answer was simple. The SPY Cycle Pattern data window shows Short-Term (ST), Long-Term (LT) trending as well as the Daily/Weekly Bias trends.
Traders should use these to determine the primary trend/direction of price action.
Additionally, I try to add my own thoughts/context related to the market setup/structure. That is where I teach you about the EPP/Cradle patterns and more.
Ideally, my analysis and the SPY Cycle Patterns align with the future price moves in a way that everyone can profit from the highest probability outcomes.
There are times when news or outside forces drive the market trend beyond my expectations and, in some cases, beyond the SPY Cycle Pattern predictions. This recent Trump-Pump rally may be one of those cases.
Either way, I continue to try to deliver the best technical analysis and research I can offer for followers.
Get some.
#trading #research #investing #tradingalgos #tradingsignals #cycles #fibonacci #elliotwave #modelingsystems #stocks #bitcoin #btcusd #cryptos #spy #gold #nq #investing #trading #spytrading #spymarket #tradingmarket #stockmarket #silver

Overnight Futures Pop 2.8% on Surprise Tariff TruceYou either woke up to a panic… or to a profit.
This morning, markets are ripping higher - not because of earnings, not because of data - but because two superpowers shook hands over fondue in Switzerland.
If you're feeling blindsided, you probably chased last week’s noise.
If you're feeling calm, you’re probably following the AntiVestor way.
---
SPX Market Briefing
The headlines are loud. So let’s talk facts.
Over the weekend, the United States and China agreed to a 90-day tariff rollback:
US duties drop from 145% to 30%
China drops theirs from 125% to 10%
Both sides now pretending to like each other until mid-August
Markets reacted the only way they know how: with euphoria.
SPX futures are up 2.8%. Nasdaq is flying. The Dow surged more than 900 points premarket.
Here’s what we did:
Nothing reckless. Nothing oversized. Nothing emotional.
The system turned bearish late last week, and we followed it - small, tactical, mechanical. Not a bet. Just a position.
And here’s the kicker:
I still held a few bullish positions from the prior bias. They were so far out-of-the-money, I didn’t even bother closing them.
Guess what?
They’re in profit - and my net exposure is green despite the initial bear swing going underwater.
So while the news makes others overreact, we get to do what we always do:
Let the market come to us.
The real money isn’t made chasing this 2.8% pop.
It’s made waiting for the next confirmed setup.
...and a little good luck always helps ;)
---
Expert Insights:
Mistake: Jumping into emotional gap openings
AntiVestor Fix: Let others panic. Let your system speak.
Gap moves on news tend to retrace or fade - and even if they don't, entering late is a coin toss. Smart traders wait. Pros wait. We wait.
---
Rumour Has It…
Whispers from the Swiss hotel bar claim the entire US-China agreement was sparked when both delegates reached for the same dessert spoon. One espresso and a bottle of Pinot later, tariffs were slashed and SPX gapped 2.8%.
This is entirely made-up satire. Probably!
Breaking scoops courtesy of the Financial Nuts Newswire-because who needs sanity?
Fun Fact
According to CBOE data, Monday gap-ups following geopolitical “resolutions” average a +2.2% open… but only hold those gains 41% of the time by Friday’s close. Which means chasing the open? Not your best trade. Waiting for follow-through? That’s the edge.

Cautious Optimism: What’s Next for the S&P 500US500 My Outlook for the Next Week:
Given the relentless bullishness on the chart and the current backdrop, here’s how I see the next week playing out:
Short-Term: The S&P 500 may continue to consolidate or experience mild pullbacks as investors digest recent gains and await fresh catalysts. Sector rotation could create choppiness, especially if tech underperforms.
Catalysts: Watch for key economic data (inflation, employment, Fed commentary) and any major earnings surprises. These could trigger renewed momentum or a sharper correction.
Risk/Reward: The risk of a sharp correction is rising, but the underlying trend remains bullish unless there’s a significant negative surprise. A shallow pullback or sideways action would be healthy and could set up the next leg higher if fundamentals remain intact.
In summary: The S&P 500’s relentless bullishness is being tested by mixed sentiment and cautious analyst forecasts. Fundamentals are still supportive, but risks are rising. For the next week, expect consolidation or mild volatility, with the potential for renewed upside if economic data and earnings remain strong. Stay nimble, watch for sector rotation, and be prepared for both short-term pullbacks and longer-term opportunities.
Not financial advice.

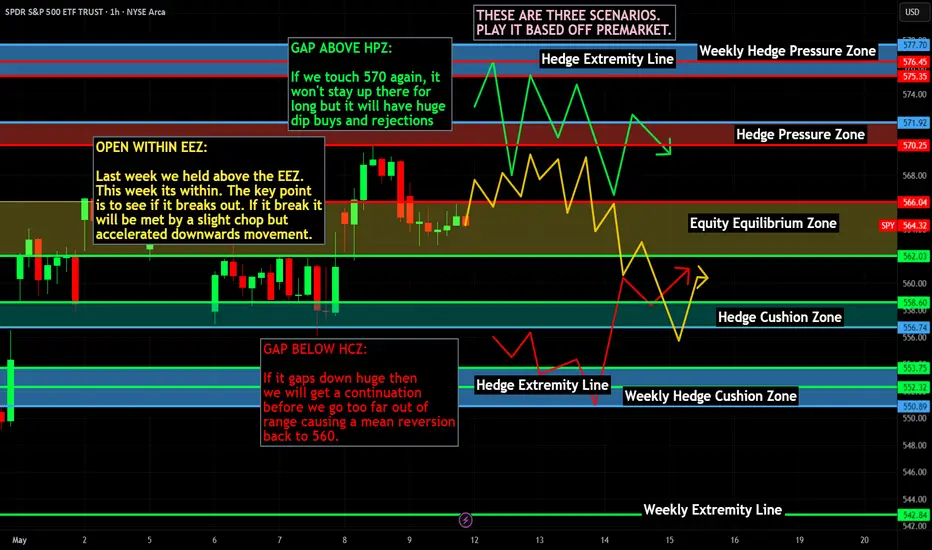
SPY WEEKLY 12 MAY 2025Welcome to Spy weekly. I have tried my best to explain the price action here. If you have any doubts, feel free to leave a comment or DM me.
NOTESTAY AWAY FROM OPTIONS

Weekly $SPY / $SPX Scenarios for May 12–16, 2025 🔮 Weekly AMEX:SPY / SP:SPX Scenarios for May 12–16, 2025 🔮
🌍 Market-Moving News 🌍
📊 Inflation and Retail Sales Data in Focus
Investors are closely watching this week's release of the Consumer Price Index (CPI) on Tuesday and Retail Sales data on Thursday. These reports will provide insight into inflation trends and consumer spending amid ongoing tariff concerns.
🤝 U.S.-China Trade Talks Resume
High-level trade discussions between the U.S. and China are set to continue this week in Switzerland. The outcome of these talks could significantly impact global markets and investor sentiment.
💼 Key Corporate Earnings Reports
Major companies including Walmart ( NYSE:WMT ), Cisco ( NASDAQ:CSCO ), Applied Materials ( NASDAQ:AMAT ), and Take-Two Interactive ( NASDAQ:TTWO ) are scheduled to report earnings this week. These reports will offer insights into consumer behavior and the tech sector's performance.
🏦 Federal Reserve Speeches
Federal Reserve Chair Jerome Powell is scheduled to speak on Thursday, with other Fed officials also making appearances throughout the week. Their comments will be analyzed for indications of future monetary policy directions.
📊 Key Data Releases 📊
📅 Monday, May 12:
No major economic data scheduled.
📅 Tuesday, May 13:
8:30 AM ET: Consumer Price Index (CPI) for April
📅 Wednesday, May 14:
10:30 AM ET: EIA Crude Oil Inventory Report
📅 Thursday, May 15:
8:30 AM ET: Retail Sales for April
8:30 AM ET: Producer Price Index (PPI) for April
8:30 AM ET: Initial Jobless Claims
9:15 AM ET: Industrial Production and Capacity Utilization
10:00 AM ET: Business Inventories
2:00 PM ET: Federal Reserve Chair Jerome Powell speaks
📅 Friday, May 16:
8:30 AM ET: Housing Starts and Building Permits for April
10:00 AM ET: University of Michigan Consumer Sentiment Index (Preliminary) for May
S&P Global
⚠️ Disclaimer:
This information is for educational and informational purposes only and should not be construed as financial advice. Always consult a licensed financial advisor before making investment decisions.
📌 #trading #stockmarket #economy #news #trendtao #charting #technicalanalysis
Weekly Market Forecast: Wait For BUYS! Stock Indices and GoldIn this Weekly Market Forecast, we will analyze the S&P 500, NASDAQ, DOW JONES, Gold and Silver futures, for the week of May12 - 16th.
The Stock Indices were sluggish last week, holding at support. Wait for a market structure shift to the upside to confirm buys.
Gold and Silver may move higher, as India and Pakistan, Gaza and Ukraine are increasingly troublesome.
CPI Data on Tuesday. This could be a strong market mover.
Enjoy!
May profits be upon you.
Leave any questions or comments in the comment section.
I appreciate any feedback from my viewers!
Like and/or subscribe if you want more accurate analysis.
Thank you so much!
Disclaimer:
I do not provide personal investment advice and I am not a qualified licensed investment advisor.
All information found here, including any ideas, opinions, views, predictions, forecasts, commentaries, suggestions, expressed or implied herein, are for informational, entertainment or educational purposes only and should not be construed as personal investment advice. While the information provided is believed to be accurate, it may include errors or inaccuracies.
I will not and cannot be held liable for any actions you take as a result of anything you read here.
Conduct your own due diligence, or consult a licensed financial advisor or broker before making any and all investment decisions. Any investments, trades, speculations, or decisions made on the basis of any information found on this channel, expressed or implied herein, are committed at your own risk, financial or otherwise.

$SPX Urgent! My <3 & My Soul: Slow Bleed Crash to 3k by Q4 26' Do be warned. Very important post here. I put my heart and soul into this. I made a video earlier and then it got deleted by accident, so I made a less happy one right after. I've got news for all the bulls and investors out there that feel they will be able to continue buying every single dip out there. Get ready for the dip that keeps dipping. Big names already cracking heavy. NASDAQ:META NASDAQ:TSLA NASDAQ:AMD NASDAQ:NVDA to name a few. Big tech is getting cleaned out and layoffs are on the rise. Tariffs create huge amounts of uncertainty. I don't feel like this is rocket science. Buffet is all cash. 89% of Hedge Fund managers believe the US market is the most expensive its ever been and Tutes have been selling at the highest rate ever before. I think it's time the US finally gets a shake down. Bullish conditioning has been running rampant, and I've seen Social Media Accounts discourage charting and only paying attention to price action? Price action involves the entire collective, not just one Timeframe. Anyways, here's an overlay from 01' ... the only one I could find that matches. Says short 560 around May 7th and then take profits around 500 again. Let's make this a nice one. Calls till 560 into May then flip to Puts into June. From then short 530 every time you can. $450 is My first target after we break previous lows. I will update as we go. Have a good one yall.

Trade Idea: $MSFT Short to $418 and beyond into JuneTriple bearish divergence is evident on Volume, RSI, and Momentum. The 9-count sell signal on the daily chart further supports the likelihood of a sell-off at this point. If the price falls below $425, a swift decline to $418 is anticipated, where the true test of the Fair Value Gap (FVG) below will occur. The Fair Value Gap open is at $392.45. Stop would be above yesterday's high at $439.50 ...

SPY My Opinion! SELL!
My dear friends,
Please, find my technical outlook for SPY below:
The price is coiling around a solid key level - 564.32
Bias - Bearish
Technical Indicators: Pivot Points Low anticipates a potential price reversal.
Super trend shows a clear sell, giving a perfect indicators' convergence.
Goal - 539.96
Safe Stop Loss - 577.94
About Used Indicators:
The pivot point itself is simply the average of the high, low and closing prices from the previous trading day.
Disclosure: I am part of Trade Nation's Influencer program and receive a monthly fee for using their TradingView charts in my analysis.
———————————
WISH YOU ALL LUCK

Stock Market Forecast | TSLA NVDA AAPL AMZN META MSFTStock Market Forecast | CME_MINI:NQ1! NASDAQ:QQQ AMEX:SPY CME_MINI:ES1!
Mag 7 Forecast | NASDAQ:TSLA NASDAQ:NVDA AAPL AMZN META MSFT GOOG

SPY: Short Signal Explained
SPY
- Classic bearish setup
- Our team expects bearish continuation
SUGGESTED TRADE:
Swing Trade
Short SPY
Entry Point - 564.32
Stop Loss - 575.90
Take Profit - 539.83
Our Risk - 1%
Start protection of your profits from lower levels
Disclosure: I am part of Trade Nation's Influencer program and receive a monthly fee for using their TradingView charts in my analysis.
❤️ Please, support our work with like & comment! ❤️

May 9th Trade Journal & Stock Market AnalysisEOD accountability report: +440
Sleep: 6 hour, Overall health: :thumbsup:
I have been traveling the last few days and didn't have a chance to trade. just finally catching up on things again and getting hte videos out.
Daily Trade recap based on VX Algo System
— 9:44 AM Market Structure flipped bearish on VX Algo X3!
— 10:30 AM Market Structure flipped bearish on VX Algo X3!
— 1:10 PM VXAlgo ES X1 Buy signal
— 2:09 PM Market Structure flipped bullish on VX Algo X3!
— 2:10 PM VXAlgo NQ X1 Sell Signal
Next day plan--> Over 5650 = Bullish, Under 5650 = Bearish
Video Recaps -->https://www.tradingview.com/u/WallSt007/#published-charts

SPY (S&P500 ETF) - Testing Key Resistance Levels - Weekly ChartSPY (S&P500 ETF) is currently attempting an uptrend rally, bouncing up from the April 7th 2025 support level ($488) and weekly support trendline.
The current resistance price level is $569 above, and the support price level below is $555.
SPY price needs to remain and close above $522 in May 2025 to maintain the current uptrend rally.
Resistance price targets above: $569, $578, $600, $610.
Support price targets below: $555, $542, $533, $512.
Tariff and trade deal news, corporate earnings, government law changes, and consumer sentiment will continue to affect the stock price action of SPY.
Support price levels need to hold for an uptrend to continue in 2025.

S&P 500 Braces for a Drop to $5,100–$5,177: Correction Coming?S&P 500 Braces for a Drop to $5,100–$5,177: Is the Correction Coming?
SP500 Reached the target of $5,680 - $5,800 and is going into correction along with Bitcoin 🤔.
Before:
After:
➖ The S&P 500 could fall to the 5100–5177 range due to the following fundamental factors:
FOMC Meeting on May 7: Expected rate hold and potentially hawkish rhetoric from Powell could amplify fears of rate hikes, hitting growth stocks.
➖ Trade War: Uncertainty in U.S.-China negotiations and risks of new tariffs threaten supply chains and corporate profits.
➖ Weak Economy: GDP contraction (-0.3% in Q1), recession fears, and weak PMI data fuel pessimism.
➖ Corporate Earnings: Disappointing guidance from key companies (e.g., Apple, Tesla) could trigger sell-offs.
➖ Sentiment on X: Bearish sentiment reflects market caution.
➖ Global Risks: Retaliatory tariffs and rising gold prices signal a flight from U.S. assets.
Assumption: If the Fed on May 7 emphasizes inflation risks and delays rate cuts, and tariff news remains negative, the S&P 500 could break support at 5500 and reach 5100–5177 within 1–2 weeks, especially amid technical selling and market panic.

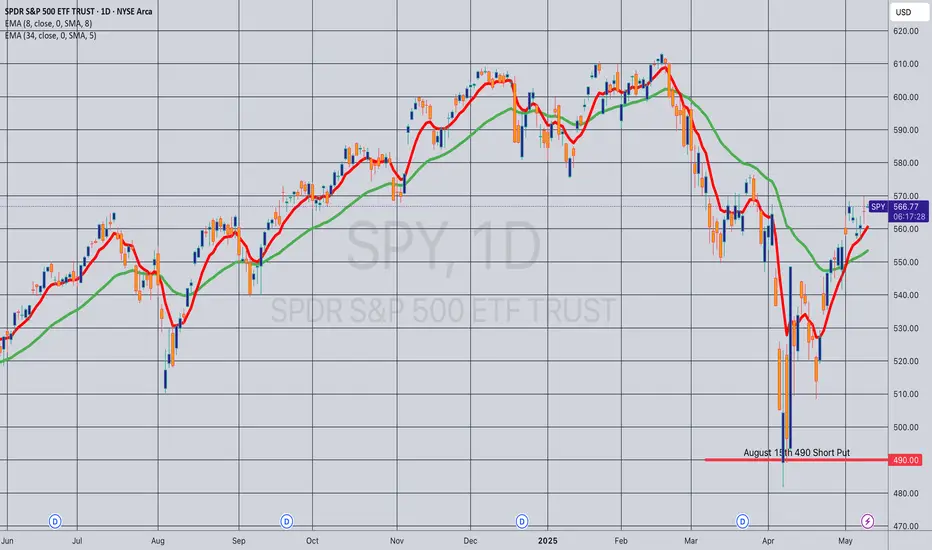
Opening (IRA): SPY August 15th 490 Short Put... for a 5.00 credit.
Comments: Laddering out, targeting the strike paying around 1% of the strike price in credit ... .
Will generally look to roll up to the shortest duration <16 delta strike paying 1% of the strike price if in profit.
$LDOS Earnings Beat and Cup BaseI have been long NYSE:LDOS since March 17th with a ½ size position. I have come close to being stopped out but, my stop never hit. I was up enough that I held through earnings on May 6th. I would expect that it could form a small handle on this cup base, but it may not.
I like the fact that it is above all the Moving Averages. I am not an expert at Fibonacci lines, but it looks like we are right at the .382 retracement area and what is a small resistance area as well. Once through that area, the 50% retrace aligns with another area of resistance. At around $160 – 165 a share.
They were upgraded to Overweight by Wells Fargo with a price target of $200.
If you like this idea, please make it your own so it aligns with your trading / investing plan.
Leidos Beat Expectations
Tuesday, May 6, 2025 at 6:00 AM ET
Leidos (LDOS) reported earnings of $2.97 per share on revenue of $4.25 billion for the first quarter ended March 2025. The consensus earnings estimate was $2.47 per share on revenue of $4.08 billion. The Earnings Whisper number was $2.54 per share. The company beat expectations by 16.93% while revenue grew 6.79% on a year-over-year basis.
The company said it continues to expect 2025 earnings of $10.35 to $10.75 per share on revenue of $16.90 billion to $17.30 billion. The current consensus earnings estimate is $10.51 per share on revenue of $17.09 billion for the year ending December 31, 2025.
Leidos Holdings Inc. is an applied technology company delivering solutions and services that leverage the power of data analytics, systems integration, and cybersecurity across three markets: national security, health, and engineering.

Tag ‘n Turn → Bear Mode EngagedV-Shape Reversal Confirms Short Bias
You ever see a setup pull a fakeout, tease a breakout, then pivot perfectly back into your system?
That was yesterday.
The Tag ‘n Turn gave us another clean swing exit off the upper Bollinger Band, and while I was ready to defer the next entry, a tidy little V-shaped reversal handed us the confirmation we needed. We’re back bearish. Levels are set. Now we let the market do its thing.
---
SPX Market View
Let’s unpack the sequence.
Price ran up into the upper Bollinger Band and triggered the final legs of our overnight swings. That was the cash-out point – system clean, profits booked.
But I wasn’t diving into the next setup just yet.
Why?
Because it looked like the start of a Bollinger breakout – the kind that breaks the pinch and rips higher. So I paused. Waited.
Then came the V-shaped reversal – clear as day within 2 hours.
Entry happened late in the day, around the same level the mechanical Tag ‘n Turn would have fired. No edge lost. Just added confirmation.
Now? The system is officially bearish again, with a firm rejection at highs and a sharp drive lower that flipped the tone of the day and the bias on the chart.
Today’s key levels:
5620 = GEX flip zone
Also where we bounced up post-FOMC
5680 = resistance zone – could mark today’s top
We’re back in the pre-FOMC chop zone.
The plan:
Bearish until price tells us otherwise
Hedge levels marked
No chase
Wait for price to hit our zone
Let the system print
Expert Insights:
Jumping the gun on reversals – wait for structure, not assumptions.
Chasing breakouts too early – pinch points often fake before they break.
Skipping levels – 5620 and 5680 matter. Mark them or risk regret.
Overmanaging overnight trades – exits were planned. Trust the system.
Forcing direction changes – confirmation > prediction. The system knows.
Satirical cartoon showing confirmation over prediction.
Rumour Has It…
Word is the SPX reversal was caused by a rogue intern at the Fed who mistook the breakout chart for a bowl of ramen and tried to stir it with a mouse. After rebooting TradingView, they accidentally submitted a bearish policy note to Bloomberg. The market reversed out of pure confusion.
This is entirely made-up satire. Probably!
Breaking scoops courtesy of the Financial Nuts Newswire-because who needs sanity?
---
Fun Fact
The term “V-shaped reversal” originated in early floor trading days when chalkboard analysts would literally sketch a V on the board as a real-time note to floor brokers. That visual shorthand became one of the most recognized intraday patterns in trading – a pattern that still works in a world of tickers, bots, and zero-DTE.
