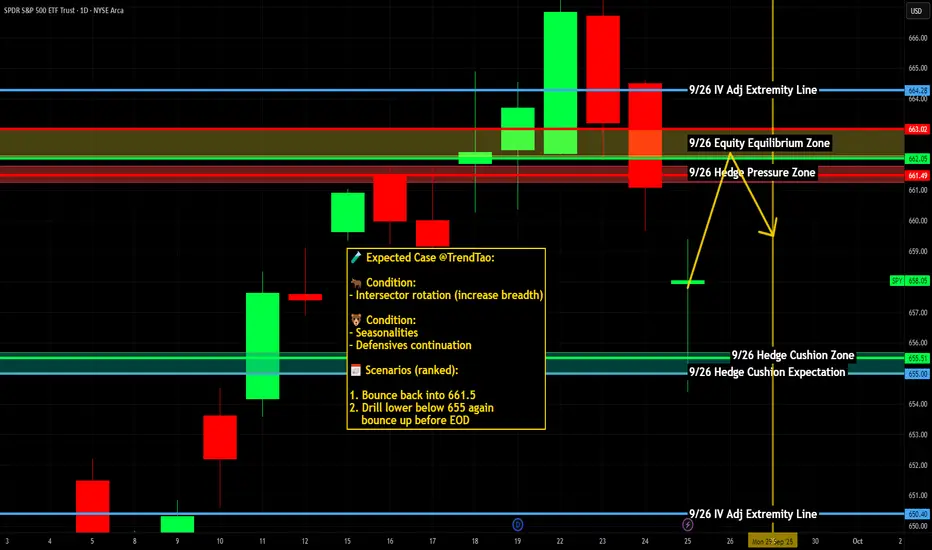
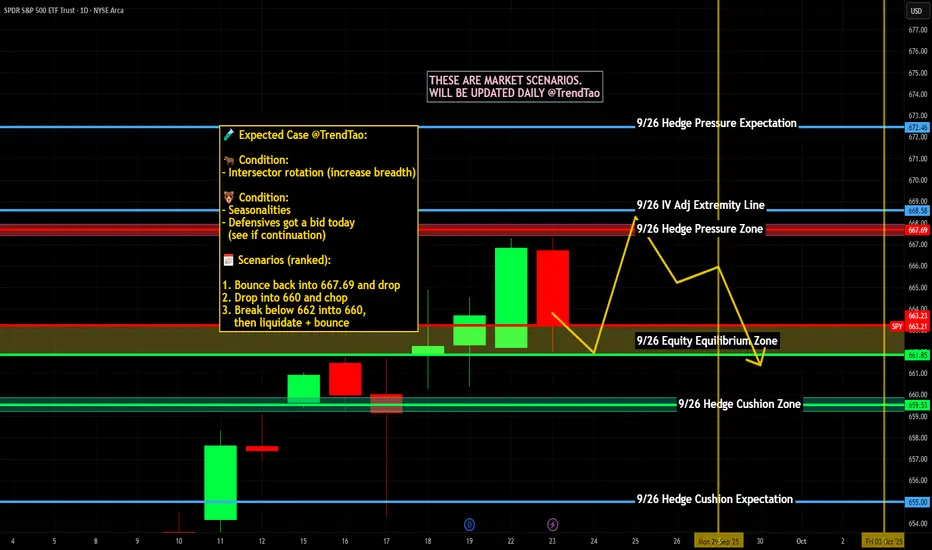
$SPY / $SPX Scenarios — Friday, Sept 26, 2025🔮 AMEX:SPY / SP:SPX Scenarios — Friday, Sept 26, 2025 🔮
🌍 Market-Moving Headlines
📉 Month-end flows: Positioning shuffle as traders square books into Q3-end.
💵 Fed lens: Multiple Fed appearances keep policy tone in focus post-SEP.
💻 Tech + growth watch: AMEX:XLK flows remain sensitive to yields + inflation gauges.
🛢️ Commodities check: Oil and dollar volatility continue to set cross-asset tone.
📊 Key Data & Events (ET)
⏰ 🚩 8:30 AM — Personal Income & Spending (Aug)
⏰ 🚩 8:30 AM — PCE Price Index (Aug) + Core PCE (YoY & MoM)
⏰ 10:00 AM — Consumer Sentiment (Final, Sep)
🗣️ Fed Speakers:
• 7:30 AM — Tom Barkin (Richmond Fed, TV appearance)
• 9:00 AM — Tom Barkin (speech)
• 1:00 PM — Michelle Bowman (Fed Vice Chair for Supervision)
⚠️ Disclaimer: Educational/informational only — not financial advice.
📌 #trading #stockmarket #SPY #SPX #PCE #inflation #Fed #Powell #joblessclaims #consumer #Dollar #bonds #megacaps
SPDR S&P 500 ETF (SPY)
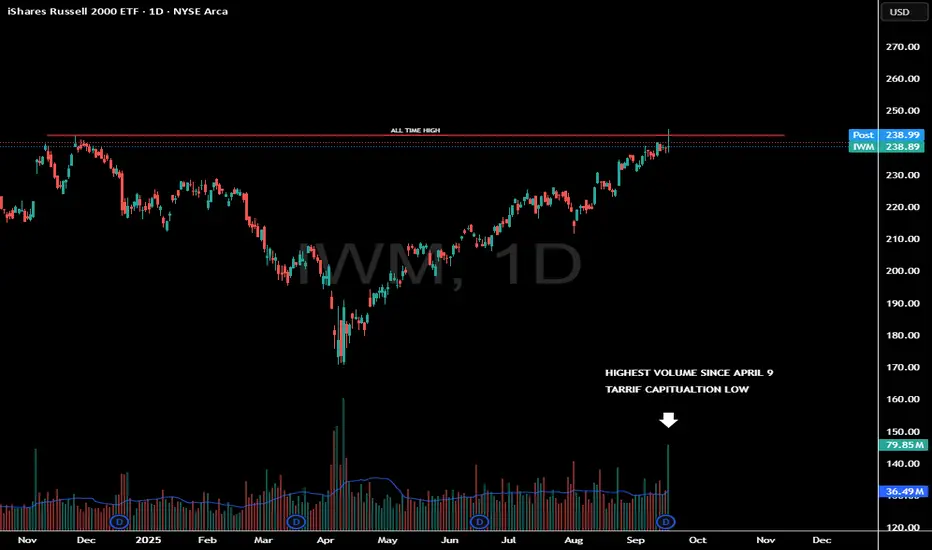
Highest Volume Candle Since Tarriff LowIWM saw a nasty reversal off the all time highs today.
A potential weekly topping tail is building.
What important about this reaction is the amount of volume that was traded.
This was the highest candle since April 9th.
High Volume reversals need to be monitored closely as it does show large money distributed into this strength.
A high volume candle marked the tariff bottom.
Will a high volume candle signal a near term top?
Blood in the streets...Is a Bear Market Starting? We discuss the technical obseravtion in the SPX / SPY.
Why was IWM so weak today?
What is happening with inflation & why are yields rallying?
Are tensions with Russia escalating?
Today we closed IWM 241 puts for 150% gain.
We took profits on many other short ideas & entered several new trades today.
Caution needs to be warranted since the Dollar and oil are rallying.

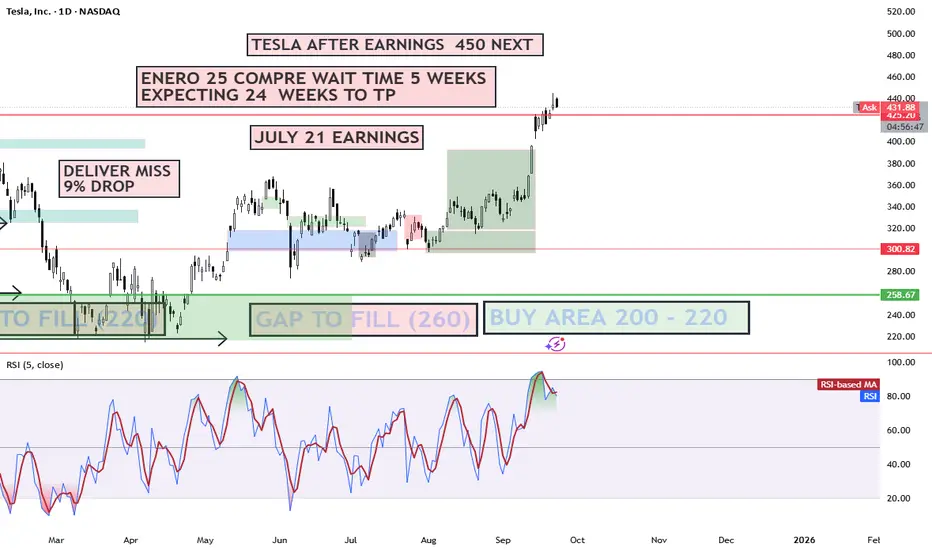
TSLA LONG SWING READ NOTES 25 SEP 2025I have bought some Tesla stocks now around $424 for swings. I know market is all time high & Tsla can do $450 here. I am just taking market over all support which is again very poor.
This is an average trade
If you are not confident dont trade.
I have gone long with stocks only

ES-mini Futures - (SPX) Analyses for Sep 25Market drivers for Thu, Sep 25 (ET)
• 8:30 — GDP 2Q (Third estimate) + Corporate Profits (annual update). Official BEA release.
• 8:30 — Durable Goods (Advance, Aug). Census M3 advance report (release time 8:30 a.m. ET).
• 8:30 — Initial Jobless Claims (weekly). DoL weekly claims (standard Thu 8:30 a.m. ET cadence).
• 10:00 — Existing-Home Sales (Aug). National Association of Realtors, scheduled for Thu 10:00 a.m. ET.
• Fed speakers — Vice Chair Bowman: 9:00 a.m. (Economic Outlook) and 1:00 p.m. (Approach to Monetary Policy).
• Treasury — Multiple bill auctions scheduled for Sep 25 (4-, 6-, 13-, 26-, 52-week). Watch rate/curve reaction around midday.
• (Context) Atlanta Fed GDPNow next update Fri, Sep 26 (used by markets for GDP tracking).
Risk windows to respect: 8:30 (data cluster) and 10:00 (housing). Avoid fresh entries ~5m before/after these prints; expect liquidity gaps.
Overall bias & PA projection (overnight → tomorrow)
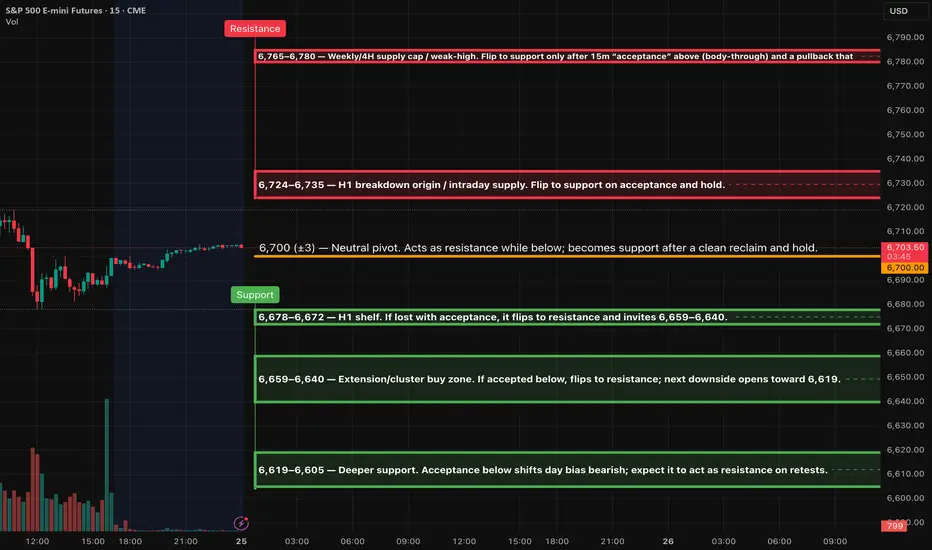
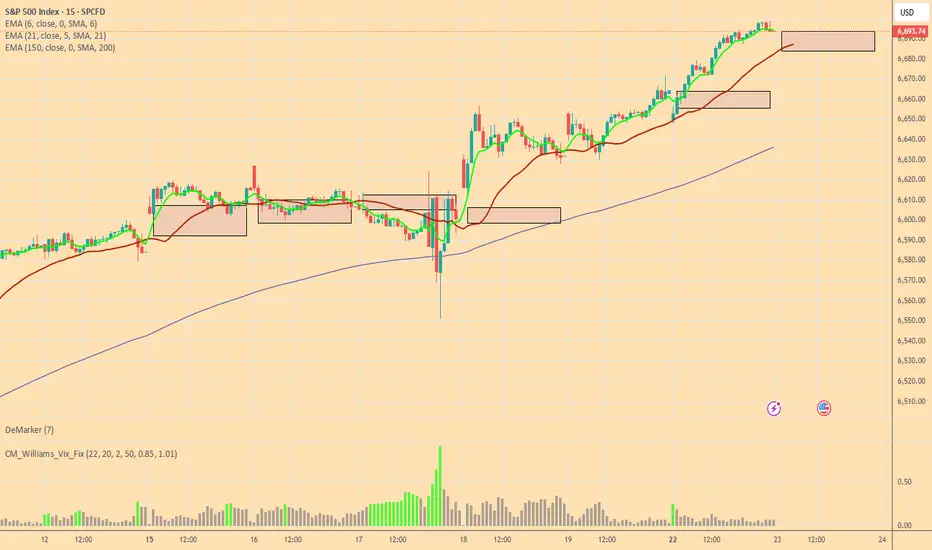
Structure: Uptrend on higher timeframes, but near a weekly/4H supply cap ~6,76x–6,78x with a fresh H1 pullback printed.
Bias into NY: Balanced-to-slightly-bullish if 6,67x holds. Below that, rotation toward the extension cluster 6,66x–6,64x likely before buyers try again.
Overnight projection: Asia/London likely to range 6,68x–6,70x. A London stop-run under 6,678 that quickly reclaims sets the stage for NY bounce. Acceptance below 6,672 opens 6,659 → 6,640 → 6,619.
NY session — A++ setups (Level-KZ Protocol 15/5/1)
Management rules (as usual): TP1 = next opposing MAJOR level; close 70% at TP1, leave 30% runner → TP2/TP3; hard SL = 15m trigger wick ±0.25–0.50pt; time-stop 45–60m; max 2 attempts per level.
ES SHORT (A++) — Rejection Fade at 6,735–6,750
Trigger: 15m rejection close back inside the zone → 5m re-close down with LH → 1m pullback fail to enter.
Entry: 6,740 ±2 (within zone after the 1m pullback).
SL: Above the 15m signal wick / hard cap 6,768.
• TP1: 6,700 pivot.
• TP2: 6,678–6,672 shelf.
• TP3: 6,659–6,640 ext cluster.
Invalidation / maintenance: Two whipsaws or a 15m body-through ≥1.0pt above 6,768 → demote/stand down; acceptance >6,768 flips bias to longs toward 6,78x.
ES LONG (A++) — Acceptance-Continuation from 6,658–6,642
Context: High-prob “flush & reclaim” at the extension cluster before/after 8:30 data.
Trigger: 15m full-body close back above 6,652, 5m HL + re-close up, 1m HL entry.
Entry: 6,650 ±3 after reclaim.
SL: Below the 15m signal wick / hard cap 6,637.
• TP1: 6,700 pivot.
• TP2: 6,724–6,735 supply.
• TP3: 6,760–6,770 (weekly cap).
Notes: If the 8:30 print gaps price through TP1 immediately, manage fills but still honor runner plan; no trailing before TP2 per protocol.
==========
London session game plan (02:00–05:00 ET)
Base case: Range 6,678–6,700 with liquidity sweeps. Reclaim of 6,700 during London often fades back into the range; prefer patience for NY AM.
Alternative: London sell program to 6,66x–6,64x → if quick reclaim above 6,652, that’s the Tier-2 bounce that feeds the NY long setup.
Bear path: Acceptance <6,640 in London → prepare for a trend-day lower toward 6,619 unless NY reverses on data.
$SPY / $SPX Scenarios — Thursday, Sept 25, 2025🔮 AMEX:SPY / SP:SPX Scenarios — Thursday, Sept 25, 2025 🔮
🌍 Market-Moving Headlines
📉 Data-heavy morning: Multiple macro releases hit at 8:30 AM, setting tone across bonds, USD, and equities.
💬 Fed chorus: Packed lineup of Fed speakers keeps policy narrative in focus.
💻 Tech + rates tension: AMEX:XLK flows remain sensitive to bond yield direction post-FOMC.
🛢️ Energy lens: Oil volatility continues to act as an inflation wildcard.
📊 Key Data & Events (ET)
⏰ 🚩 8:30 AM — Initial Jobless Claims (weekly)
⏰ 🚩 8:30 AM — GDP (Q2, third estimate)
⏰ 🚩 8:30 AM — Durable Goods Orders (Aug)
⏰ 10:00 AM — Existing Home Sales (Aug)
🗣️ Fed Speakers:
• 8:20 AM — Austan Goolsbee (Chicago Fed)
• 9:00 AM — John Williams (NY Fed) & Jeff Schmid (Kansas City Fed)
• 10:00 AM — Michelle Bowman (Fed Vice Chair for Supervision)
• 1:00 PM — Michael Barr (Fed Gov.)
• 1:40 PM — Lorie Logan (Dallas Fed)
• 3:30 PM — Mary Daly (San Francisco Fed)
⚠️ Disclaimer: Educational/informational only — not financial advice.
📌 #trading #stockmarket #SPY #SPX #GDP #joblessclaims #durablegoods #housing #Fed #Powell #Dollar #bonds #megacaps
SPY S&P 500 etf Oversold on the RSI ! 2025 Price Target ! The SPDR S&P 500 ETF Trust (SPY) is flashing a major buy signal, with its Relative Strength Index (RSI) currently sitting at 28.33 — firmly in oversold territory. Historically, every time SPY has entered oversold levels on the RSI, institutional buyers have stepped in aggressively, driving sharp rebounds in the following weeks and months.
The last time SPY dipped below the 30 RSI threshold was during market pullbacks in 2022 and 2023 — both of which were followed by significant rallies as institutions capitalized on discounted valuations. The current setup is no different. With earnings growth stabilizing, inflation cooling, and the Federal Reserve signaling a potential shift toward rate cuts in the second half of the year, the backdrop for a recovery is aligning perfectly.
Technically, SPY is also approaching key support levels that have held strong in past market corrections. The combination of an oversold RSI and strong institutional appetite at these levels creates a compelling case for a bounce.
My price target for SPY by year-end is $640, representing over 15% upside from current levels. With sentiment stretched to the downside and technical indicators flashing green, SPY looks primed for a sharp and sustained rebound. Now could be the perfect time to position for the next leg higher.

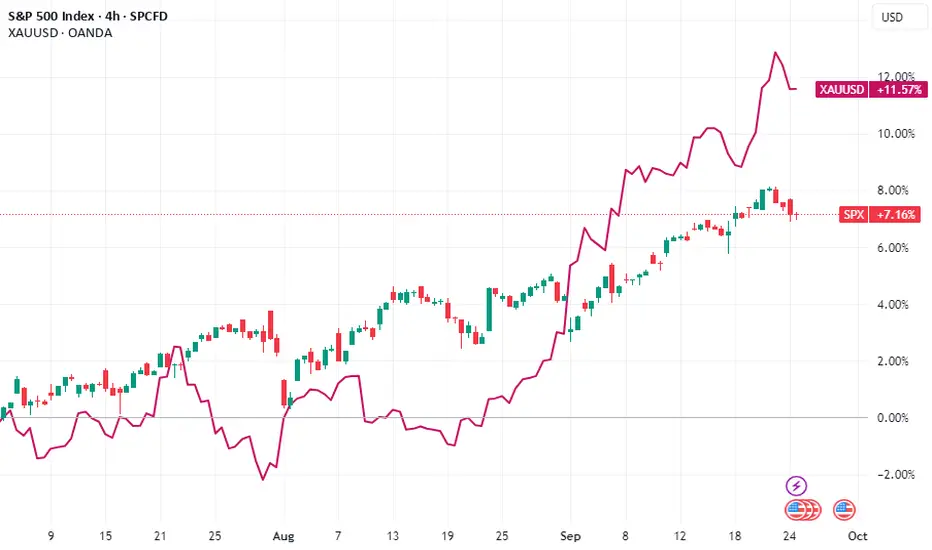
Gold’s Decade Shines Less Brightly for Stocks: The New Rational
Gold’s Decade Shines Less Brightly for Stocks: The New Rationale for the King Metal
For over a decade, the narrative surrounding gold was one of stark contrast to the equity markets. As stock indices, powered by tech innovation and ultra-low interest rates, embarked on a historic bull run, gold was often relegated to the sidelines—a relic for the fearful, an underperforming asset in a world chasing yield. The 2010s were, without question, the decade of the stock market. Gold’s shine, by comparison, seemed dull.
But a perceptible shift is underway. The latest rally in gold, which has seen it scale unprecedented nominal heights, is not the frantic, fear-driven surge of past crises. Instead, it appears to be driven by a more sober, strategic, and perhaps more durable force: the rational calculations of central banks and a fundamental rewiring of the global financial architecture. This new rationale suggests that gold’s resurgence may not spell immediate doom for stocks, as traditional wisdom would hold, but rather reflects a new, more complex macroeconomic reality where the two can coexist, albeit with gold casting a long, less brilliant shadow over the equity landscape.
The Ghost of Gold Rallies Past: A Tale of Fear and Froth
To understand the significance of the current rally, one must first revisit the drivers of previous gold booms. Historically, gold’s major upward moves were tightly correlated with periods of acute stress and negative real interest rates.
The post-2008 financial crisis surge, which took gold from around $800 an ounce in 2008 to over $1,900 in 2011, was a classic "fear trade." The world was confronting a systemic banking collapse, unprecedented monetary experimentation in the form of Quantitative Easing (QE), and rampant fears of runaway inflation and currency debasement. Gold was the safe haven, the hedge against a collapsing system. Similarly, the spike in mid-2020, at the onset of the COVID-19 pandemic, was a panic-driven flight to safety as global economies screeched to a halt.
These rallies shared common characteristics: they were often sharp, volatile, and ultimately prone to significant retracements. When the immediate crisis abated—when inflation failed to materialize post-2008, or when fiscal and monetary stimulus ignited a V-shaped stock market recovery in 2020—the rationale for holding a non-yielding asset weakened. Money flowed back into risk assets like stocks. Gold’s role was binary: it was the asset for when things were falling apart. In a functioning, risk-on market, it had little place.
This created the perception of an inverse relationship. A strong gold price was a signal of market distress, and thus, bad for stocks. But this decade is different.
The New Architects: Central Banks and Strategic Repatriation
The most profound change in the gold market has been the transformation of its largest and most influential buyers: central banks. For years, the narrative was that developed Western central banks, holders of the world’s primary reserve currencies, were gradually diversifying away from gold. The modern financial system, built on the U.S. dollar, Treasury bonds, and other interest-bearing instruments, was deemed superior.
That assumption has been decisively overturned. Since around 2010, but accelerating dramatically in recent years, central banks—particularly those in emerging economies—have become net purchasers of gold on a massive and sustained scale. The World Gold Council reports that central banks have been adding to their reserves for over a decade, with annual purchases hitting multi-decade records.
This buying is not driven by panic. It is a calculated, long-term strategic move rooted in three key rationales:
1. De-dollarization and Geopolitical Hedging: The weaponization of the U.S. dollar through sanctions, particularly against Russia following its invasion of Ukraine, served as a wake-up call for nations not squarely in the U.S. geopolitical orbit. Holding vast reserves in U.S. Treasury bonds suddenly carried a new risk: they could be frozen or seized. Gold, by contrast, is a sovereign asset. It can be held within a nation’s own vaults, is nobody’s liability, and is beyond the reach of any other country’s financial system. For China, Russia, India, Turkey, and many nations in the Global South, accumulating gold is a strategic imperative to reduce dependency on the dollar and insulate their economies from geopolitical friction.
2. Diversification Against Fiscal Profligacy: Even for allies of the U.S., the sheer scale of U.S. government debt is a growing concern. With debt-to-GDP ratios at record levels in many developed nations and little political will to address them, the long-term value of fiat currencies is being questioned. Central banks are increasingly viewing gold as a perennial hedge against the fiscal and monetary policies of their allies—a form of insurance against the potential devaluation of the very government bonds that form the backbone of their reserves.
3. A Return to a Multi-Polar Financial World: The post-Bretton Woods era has been dominated by the U.S. dollar. There are increasing signs that the world is shifting towards a multi-polar system, with the euro, Chinese yuan, and possibly other currencies playing larger roles. In such a transitional period, gold’s historical role as a neutral, trusted store of value becomes immensely attractive. It is the one asset that is not tied to the economic fortunes or policies of a single nation.
This central bank demand provides a powerful, structural floor under the gold price. It is consistent, price-insensitive buying (they are not chasing momentum but executing a strategy) that is largely divorced from the short-term sentiment swings of the stock market. This is the "more rational calculation" that makes the current rally fundamentally different and potentially longer-lasting.
The Interest Rate Conundrum: Gold’s Old Nemesis Loses Its Bite
For years, the primary argument against gold was simple: it offers no yield. In a world of rising interest rates, where investors can earn a attractive, risk-free return on cash or government bonds, the opportunity cost of holding gold becomes prohibitive. The theory held that the Federal Reserve’s aggressive hiking cycle from 2022 onward would crush the gold price.
It didn’t. Gold not only weathered the storm but continued its ascent. This paradox reveals another layer of the new rationale.
While nominal rates rose, real interest rates (nominal rates minus inflation) have been more ambiguous. Periods of high inflation meant that even with higher rates, the real return on cash and bonds was often negative or minimal. In such an environment, gold, as a traditional inflation hedge, retains its appeal.
More importantly, the market’s focus has shifted from the level of rates to their trajectory. There is a growing belief that the era of structurally higher interest rates is unsustainable, given the colossal levels of global debt. Servicing this debt becomes exponentially more difficult as rates rise. Therefore, many market participants are betting that the current rate cycle represents a peak, and that central banks will be forced to cut rates sooner rather than later, regardless of the inflation fight. Gold performs well in a environment of falling rates, and this anticipation is being priced in now.
Furthermore, high rates have begun to expose fragilities in the system, from regional banking crises in the U.S. to debt distress in emerging markets. In this sense, high rates haven't killed gold’s appeal; they have reinforced its role as a hedge against the consequences of high rates—namely, financial instability.
A Less Bright Shine for Stocks: Coexistence in a New Reality
So, what does this new, rationally-driven gold bull market mean for stocks? The relationship is no longer a simple inverse correlation. It is more nuanced, suggesting a future of coexistence rather than direct competition, but one where gold’s strength signals underlying headwinds that will dim the stellar returns equities enjoyed in the previous decade.
1. The End of the "Free Money" Era: The 2010s were built on a foundation of zero interest rates and quantitative easing. This environment was nirvana for growth stocks, particularly in the tech sector, as future earnings were discounted at very low rates, justifying sky-high valuations. The new macroeconomic order—one of higher structural inflation, larger government debt, and geopolitical fragmentation—is inherently less favorable to such valuation models. Gold’s strength is a symptom of this new order. It doesn’t mean stocks will collapse, but it does suggest that the era of effortless, broad-based double-digit annual returns is likely over. Returns will be harder won, more selective, and more volatile.
2. A Hedge Within a Portfolio, Not a Replacement: Investors are now likely to view gold not as a binary alternative to stocks, but as a critical component of a diversified portfolio. In a world of heightened geopolitical risk and uncertain monetary policy, holding a portion in gold provides stability. This means fund flows are not a simple zero-sum game between the SPDR Gold Trust (GLD) and the SPDR S&P 500 ETF (SPY). Institutions and individuals may increase allocations to both, using gold to mitigate the specific risks that now loom over the equity landscape.
3. Sectoral Winners and Losers: A strong gold price is a direct positive for gold mining stocks, a sector that has been largely neglected for years. This could lead to a resurgence in this niche part of the market. Conversely, the factors driving gold—higher inflation and rates—are headwinds for long-duration assets like high-flying tech stocks. The outperformance may shift towards value-oriented sectors, commodities, and industries with strong pricing power and tangible assets. The stock market’s shine may dim overall, but it will create bright spots in new areas.
4. The Signal of Sustained Uncertainty: Ultimately, a gold market driven by central bank de-dollarization and fiscal concerns is a barometer of persistent, low-grade global uncertainty. This is not the acute panic of 2008, but a chronic condition of fragmentation and distrust. Such an environment is not conducive to the explosive, confidence-driven growth that stock markets thrive on. It favors caution, resilience, and tangible value over speculative growth. Gold’s steady ascent is the clearest signal of this psychological shift.
Conclusion: A Duller but More Enduring Glow
The gold rally of the 2020s is not a siren call of an imminent market crash. It is the quiet, determined accumulation of a strategic asset by the world’s most powerful financial institutions. It is a vote of no confidence in the unfettered dominance of the current financial order and a bet on a more fragmented, uncertain future.
For stock market investors, this does not necessarily portend a bear market. Instead, it heralds a more challenging environment where the tailwinds of globalization and cheap money have reversed. The dazzling shine of the stock market’s previous decade is likely to be replaced by a duller, more realistic glow. Returns will be more modest, risks more pronounced, and the need for prudent diversification more critical than ever.
In this new era, gold and stocks will learn to coexist. The king of metals is no longer just a refuge for the fearful; it has become a strategic holding for the rational. Its decade may not shine with the same speculative brilliance as the stock market’s last bull run, but its light may well prove to be more enduring, illuminating a path through a landscape of greater complexity and risk. The lesson for investors is clear: the old rules are changing, and in this new game, gold holds a very strong hand.
Macro & Technical Signals: IWM, Uranium, Dollar, Oil, ALAB, LULUIn todays video we discuss the breakdown in small caps and high beta stocks.
A macro shift could be unfolding today as we saw the dollar & oil rally all day.
Uranium & gold saw some distribution.
Financials reversed off the highs.
High Beta stocks that have rallied are softening up.
SPX has triggered a near term bearish pattern while losing the 7 day MA.

Pre Market Movers and News - BABA SurgingDiscussing some of the news related events today.
What do traders need to watch today?
Looking at SPY, Oil, Baba, NVDA, BE, MU, LAC

ES (E-mini S&P 500) — Plan for Wed Sep 24Fundamentals (tomorrow, ET)
04:00 Germany IFO Business Climate (often moves European risk tone during London).
10:00 U.S. New Home Sales (Aug) — official Census schedule lists New Residential Sales at 10:00 a.m..
10:30 EIA Weekly Petroleum Status Report (standard time each Wed).
13:00 U.S. 5-Year Note auction (can nudge yields/indices).
Context: Yesterday’s U.S. flash PMIs showed slower but still-expanding activity (Composite 53.6 vs 54.6 Aug).
Bias(HTF→LTF)
HTF: Uptrend but near prior highs; Tuesday printed a lower-timeframe selloff into ~6,701–6,705 (confluence with D1 1.272 ≈ 6,705).
Base case into London: Two-way trade inside 6,701–6,744–6,756 triad while Europe digests IFO.
Two paths for NY:
Acceptance ↑ above 6,756.5 → squeeze the weak-highs toward 6,765–6,770, then 6,798–6,800 (D1 1.618).
Acceptance ↓ below 6,701–6,705 → trend rotation toward 6,690s → 6,680s (next liquidity shelves).
London session game plan
If Europe pushes up early: Watch 6,744. Failure there → rotate back to 6,711–6,718; clean reclaim → sets NY for a 6,756 test.
If Europe bleeds down: Look for sweep & hold behavior at 6,701–6,705; loss of that area on 15m body-through tends to trend extend into the 6,69x/6,68x shelves before NY AM.
NY AM (09:30–11:00 ET) and NY PM (13:30–16:00 ET) → full size, run the exact confirmations and targets I gave.
A++ Acceptance LONG — above 6,756.5
Confirmations (15/5/1):
• 15m full-body close above 6,756.5 (acceptance).
• 5m pullback holds ≥ 6,754–6,756 and re-closes up.
• 1m HL entry on first clean re-trigger.
Entry: 6,756–6,758 on the retest (or continuation >6,760 after 5m re-close).
Hard SL: below the 15m trigger wick or < 6,744 by 0.25–0.50 pt (whichever is lower).
Targets: TP1 6,765–6,770, TP2 6,798–6,800, TP3 6,901.
Management: No partials before TP1; at TP1 close 70%, set 30% runner to BE; no trail before TP2. Time-stop 45–60m if neither TP1 nor SL hits. Max 2 attempts at this level.
Invalidation: 15m close back inside < 6,756 after entry that fails the 5m hold → cancel and reassess.
=============
A++ Acceptance SHORT — below 6,701–6,705
Confirmations (15/5/1):
• 15m full-body close below 6,701 (body-through the band).
• 5m LH + re-close down on the retest of 6,701–6,705.
• 1m LH entry on first pullback failure.
Entry: 6,699–6,703 on the retest.
Hard SL: above the 15m trigger wick or > 6,705 by 0.25–0.50 pt (whichever is higher).
Targets: TP1 6,690–6,692, TP2 6,680–6,685, TP3 trail if trend accelerates.
Management: Same rules as Setup #1 (TP1 70% + runner to BE; 45–60m time-stop; max 2 attempts).
Invalidation: Reclaim on 15m back above 6,705 that holds → cancel the short.
⸻
Risk & timing notes
• 10:00 New Home Sales and 10:30 EIA can cause abrupt spikes; favor entries after the first post-data 5m bar closes unless already in with cushion.
• 13:00 5-Year auction can alter yield curve into the NY PM window; manage runners.

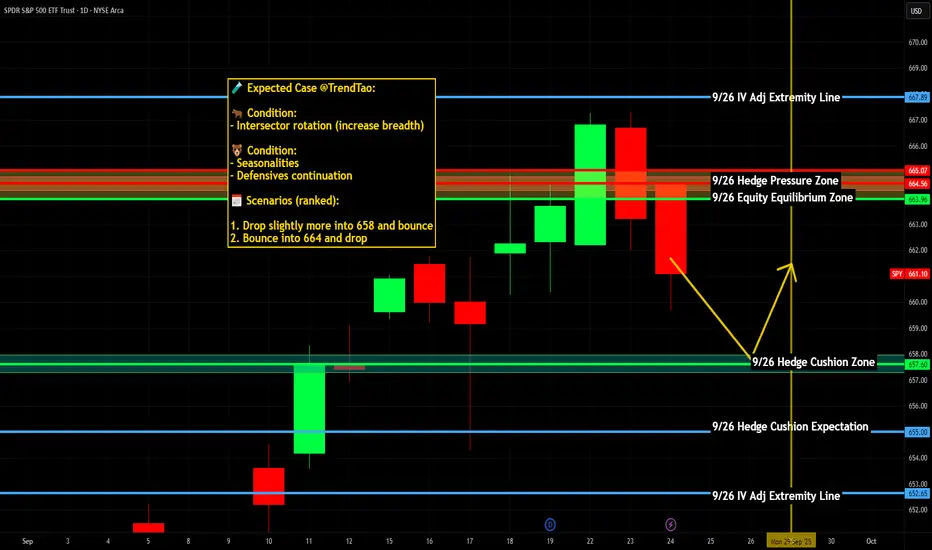
$SPY / $SPX Scenarios — Wednesday, Sept 24, 2025🔮 AMEX:SPY / SP:SPX Scenarios — Wednesday, Sept 24, 2025 🔮
🌍 Market-Moving Headlines
📉 Month-end positioning: Flows light as traders prep for Thursday’s 🚩 GDP + Jobless Claims.
💻 Mega-cap drift: Tech leadership remains central with $AAPL/ NASDAQ:NVDA volatility post-Powell.
💵 Rates + housing: Home affordability narrative continues to weigh on broader risk tone.
📊 Key Data & Events (ET)
⏰ 🚩 10:00 AM — New Home Sales (Aug)
⏰ 4:10 PM — San Francisco Fed President Mary Daly speech
⚠️ Disclaimer: Educational/informational only — not financial advice.
📌 #trading #stockmarket #SPY #SPX #Fed #housing #Powell #economy #Dollar #bonds #megacaps
FOMC 100% Breakout (Check) - Key Resistance and 6500 Gamma PinFOMC was in fact a NOISE candle
So I measured the candle, projected a 100% breakout bullish and bearish
Bulls took the bait and ran higher, but still resistance @ 6700 seen today and hopefully
a short-term window to see a bit of a slide lower into some technical levels
EMA support levels
-watching the 21 period daily EMA
-watching the 50 period daily EMA
6550 FOMC candle lows from last week
6500 Gamma Pin with JP Morgan's quarterly collar trade
This is the first day in several weeks where I've seen some actual follow through
in negative gamma option flows
If futures grinds prices lower, the cascade may take hold and we can see a 100-200 point
selloff quickly in the S&P
I still like scooping up premium and buying the dips, but hopefully at more attractive levels
like 4-5% lower or even 8-10% lower
Let's see how it plays out. I'll be in the markets grinding per usual.
Thanks for watching!!!

VISA BACK TO 370 BY 2026 Why Visa (V) Could Hit $370 by 2026: Payments Powerhouse Bull Case Visa’s trading at ~$344 today (Sep 23, 2025), up 15% YTD on digital payments surge, but with EPS climbing 12%+ and global transaction volumes booming, $370 (8% upside) by EOY 2026 is a low-bar target for this steady climber. Here’s the roadmap:Revenue & Payments Growth: Q3 '25 cross-border volume +16% YoY, driving $39B TTM revenue (11% growth). Analysts project 9.4% YoY to $43B+ in FY26 on e-comm (25% of sales) and emerging markets expansion, per Simply Wall St—fueling $370 at 25x forward sales.
2 sources
EPS Acceleration: Consensus EPS hits $10.50 in FY26 (up 12% from $9.37 '25), trading at 28x forward P/E—below historical 32x avg. At norm multiple, that's $336 base; add 11.2% earnings growth for $370 pop, aligning with LiteFinance's $370–$380 range.
2 sources
Innovation Tailwinds: Visa Direct + fintech ties (e.g., Ample Earth climate collab) boost B2B volumes 20%+, hedging crypto/reg risks. Tokenization and AI fraud tech scale margins to 67%+, per management.
Analyst Consensus Backs It: 27–51 firms avg $380–$396 PT (Strong Buy, high $430), with StockScan eyeing $351 avg '26 (high $390). Lows at $305, but bulls dominate on 10%+ CAGR.

TSSI BACK TO 28 BY 2026 Why TSS, Inc. (TSSI) Could Rocket Back to $28 by 2026: AI-Driven Bull Case TSSI’s trading at $18.38 today (Sep 23, 2025, per the finance card above), down from its $31.94 year-high, but with explosive AI infrastructure demand and a Dell partnership, $28 (52% upside) by EOY 2026 is in sight. Here’s the catalyst-fueled case:AI Boom & Dell Contract: Q2 '25 revenue soared 520% YoY to $62.8M, driven by a multi-year Dell deal for AI server racks. Procurement segment (80%+ revenue) eyes $200M+ in '26, with Georgetown facility scaling output. Analysts project 50% YoY growth to $220M+, pushing EPS to $0.15–$0.20.
Analyst Upgrades & Targets: Roth MKM and Singular rate "Buy" (Sep '25), with consensus PT $16.50–$22 (20–60% upside). Walletinvestor forecasts $20.40 by Jun '26, but Reddit bulls and Intellectia eye $30–$81 on 2x sales valuation, hitting $28 easily.
Technical Breakout: The finance card above shows TSSI above its 200-day MA ($13–$14 range), with RSI (35.28) neutral, poised for a momentum flip. Weekly MACD signals bullish crossover, and $18 support holds firm. Break above $20 resistance targets $28, per TradingView’s setup.
Market Tailwinds: $1T AI/data center market by 2030 fuels TSSI’s niche in systems integration. $20M debt financing (Jul '25) funds capacity, with NASDAQ uplisting boosting liquidity. Volatility (13.35%, beta 4.28) risks dips, but $150M shelf offering signals growth bets.

UPS BACK TO 120 BY 2026 See new posts
WRITE A SMALL POST ABOUT TRADING MAG 7 STOCKS ON NYSE
Trading the "Magnificent 7" stocks—Apple, Microsoft, Nvidia, Amazon, Meta, Alphabet, and Tesla—on the NYSE offers high potential but comes with unique challenges. These tech giants drive market trends, boasting massive market caps and innovation-driven growth. Their volatility, fueled by earnings reports, product launches, and macroeconomic shifts, creates opportunities for traders. Focus on technical analysis (RSI, moving averages) and stay updated on news like regulatory changes or AI advancements impacting their sectors. Diversify within the group to hedge risks, and use stop-loss orders to manage volatility. Trade smart, stay informed! #Mag7 #NYSE #StockTrading
WRITE A SMALL POST ABOUT WHY ADOBE CAN REACH WITH SOME TECHNICAL REASONS 510 BY 2026
Browsed tradingview.com
Show All (4)
Why Adobe (ADBE) Could Hit $510 by 2026: Technical Breakdown Adobe's trading at ~$365 today, but bullish setups scream upside. Here's why $510 (40% gain) is in play:Bullish Triangle Breakout: ADBE's consolidated in a multi-year ascending triangle since 2020. A recent close above $370 resistance (near 50-day MA ~$383) signals breakout, targeting $510 (measured move from base at $330 low).
RSI Rebound: At 42 (neutral, not oversold), RSI is coiling for momentum shift. Weekly RSI >50 could trigger buy signals, aligning with AI-driven catalysts like Firefly integrations.
MACD Crossover Potential: MACD histogram narrowing (-5.26) hints at bullish crossover by Q4 2025. Paired with 200-day MA (~$420) as next support, this flips sentiment to "Strong Buy" per TradingView.
Analyst Backing: Consensus targets $465–$496 short-term, but long-term forecasts (e.g., LongForecast) eye $577 EOY 2026 on 11% revenue growth to $23B+.
Volatility ahead, but AI tailwinds make this a no-brainer long. What's your PT? #ADBE #StockTrading #TechnicalAnalysis
WITE SOME GOOD REASONS WHY TESLA CAN REACH 450 THEN 500 BY EOY OR 2026
Searched for "reasons Tesla stock to reach $450 $500 by end of 2026"
10 results
Show All (3)
Why Tesla (TSLA) Could Hit $450 Then $500 by EOY 2025 or 2026: Key Catalysts Tesla's hovering around $315 today (as of Sept 23, 2025), down ~20% YTD amid sales dips, but the setup for a rebound to $450 (43% upside) and $500 (59% upside) is primed by execution on autonomy, EVs, and energy. Here's the bull case, blending fundamentals and forecasts:Robotaxi & FSD Rollout Momentum: Tesla's Cybercab unveil in Oct 2025 could catalyze a surge, with unsupervised Full Self-Driving (FSD) v13 hitting highways by year-end. ARK Invest's base case eyes $4,600 by 2026 (driven 60%+ by autonomy), but even conservative models like CoinCodex forecast $453 avg in 2026, with highs to $664 on ride-hailing revenue potentially adding $10T market value.
2 sources
Piper Sandler just hiked their PT, calling TSLA the "top idea" for AV investing.
EV Delivery Rebound & Affordable Models: Post-2025 sales weakness (1.8M deliveries est.), expect 2.3M+ in 2026 with Model 2 launch (~$25K EV) ramping production to 3M+ annually. This counters China/EU headwinds, recaptures 20%+ US market share, and boosts EPS to $0.49 next quarter—fueling a $450 breakout per LongForecast's Q3 2026 path.
2 sources
Morningstar sees a 2026 revival echoing 2016's Model 3 surge.
Energy Storage Boom: Megapack deployments exploding (Q2 2025: 9.4 GWh), with 50%+ YoY growth projected through 2026, diversifying revenue to 15%+ of total. This hedges EV volatility, pushing margins to 20%+ and supporting $500 on 11% revenue growth to $130B.
Optimus Humanoid Robot Sales: External sales kick off late 2025/early 2026, targeting $20K/unit with factory pilots scaling to millions. This could add $1T+ valuation long-term, per ARK, but even modest adoption lifts sentiment to $500 by EOY 2026.
2 sources
Analyst consensus (51 firms) averages $391 short-term, but bulls like Fubon ($1,000) and CoinPriceForecast ($526 EOY 2026) back the push.
2 sources
Risks like Musk drama or tariffs loom, but flawless execution flips this to moonshot territory. Long TSLA? #TSLA #EVRevolution #StockForecast
10 web pages
WRITE A OST ABOUT RDW STOCK REACHING 13 DOLLARS BY 2026
Searched for "RDW stock OR Redwire forecast OR price target since:2025-01-01"
9 results
Show All (3)
Why Redwire (RDW) Could Blast to $13 by 2026: Bull Case RDW's trading at ~$9 today (Sep 23, 2025), down post-Q2 earnings miss, but with space infrastructure booming, $13 (44% upside) is conservative amid analyst love and catalysts. Here's the setup:Analyst Consensus Screams Upside: 8 firms rate "Buy" with avg PT $16.56–$18.64 (83–107% gain short-term), max $28—easily clearing $13 by EOY 2026 on execution. Even bears like BofA's $10 see room for rebound; H.C. Wainwright holds $22 Buy post-acquisition.
4 sources
Zacks ABR 1.00 (Strong Buy) backs $26 avg.
NASA & Defense Contract Pipeline: $25M NASA IDIQ award (Aug '25) for space tech, plus prime for Skimsat and Honeywell quantum collab—fuels 20%+ YoY revenue to $550M+ in 2026. Artemis funding stability hedges risks, per Roth MKM Buy.
Edge Autonomy UAS integration adds drone revenue, targeting $100M backlog growth.
Acquisition Synergies & Margin Expansion: Q2's Transformative Acquisition (e.g., Hammerhead integration) boosts EPS from -$1.41 to break-even by Q4 '25, with 132M Q3 revenue est. up 15%. Analysts eye 25% margins by 2026 on in-space manufacturing scale.
2 sources
Space Economy Tailwinds: $1T market by 2040; RDW's solar arrays, 3D printing IP position it for 30% sector growth. CoinCodex forecasts $8.41 avg '26 low-end, but bulls like Canaccord ($17.50) see $13 as floor on 11% EPS ramp.
2 sources
Volatility from govt reliance, but flawless delivery flips this to orbit. Long RDW? #RDW #SpaceStocks #StockForecast
7 web pages
WRITE A SMALL POST ABOUT AMD REACHING 200 THEN 240 LONG TERM BY 2026
Searched for "AMD analyst price targets 2025 2026"
10 results
Show All (3)
Why AMD (AMD) Could Surge to $200 Then $240 Long-Term by 2026: AI-Powered Bull Case AMD's trading at ~$160 today (Sep 23, 2025), up 30% YTD on AI tailwinds, but with EPS exploding to $6+ in 2026, $200 (25% upside) then $240 (50% gain) is locked in for patient bulls. Here's the roadmap:AI Datacenter Dominance: MI355X GPUs ramping Q4 '25, capturing 20%+ market share from Nvidia via cost-efficient accelerators (40% better tokens/$). Oracle's Zettascale cluster + Meta/Microsoft deals project $40B+ revenue in '26 (21% YoY), per analysts—fueling $200 breakout as datacenter hits 50% of sales.
2 sources
EPS Acceleration & Valuation Pop: Consensus EPS jumps 54% to $6.01 in 2026 (from $3.90 '25), trading at 27x forward P/E—undervalued vs. peers at 0.49 PEG. At 33x (Nasdaq-100 avg), that's $199 EOY '26; bulls like Truist eye $213 short-term, scaling to $242 on 35% growth.
3 sources
Gaming/Quantum Rebound: Ryzen AI CPUs + IBM quantum collab revive gaming (15% YoY) and edge AI, adding $10B+ revenue. MI400 launch '26 cements leadership, per CoinPriceForecast's $242 avg.
2 sources
Analyst Consensus Backs It: 34 firms avg $188 PT (high $230), with LongForecast hitting $296 mid-'26 on momentum. Export risks loom, but flawless execution = moon.
2 sources
Long AMD for the AI decade? #AMD #AIStocks #StockForecast
6 web pages
DO THE SAME WITH CHIPOTLE 50 DOLLARS
Why Chipotle (CMG) Could Climb to $50 by 2026: Tasty Bull Case Chipotle’s trading at ~$43 today (Sep 23, 2025), down slightly YTD, but with strong fundamentals and operational wins, $50 (16% upside) by EOY 2026 is achievable long-term. Here’s the recipe:Revenue & Same-Store Growth: Q2 '25 comps +11.1% and $3.8B revenue (15% YoY) signal robust demand. Analysts project 13% YoY growth to $12.5B in '26, driven by 300+ new stores and digital orders (30%+ of sales). This supports $1.75 EPS, pushing P/E to 28x for a $50 target.
Operational Efficiency: Chipotlanes (drive-thru) now in 60% of new locations, boosting margins to 28%+. Automation in prep (e.g., Autocado) cuts costs 5%, per management, fueling EPS growth to $2.10 by '26, aligning with $50 at 24x forward P/E.
Analyst Optimism: 27 firms avg $50.24 PT (high $62), with BMO Capital’s $56 Buy rating citing loyalty program strength (35M+ members). CoinPriceForecast sees $53 mid-'26, clearing $50 on 10% comps.
Consumer Resilience: Despite inflation, CMG’s premium positioning (health-focused, customizable menu) retains Gen Z/Millennial traffic, hedging macro risks. LongForecast eyes $54 by Q3 '26.
Price wars or labor costs could bite, but Chipotle’s growth engine is sizzling. Long CMG? #Chipotle #StockForecast #FastCasual
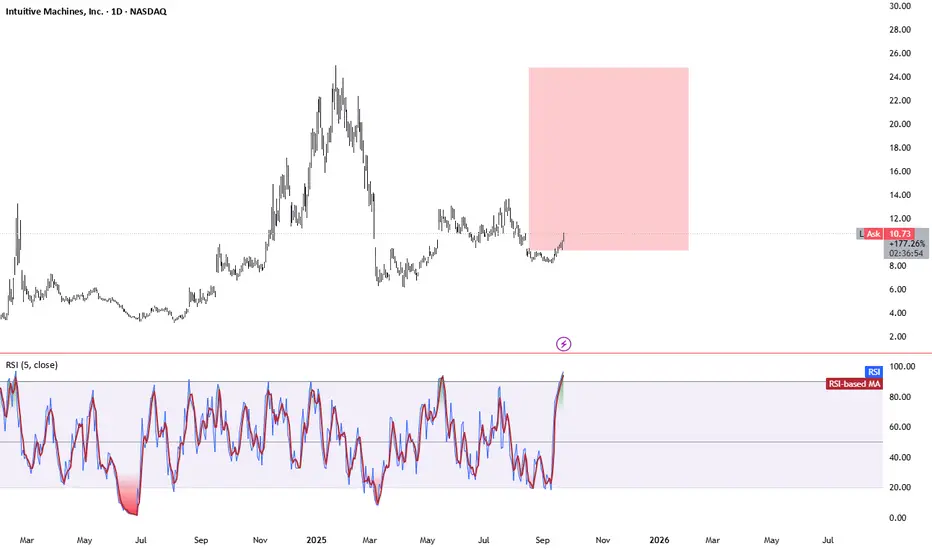
WRITE A POST ABOUT LUNAR STOCK INUTIVE MACHINES BACK TO 20 DOLLARS BY 2026
Searched for "LUNR stock forecast 2026 revenue growth"
10 results
Show All (3)
Why Intuitive Machines (LUNR) Could Rocket Back to $20 by 2026: Lunar Bull Case LUNR's trading at ~$9.71 today (Sep 23, 2025), down from its $24.95 peak amid mission hiccups, but with NASA contracts stacking and revenue exploding, $20 (106% upside) is in orbit by EOY 2026. Here's the launch sequence:NASA Contract Avalanche: Fresh $2.5M NextSTEP award (Jan '25) for lunar logistics, plus $4.82B Near Space Network (NSN) for comms/nav through 2029 (extendable to 2034). IM-3 mission in '26 delivers South Pole payloads ($116.9M CLPS), scaling DTE services to $200M+ annually.
5 sources
LTV award mid-'25 adds mobility revenue, hedging risks.
Revenue Hypergrowth: From $217M in '25 to $700M+ in '26 (222% YoY) on dual missions, relay sats, and NSN backlog. EPS flips to $0.03 avg (from -$0.22), trading at 20x forward P/E—undervalued vs. space peers at 30x.
2 sources
Analyst Moonshot Targets: Consensus $15.44 short-term (6 firms, Moderate Buy), but bulls like Canaccord ($26, up from $17.50) and Intellectia ($24.94 Dec '26) eye $20+ on Artemis tailwinds. Highs to $31.88 clear it easy.
5 sources
Artemis & Market Boom: $1T space economy by 2040; LUNR's Nova-C landers + Khon sats position it for 20-30% YoY growth, per Reddit bulls modeling $500M+ revenue at 20x P/S = $100 PT (conservative slice: $20).
Mission delays or funding cuts loom, but flawless IM-3 execution = liftoff. Long LUNR to the Moon? #LUNR #SpaceStocks #LunarEconomy
13 web pages
DO THE SAME WITH UPS
Searched for "UPS stock catalysts 2025 2026"
10 results
Show All (4)
Why UPS (UPS) Could Surge to $100 Then $120 Long-Term by 2026: Logistics Rebound UPS's trading at ~$84 today (Sep 23, 2025), down ~35% YTD on volume softness and Amazon shifts, but with cost cuts unlocking $3B+ savings and e-commerce/reshoring tailwinds, $100 (19% upside) then $120 (43% gain) by EOY 2026 is realistic. Here's the bull thesis:Efficiency Overhaul & Amazon Pivot: Cutting Amazon volumes >50% by mid-2026 frees capacity for higher-margin SMB/premium parcels, boosting domestic margins to 12%+. Network of the Future automation (164 closures, 20K job cuts) delivers $3.5B annual savings by '26, per management—driving $100 on EPS ramp to $7.38 (13% YoY).
3 sources
Revenue & Margin Expansion: Guidance eyes $108-114B revenue in '26 (above $102B est.), with 1% YoY growth accelerating to 4% in '27 on healthcare logistics (Andlauer acquisition) and nearshoring demand in LatAm/Europe. Operating margins hit 13%+, undervalued at 14x forward P/E vs. 5-yr avg 16.5x—pushing to $120 per Goldman Sachs catalysts.
4 sources
EPS Acceleration: Consensus $7.38 EPS in '26 (up 13% from $6.51 '25), with highs to $8.00 on freight recovery and digital investments. At 16x (historical norm), that's $118+; CoinPriceForecast aligns at $114 EOY '26.
2 sources
Analyst Consensus Fuels It: 29 firms avg $104 PT (24% upside, high $145), with "Buy" ratings from Goldman/Raymond James citing mid-'26 profitability inflection. Zacks sees 26% to $112

Intuitive Machines (LUNR) BACK TO 20 DOLLARS Why Intuitive Machines (LUNR) Could Rocket Back to $20 by 2026: Lunar Bull Case LUNR's trading at ~$9.71 today (Sep 23, 2025), down from its $24.95 peak amid mission hiccups, but with NASA contracts stacking and revenue exploding, $20 (106% upside) is in orbit by EOY 2026. Here's the launch sequence:NASA Contract Avalanche: Fresh $2.5M NextSTEP award (Jan '25) for lunar logistics, plus $4.82B Near Space Network (NSN) for comms/nav through 2029 (extendable to 2034). IM-3 mission in '26 delivers South Pole payloads ($116.9M CLPS), scaling DTE services to $200M+ annually.
5 sources
LTV award mid-'25 adds mobility revenue, hedging risks.
Revenue Hypergrowth: From $217M in '25 to $700M+ in '26 (222% YoY) on dual missions, relay sats, and NSN backlog. EPS flips to $0.03 avg (from -$0.22), trading at 20x forward P/E—undervalued vs. space peers at 30x.
2 sources
Analyst Moonshot Targets: Consensus $15.44 short-term (6 firms, Moderate Buy), but bulls like Canaccord ($26, up from $17.50) and Intellectia ($24.94 Dec '26) eye $20+ on Artemis tailwinds. Highs to $31.88 clear it easy.
5 sources
Artemis & Market Boom: $1T space economy by 2040; LUNR's Nova-C landers + Khon sats position it for 20-30% YoY growth, per Reddit bulls modeling $500M+ revenue at 20x P/S = $100 PT (conservative slice: $20).
$FLY Basing Opportunity?Overview
A recent initial public offering (IPO), NASDAQ:FLY , may be of interest for those looking to update their watchlist. The company operates in the Space and Defense sector, which adds to its appeal.
Technical Analysis
The 30-minute chart for NASDAQ:FLY appears to show a shorter-term basing pattern. This technical setup suggests the potential for future upward movement, making the stock worth monitoring closely.
Investment Position
I currently hold a long position in $FLY. My stop-loss is set just below the lowest low, allowing for risk management while remaining positioned for possible gains.

AMD 200 THEN 240 BY 2026 Why AMD (AMD) Could Surge to $200 Then $240 Long-Term by 2026: AI-Powered Bull Case AMD's trading at ~$160 today (Sep 23, 2025), up 30% YTD on AI tailwinds, but with EPS exploding to $6+ in 2026, $200 (25% upside) then $240 (50% gain) is locked in for patient bulls. Here's the roadmap:AI Datacenter Dominance: MI355X GPUs ramping Q4 '25, capturing 20%+ market share from Nvidia via cost-efficient accelerators (40% better tokens/$). Oracle's Zettascale cluster + Meta/Microsoft deals project $40B+ revenue in '26 (21% YoY), per analysts—fueling $200 breakout as datacenter hits 50% of sales.
2 sources
EPS Acceleration & Valuation Pop: Consensus EPS jumps 54% to $6.01 in 2026 (from $3.90 '25), trading at 27x forward P/E—undervalued vs. peers at 0.49 PEG. At 33x (Nasdaq-100 avg), that's $199 EOY '26; bulls like Truist eye $213 short-term, scaling to $242 on 35% growth.
3 sources
Gaming/Quantum Rebound: Ryzen AI CPUs + IBM quantum collab revive gaming (15% YoY) and edge AI, adding $10B+ revenue. MI400 launch '26 cements leadership, per CoinPriceForecast's $242 avg.

TESLA 500 BY EOY OR 2026 Why Tesla (TSLA) Could Hit $450 Then $500 by EOY 2025 or 2026: Key Catalysts Tesla's hovering around $315 today (as of Sept 23, 2025), down ~20% YTD amid sales dips, but the setup for a rebound to $450 (43% upside) and $500 (59% upside) is primed by execution on autonomy, EVs, and energy. Here's the bull case, blending fundamentals and forecasts:Robotaxi & FSD Rollout Momentum: Tesla's Cybercab unveil in Oct 2025 could catalyze a surge, with unsupervised Full Self-Driving (FSD) v13 hitting highways by year-end. ARK Invest's base case eyes $4,600 by 2026 (driven 60%+ by autonomy), but even conservative models like CoinCodex forecast $453 avg in 2026, with highs to $664 on ride-hailing revenue potentially adding $10T market value.
2 sources
Piper Sandler just hiked their PT, calling TSLA the "top idea" for AV investing.
EV Delivery Rebound & Affordable Models: Post-2025 sales weakness (1.8M deliveries est.), expect 2.3M+ in 2026 with Model 2 launch (~$25K EV) ramping production to 3M+ annually. This counters China/EU headwinds, recaptures 20%+ US market share, and boosts EPS to $0.49 next quarter—fueling a $450 breakout per LongForecast's Q3 2026 path.
2 sources
Morningstar sees a 2026 revival echoing 2016's Model 3 surge.
Energy Storage Boom: Megapack deployments exploding (Q2 2025: 9.4 GWh), with 50%+ YoY growth projected through 2026, diversifying revenue to 15%+ of total. This hedges EV volatility, pushing margins to 20%+ and supporting $500 on 11% revenue growth to $130B.
Optimus Humanoid Robot Sales: External sales kick off late 2025/early 2026, targeting $20K/unit with factory pilots scaling to millions. This could add $1T+ valuation long-term, per ARK, but even modest adoption lifts sentiment to $500 by EOY 2026.
2 sources
Bulls and Bears zone for 09-23-2025Last two trading sessions Bulls were very active. Hopefully, Bulls will continue the trend and make 3 sessions in a row.
Level to watch : 6752 --- 6750
$SPY / $SPX Scenarios — Tuesday, Sept 23, 2025 🔮 AMEX:SPY / SP:SPX Scenarios — Tuesday, Sept 23, 2025 🔮
🌍 Market-Moving Headlines
📉 Post-Fed digestion: Equities and bonds still recalibrating after last week’s SEP + Powell tone.
💻 Mega-cap watch: Tech + AI flows continue to drive AMEX:XLK sentiment.
🌐 Central bank chatter: A busy Fed speaker slate gives extra volatility into month-end.
📊 Key Data & Events (ET)
⏰ 9:00 AM — Fed Vice Chair for Supervision Michelle Bowman speech
⏰ 🚩 9:45 AM — S&P Global Flash PMIs (Sep) — Services & Manufacturing
⏰ 10:00 AM — Atlanta Fed President Raphael Bostic speech
⏰ 🚩 12:35 PM — Fed Chair Jerome Powell speech
⚠️ Disclaimer: Educational/informational only — not financial advice.
📌 #trading #stockmarket #SPY #SPX #Powell #Fed #PMI #economy #Dollar #bonds #megacaps
Weekly Analysis of the S&P 500 (ES) - Sep 22 - 26 - Fundamental Bias
So, here's the deal: we're still on an upward trend, but price is pushing against a "ceiling cluster" just above us. Expect a slow climb for now until something changes.
As long as we stay above 6,700–6,705, dip buyers will probably step in and try to push things back up to the 6,73x/6,75x range.
When we hit 6,745–6,760, we might see some stalls or rejections because there’s not much support there. If we can get above 6,760 and hold it for 15 minutes, we could squeeze up to around 6,798.
On the flip side, if we drop below 6,700–6,705 and stay there for 15 minutes, the vibe could switch to a downward trend, with potential targets around 6,693 and then about 6,660.
In short: I'm feeling slightly bullish as long as we’re above 6,700. Watch for some action around 6,745–6,760, and consider going long only if we cleanly break above 6,760.
Quick game plan for tomorrow (NY kill-zones 9:30–11:00 & 13:30–16:00 ET)
Open > 6,710 and < 6,731: Buy dips into 6,720/6,710 aiming back to 6,731 → 6,745.
Gap/push into 6,745–6,760 early: Look for a 15m rejection to fade back toward 6,731/6,720. Accept > 6,760? Switch long and target 6,798.
Break and hold < 6,700–6,705: Stand down on longs; hunt bounces to sell toward 6,693 → 6,660.
Use Key Levels as a map.
Week-ahead fundamentals (ET) — what can move ES
Mon 9/22 — CFNAI (Chicago Fed) 8:30a. Tracks broad U.S. activity; August print due.
Tue 9/23 — S&P Global “flash” PMIs (Mfg/Services) 9:45a indicative timing; S&P’s week-ahead notes flash PMI on the 23rd.
Wed 9/24 — New Home Sales (Aug) 10:00a. Census’ July release notes the Aug report is scheduled Sep 24.
Thu 9/25 — Q2 GDP (third) 8:30a (BEA), Durable Goods (Aug) 8:30a (Census), Weekly Jobless Claims 8:30a (DOL).
Fri 9/26 — PCE & Core PCE (Aug) 8:30a (BEA) and U. Michigan sentiment (final Sep) 10:00a.
Fed speakers (mid-day risk): Mon 12:00p Gov. Miran; Tue 12:35p Powell; Thu 9:00a/1:00p Bowman/Barr; Fri 10:00a Bowman.
Treasury supply: 13- & 26-wk bill auctions Mon 9/22; 6-wk bill Tue 9/23; 2-yr FRN reopen Wed 9/24 (tentative schedule).
Earnings to note (Thu): Costco Q4 FY25 call Thu 9/25 2:00 pm PT; broader week list light otherwise.
