Nightly $SPY / $SPX Scenarios for July 1, 2025 🔮 Nightly AMEX:SPY / SP:SPX Scenarios for July 1, 2025 🔮
🌍 Market-Moving News 🌍
📊 Core Inflation Edges Higher
May’s core inflation rose unexpectedly to 2.7% year-over-year, up from 2.6%, casting uncertainty over the Fed’s timeline for rate cuts. While headline CPI sits at 2.3%, the resilience in underlying prices complicates policymakers’ projections for later this year
💵 Weak Dollar, Rising Rate-Cut Bets
Markets are reacting to “summertime data”—like the core CPI uptick—with renewed optimism. Traders now see up to 75 bps in Fed rate cuts later this year, while the dollar remains near 3½-year lows on concerns about Powell’s independence and trade developments
🇨🇦 U.S.–Canada Trade Talks Resume
Trade talks between the U.S. and Canada restarted today, following Ottawa’s suspension of its digital-services tax. Progress toward a broader agreement could reduce tariff risk and offer further relief to risk assets
📊 Key Data Releases & Events 📊
📅 Tuesday, July 1:
All Day – U.S.–Canada Trade Talks
Markets will watch for updates on tariff resolution and broader trade deals. Any breakthrough could notably boost equities and improve trade sentiment.
10:00 AM ET – ISM Manufacturing PMI (June)
A below-50 reading again would reinforce the narrative of industrial weakness. A rebound could support equities and temper recession concerns
10:00 AM ET – JOLTS Job Openings (May)
Still at elevated levels (~7.39 million in April), this metric assesses labor-market resilience. A decline could shift rate-cut expectations.
⚠️ Disclaimer:
This is for educational and informational purposes only. It does not constitute financial advice. Consult a licensed financial advisor before investing.
📌 #trading #stockmarket #economy #news #trendtao #charting #technicalanalysis
SPDR S&P 500 ETF (SPY)

06/30/25 Trade Journal, and ES_F Stock Market analysis
EOD accountability report: +212
Sleep: 7 hours
Overall health: Good, caught up on workout and sleep over the weekend.
** VX Algo System Signals from (9:30am to 2pm) 2/4 success**
— 12:20 PM VXAlgo NQ X1 Sell Signal :x:
— 12:30 PM Market Structure flipped bullish on VX Algo X3!:check:
— 1:55 PM VXAlgo NQ X1 Buy Signal :x:
— 2:00 PM Market Structure flipped bearish on VX Algo X3! :check:
**What’s are some news or takeaway from today?
and What major news or event impacted the market today?
**
The X1 Signals today has been happening after market structure signals and usally that means MM is going to change the direction to the opposite way to scam us. Based on that, I decided to lock out my account after making $200 today so i don't get caught in the scam.
News
EU TO ACCEPT TRUMP’S UNIVERSAL TARIFF BUT SEEKS KEY EXEMPTIONS — 2:07 PM
What are the critical support levels to watch?
--> Above 6240= Bullish, Under 6210= Bearish
Video Recaps -->https://www.tradingview.com/u/WallSt007/#published-charts

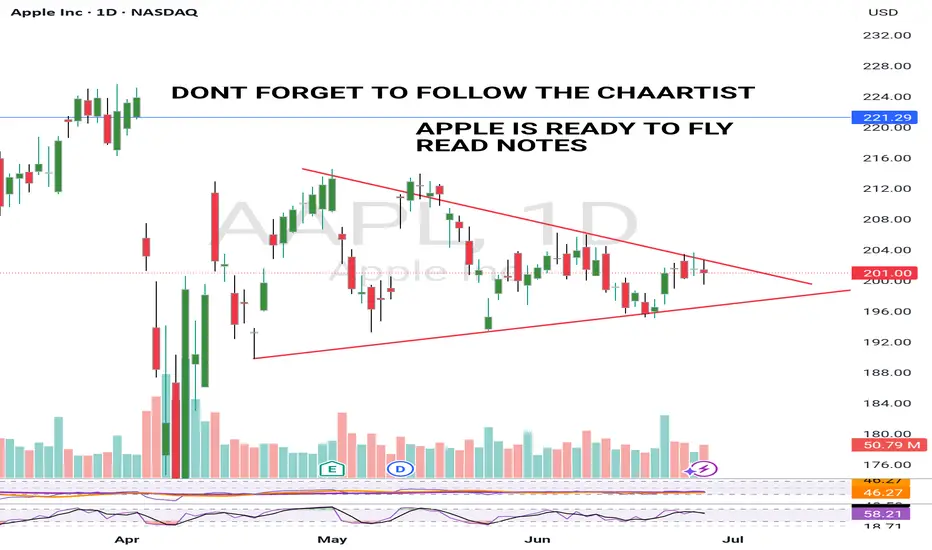
$AAPL In ConsolidationNASDAQ:AAPL is consolidating here in a wedging pattern. I do not know which way this will resolve. But, since I rarely if ever short, I am looking on the long side of a trade. The thing I like about a consolidation pattern like this is, you know when you are wrong very quickly. My plan is to take a ¼ size long position if / when it moves above the 50 DMA (red) with a stop just below the most recent low (which would also correspond to dropping below the lower wedging trendline.
Then if it can break out over the upper downtrend line, I will look to build out my position. I thought this would be a good one to put on your watchlist. If you like the idea, please make it your own so that it fits within your trading plan.

SPY Technical Analysis! SELL!
My dear followers,
I analysed this chart on SPY and concluded the following:
The market is trading on 614.85 pivot level.
Bias - Bearish
Technical Indicators: Both Super Trend & Pivot HL indicate a highly probable Bearish continuation.
Target - 586.37
Safe Stop Loss - 631.68
About Used Indicators:
A super-trend indicator is plotted on either above or below the closing price to signal a buy or sell. The indicator changes color, based on whether or not you should be buying. If the super-trend indicator moves below the closing price, the indicator turns green, and it signals an entry point or points to buy.
Disclosure: I am part of Trade Nation's Influencer program and receive a monthly fee for using their TradingView charts in my analysis.
———————————
WISH YOU ALL LUCK

Stock Market Forecast | TSLA NVDA AAPL AMZN META MSFTStock Market Forecast | CME_MINI:NQ1! CME_MINI:ES1! QQQ SPY
Mag 7 Forecast | CBOE:MAGS NASDAQ:TSLA NVDA AAPL AMZN META MSFT

SPY: Bearish Continuation is Expected! Here is Why:
Looking at the chart of SPY right now we are seeing some interesting price action on the lower timeframes. Thus a local move down seems to be quite likely.
Disclosure: I am part of Trade Nation's Influencer program and receive a monthly fee for using their TradingView charts in my analysis.
❤️ Please, support our work with like & comment! ❤️

06/27/25 Trade Journal, and ES_F Stock Market analysis 06/27/25 Trade Journal, and ES_F Stock Market analysis
EOD accountability report: +915
Sleep: 6 hours
Overall health: edgy from sleep
** VX Algo System Signals from (9:30am to 2pm) 3/4 success**
9:37 AM VXAlgo ES X1 Buy signal :check:
9:55 AM Market Structure flipped bullish on VX Algo X3! :check:
10:31 AM VXAlgo ES X1 Sell Signal (double sell) iffy
1:43 PM Market Structure flipped bearish on VX Algo X3! :check:
**What’s are some news or takeaway from today?
and What major news or event impacted the market today?
**
Early on in the market, I noticed that there was heavy manipulate by the MM with violent buy and sell. This somewhat warns that today's market could be tough to trade and you have to be very patient.
News
PRES TRUMP: ENDING ALL TRADE TALKS WITH CANADA; WILL TELL CANADA ITS TARIFF LEVEL IN COMING DAYS - around 1 :40pm est
What are the critical support levels to watch?
--> Above 6200= Bullish, Under 6185= Bearish
Video Recaps -->https://www.tradingview.com/u/WallSt007/#published-charts

Beating the S&P 500 with TradingView's Stock ScreenerThis is Mo from MWRIGHT TRADING. The date is Friday, June 27th, 2025.
This video is about selecting stocks that collectively have the potential to consistently beat the S&P 500
I look for smooth and consistent long-, mid-, and short-term performance. For that we need
Building a Screener
What I look for
- Liquidity - that means money, or trading volume.
- Room to move - no overhead resistance
- Favorable trends - stable moving averages
- Good short term signals - a good intraday chart
Filters
- Market Cap 300M to 2B
Not too big, and not too small
- Perf 10Y > Perf 5Y
No long term dips in performance
- Perf 5Y > Perf 1Y
No short term dips in performance
- SMA(300) < Price
Price above moving average
- SMA(200) < Price
Price above moving average
- Avg Volume 10D > 100K
No lightly traded stocks. Liquidity needed
- + SMA(200) >= SMA(300)
Stacked long-term SMAs
- + SMA(50 >= SMA(200)
Stacked short-term SMAs
- + ROE, Trailing 12 Months > 0% (Chris Mayer)
Improving ROE
Examples
- SENEA
- DGII
Review the charts
- Verify short term performance
- Multi-VWAP (1 hr Chart) - Free Indicator
- Above a rising 5-Day AVWAP
- Magic Order Blocks (5 min Chart) - Free Indicator
- No major overhead resistance
- Verify fundamentals and long term performance
- ROE (Quarterly) - TV Indicator
- Rising ROE
- Float Shares Outstanding - TV Indicator
- Lower float means lower supply. When high demand occurs, this can act as a price catalyst.
- Multi VWAP from Gaps - Free Indicator
- Stacked is good
- 3 SMA Ladies - Custom Indicator
- Stacked is good

Nasdaq Hits New ATH at $22,570 – Eyes Now on $23,200 and $24,000By analyzing the #Nasdaq chart on the weekly timeframe, we can see that the index followed our previous analysis perfectly, hitting the $22,400 target and printing a new all-time high at $22,570!
Momentum remains strong and bullish, and we expect price to continue climbing toward the next targets. Based on the original projection, upcoming targets are $23,200 and $24,000.
Stay tuned for the next update!
Please support me with your likes and comments to motivate me to share more analysis with you and share your opinion about the possible trend of this chart with me !
Best Regards , Arman Shaban

June 27th, 2025 - Morning BriefFriday, June 27, 2025. Markets are on the edge, and if you thought summer would bring calm, think again. Today’s script is pure adrenaline.
Overnight, the U.S. and China finally inked a trade deal that actually matters: tariffs are coming down, and rare earths are flowing again. Tech and manufacturing stocks are already celebrating, with SP:SPX and CME_MINI:NQ1! futures inching toward fresh record highs. NASDAQ:NVDA is still the market’s favorite lottery ticket, hitting another all-time high. Meanwhile, NYSE:NKE just spiked 10% premarket after beating earnings. Never mind the $1 billion tariff punch, they’ll “manage it.” Sure.
But the real show is the May PCE inflation data dropping this morning. The Fed’s favorite gauge is expected to tick up to 2.3% year-over-year, with core PCE at 2.6%. If the numbers surprise, brace for whiplash in rates and risk assets. GDP’s third estimate confirmed a -0.5% contraction in Q1, so the “soft landing” crowd is sweating. Jobless claims and new home sales hit at 10:00 AM ET. Expect every algo on the Street to be watching.
Trump is making noise about firing Powell before 2026, which has traders betting on earlier rate cuts. If you’re looking for stability, you’re in the wrong casino.
Here’s where things stand:
- OANDA:XAUUSD : $3,280–$3,334/oz (slipping as risk appetite returns)
- BLACKBULL:WTI : $65.64–$65.82/barrel (steady, but one headline away from chaos)
- BINANCE:BTCUSDT : $107,215–$107,477 (down, but still a six-figure fever dream)
- CME_MINI:ES1! : Hovering just below the 6,144 record
Today’s takeaway: The market’s running on hope, caffeine, and denial. Stay sharp, one bad print and the rally could turn into a stampede for the exits. Welcome to the volatility vortex.
Been building something for US swing traders — if you’re one, I’d really appreciate your feedback. Free to test, link in Bio

APPLE BULLISH 26 JUNE 2025Apple looks ready to breakout.It is really well squeezed now and ready to form a Green candle.
Breakout is an expectation so dont trade blindly.
I will upload video analysis Asap.
I am bullish and my price target is a minimum $220 from here.
NOTE: RISK MANAGEMENT IS A MUST
Nightly $SPY / $SPX Scenarios for June 27, 2025🔮 Nightly AMEX:SPY / SP:SPX Scenarios for June 27, 2025 🔮
🌍 Market-Moving News 🌍
📉 Global Markets Bet on Dovish Fed Pivot
Markets are pricing in more aggressive Federal Reserve rate cuts—approximately 125 bps by end-2026—due to speculation that President Trump may replace Chair Powell with a dovish successor. Investors caution excessive political influence could jeopardize Fed independence
🏦 Fed Governor Warns of Tariff Risks
Fed’s Michael Barr emphasized that tariffs could trigger inflation and unemployment, reinforcing the Fed’s wait‑and‑see approach. Expect modest rate cuts later this year, contingent on economic signals
📉 Q1 GDP Revised Sharply Lower
First-quarter U.S. GDP was downgraded to an annualized contraction of 0.5%, a deeper fall than previously reported. The revision underscores drag from weak consumer spending and trade disruptions
📃 Trade Deficit Widens in May
U.S. goods trade deficit expanded 11% to $96.6 billion, driven by a $9.7 billion drop in exports. Trade gap dynamics remain a headwind for growth projections
🐘 JPMorgan Sees Stagflation Risks
JPMorgan revised its U.S. GDP growth forecast down to 1.3%, warning that tariff-related “stagflationary impulse” is complicating growth and inflation outlooks—and making recession risks more real
📊 Key Data Releases 📊
📅 Friday, June 27:
8:30 AM ET – U. of Michigan Consumer Sentiment – June (Prelim.)
Expected to reflect growing economic caution. The index fell in May; traders will watch for further weakness.
10:00 AM ET – Fed Stress Test Results
Fed to release annual bank stress-test outcomes. Strong results support financial stability, while weak spots could unsettle markets
⚠️ Disclaimer:
This information is for educational and informational purposes only and should not be construed as financial advice. Always consult a licensed financial advisor before making investment decisions.
📌 #trading #stockmarket #economy #Fed #inflation #macro #charting #technicalanalysis

06/26/25 Trade Journal, and ES_F Stock Market analysis 06/26/25 Trade Journal, and ES_F Stock Market analysis
EOD accountability report: +731.25
Sleep: 5 hours
Overall health: meh
** VX Algo System Signals from (9:30am to 2pm) 3/3 success**
— 9:38 AM Market Structure flipped bullish on VX Algo X3
— 10:30 AM Market Structure flipped bullish on VX Algo X3!
— 11:27 AM VXAlgo ES X1 Sell Signal
What’s are some news or takeaway from today?
and What major news or event impacted the market today?
today was another interesting day, i am noticing that when market structure changes 2x in the same direction, it is usally pretty effective and scammy at the same time
News
*NVIDIA NASDAQ:NVDA SHARES HIT A NEW HIGH TO RECLAIM WORLD'S LARGEST STOCK TITLE - market is being carried by the momentum of mag 7
What are the critical support levels to watch?
--> Above 6175 = Bullish, Under 6155= Bearish
Video Recaps -->https://www.tradingview.com/u/WallSt007/#published-charts


SP500 short USD is losing its reserve currency status but I guess it is also loosing its measuring cup status as well.
While people are cheering for all time highs in USD, SP500 in CHF does not look good at all.

Nightly $SPY / $SPX Scenarios for June 26, 2025🔮 Nightly AMEX:SPY / SP:SPX Scenarios for June 26, 2025 🔮
🌍 Market-Moving News 🌍
💱 Dollar Mounts Decline on Fed Credibility Concerns
The U.S. dollar dropped to a 3½-year low against the euro after reports that President Trump is considering replacing Fed Chair Powell as early as September or October. The move fueled market concern about the Fed’s independence and prompted traders to raise the likelihood of a July rate cut to 25%, with nearly 64 bps of rate cuts priced in by year-end
📉 Markets Stay Cautious Ahead of Powell’s Testimony
Traders remain on edge as Fed Chair Powell’s Capitol Hill testimony continues. He reiterated caution, noting inflation risks tied to tariffs despite growing calls for easing, keeping interest-rate expectations in limbo .
📈 S&P 500 Nears All-Time Highs in Second-Biggest Bi‑Monthly Rally
The S&P 500 has notched its second-largest May–June rally on record (6.2% in May, further gains in June), bolstered by cooling inflation, easing Middle East tensions, and strong AI earnings momentum led by Nvidia. Bull-case scenarios could push the index to fresh highs
📊 Key Data Releases 📊
📅 Thursday, June 26:
(No major U.S. economic release—markets are focused on Powell’s remaining testimony and global risk dynamics.)
⚠️ Disclaimer:
This information is for educational and informational purposes only and should not be construed as financial advice. Always consult a licensed financial advisor before making investment decisions.
📌 #trading #stockmarket #economy #Fed #inflation #geopolitics #technicalanalysis

TSLA PRICE ACTION JUNE 25 2025This is the price action for Tesla. I have discussed all the levels. I have given a trade today & have discussed it thoroughly.
If you have any doubts, then feel free to Dm me or leave a comment below
NOTE:DO NOT BUY CALLS

Nasdaq All-Time Highs, S&P Close, Blast Off or Breakdown?What an incredible melt-up since April 7 lows in the US markets.
Trump vs Musk - ignored
Iran vs Israel - ignored
High Valuations - ignored
FED Pausing - ignored
The US economy is resilient and it's a good thing because the world is performing really well (EX-US). Europe/China/India/Emerging Markets are outperforming the US by 15-16% YTD
The USD is having one its worst years ever in 2025
Gold, Silver, Bitcoin are great diversifiers in my opinion for 2025
Oil prices are incredibly volatile and energy stocks and commodities in turn are showing
volatility and big swings
As we near end of month and end of Q2, I have to believe the market is due for a small pause or pullback sooner rather than later - but we'll see
Thanks for watching!!!

SPY/QQQ Plan Your Trade for 6-25 : Breakaway PatternToday's Breakaway pattern suggests the SPY/QQQ may attempt to move into another breakaway price move - very similar to yesterday's price move.
I will add that I believe the SPY cycle patterns have already moved through a breakaway phase with the ceasefire news early this week. I believe the gap and breakaway move yesterday may be the breakaway trend we are expecting today.
That would suggest the markets could pause and pullback a bit over the next few days.
Gold and Silver are trying to find a bottom after the brief selling that took place over the past few days. I really do believe Gold and Silver are poised to make a big move higher.
Bitcoin is on a terror to the upside. But be cautious of the downward cycle channel that may prompt a rollover in BTCUSD near the $107,500 level.
I spend a little time near the end of this video highlighting my work on the Tesla 3-6-9 price theory and going over a few examples for my new book on trading.
Enjoy the quick look at some of the more advanced techniques I'm working to unlock for all of you.
Get some.
#trading #research #investing #tradingalgos #tradingsignals #cycles #fibonacci #elliotwave #modelingsystems #stocks #bitcoin #btcusd #cryptos #spy #gold #nq #investing #trading #spytrading #spymarket #tradingmarket #stockmarket #silver

Nightly $SPY / $SPX Scenarios for June 25, 2025🔮 Nightly AMEX:SPY / SP:SPX Scenarios for June 25, 2025 🔮
🌍 Market-Moving News 🌍
💱 Dollar Slides on Middle East Ceasefire Optimism
A fragile ceasefire between Israel and Iran lifted risk sentiment across global markets. The U.S. dollar weakened, while the euro and British pound hovered near multi‑year highs
📈 Equities Near Record Highs
The S&P 500 and Nasdaq pushed toward all-time highs on June 25, supported by the Middle East truce and retreating energy prices. The S&P 500 rallied ~1.1%, with tech and discretionary sectors leading the charge
🛢 Oil & Treasuries Dip, Yield Cuts Anticipated
Oil plunged ~6% to ~$65/bbl as conflict fears eased. Softer prices plus weak consumer confidence spurred expectations of up to 60 bps in Fed rate cuts by December; Treasury yields pulled back accordingly
📉 Consumer Confidence Falls Again
The Conference Board’s index dropped to 93—the lowest level since May 2020—as concerns over tariffs and job availability weighed on households
📊 Key Data Releases 📊
📅 Wednesday, June 25:
(No major U.S. economic data scheduled)
Markets remain focused on geopolitical dynamics, Fed commentary, and next week’s PCE inflation release.
⚠️ Disclaimer:
This information is for educational and informational purposes only and should not be construed as financial advice. Always consult a licensed financial advisor before making investment decisions.
📌 #trading #stockmarket #economy #geopolitics #Fed #inflation #technicalanalysis
SPX Rug📊 Chart Analysis: ES1! (S&P 500 E-mini Futures, 1H) – Impending Breakdown via iFVG and Rising Wedge Top
This chart represents a technical analysis setup for ES1! (S&P 500 E-mini Futures) on the 1-hour timeframe. Here’s a contextual breakdown pointing toward a potential “rug pull” scenario by the end of the week, driven by an internal Fair Value Gap (iFVG) rejection and wedge resistance structure:
⸻
🔺 Structure Overview: Rising Wedge and Distribution Top
• The price action is following a rising wedge, which is typically a bearish reversal pattern, especially when occurring after a strong impulse move.
• The wedge’s upper trendline has just been tagged or slightly breached, with price showing early signs of rejection (small-bodied candles, wicks).
• A parabolic curve is drawn projecting a rounded top, suggesting buyers may be exhausting into resistance.
⸻
🧩 Internal Fair Value Gap (iFVG) in Focus
• The shaded gray area below current price action marks an iFVG (Internal Fair Value Gap) – a low-volume inefficiency formed during the recent bullish rally.
• iFVGs often act as magnetic zones, pulling price back to “rebalance” before continuation or reversal.
• Price has not yet filled this inefficiency completely, indicating a likely retracement target.
⸻
📉 Projected Breakdown Path
The curve implies a rounded top formation, with the following potential sequence:
1. Minor liquidity grab just above the wedge resistance.
2. Failure to hold above resistance confirms a deviation and traps late longs.
3. Sharp drop into the iFVG zone (gray block).
4. If iFVG support fails, acceleration toward the lower wedge trendline could follow — a true rug pull scenario.
⸻
🔻 Bearish Confluence Factors
• Volume divergence or lack of sustained momentum at highs (not visible here, but implied).
• The steepness of the rally suggests FOMO-driven buying, often vulnerable to reversal.
• The price has extended significantly from the last consolidation base, creating air pockets below.
• Candle structure shows upper wicks and rejection tails, signaling supply.
⸻
🗓️ Timing Bias – Into Week’s End
• Given the tightness of the wedge and proximity to iFVG + overhead resistance, any retracement could be swift and violent, particularly if driven by macro catalyst or profit-taking.
• Expectation would be a breakdown into Thursday or Friday, aligning with common volatility windows (e.g., weekly options expiry).
⸻
🔚 Summary
• Bias: Bearish (short-term)
• Trigger: Rejection of wedge high / deviation above resistance
• Targets:
• Primary: Fill of iFVG (gray zone)
• Secondary: Breakdown to lower wedge support
• Invalidation: Sustained acceptance above wedge trendline with bullish continuation

06/24/25 Trade Journal, and ES_F Stock Market analysis EOD accountability report: -717.50
Sleep: 4.5 hours - heat waves in nyc
Overall health: meh
** VX Algo System Signals from (9:30am to 2pm)** 4/4
9:40 AM Market Structure flipped bullish on VX Algo X3! 5 pts
9:42 AM VXAlgo NQ X3 Buy Signal (failed)
11:00 AM Market Structure flipped bullish on VX Algo X3! 20pt
11:58 AM VXAlgo NQ X1 Sell Signal (failed)
What’s one key lesson or takeaway from today?
and What major news or event impacted the market today?
There are days that the algo will lose but you just gotta trust the process and execute accordingly with a stoploss.
What are the critical support levels to watch?
--> Above 6130 = Bullish, Under 6125= Bearish
Video Recaps -->https://www.tradingview.com/u/WallSt007/#published-charts

SPY/QQQ Plan Your Trade For 6-24 : Post Market UpdateThis post-market update highlights the weakening volume while my primary proprietary modeling system continues to stay BULLISH.
The markets are really quite interesting right now. Weakening volume in this Gapping uptrend, today, suggests traders are not buying into the ceasefire between Iran and Israel.
Additionally, the move in metals suggests a PANIC phase has setup in the US markets.
This type of panic phase typically leads to selling of assets and moving capital into CASH.
I suggest traders continue to prepare for a moderate melt upward trend over the next few days - but be prepared for any potential breakdown (possibly trying to FILL THE GAP).
This market appears to be running on fumes.
While I believe Trump's policies will lead to a stronger bullish price trend over the next few years, these disruptions and the potential for consumers to pull away from spending/economic activity over the second half of 2025 is still very real.
Buckle up.
At this point, hedge your trades, move some capital into CASH and prepare for bigger price volatility as we move into July 2025.
Get some.
#trading #research #investing #tradingalgos #tradingsignals #cycles #fibonacci #elliotwave #modelingsystems #stocks #bitcoin #btcusd #cryptos #spy #gold #nq #investing #trading #spytrading #spymarket #tradingmarket #stockmarket #silver
