SPY, SPX, IWM, Natural Gas, NVDA, XYZ, AI - Analysis- Markets sold off into the NVDA rally this morning.
- Small afternoon rally turned indices back green
- Major pre market high levels up ahead likely allow us to push higher in coming days.
- NVDA should retest its premarket high levels.
- Profits secured on AI calls!
- Structurally indices are still bullish and remain above key levels.
- Yields see nasty reversal lower and look to be going down.
- Natural Gas trying to lure investors with a bottoming tail - but i think its false hope.
SPDR S&P 500 ETF (SPY)

TOP WAVE COUNT QQQ or SPY both same We had a higher high in the futures at 4 am . since that point we have declining I look for the market to still reach that price .But I know there was a lot of selling overnight today is day 37td since low

SPY/QQQ Plan Your Trade For 5-29 : Harami Inside patternToday's pattern suggests the SPY will stall within yesterday's body range and possibly trend a bit downward (after NVDA news/earnings).
I don't see the markets really extending much higher today as we are moving into a sideways Harami pattern, then into a CRUSH pattern tomorrow.
Gold and Silver are really making a big move higher this morning, which suggests traders are back to actively hedging against risk across the globe.
BTCUSD is trading flat/sideways - looking for some direction and, obviously, NOT RALLYING right now.
In my mind, the markets are struggling for direction, and Gold/Silver are showing that real risks are still elevated.
I also highlight my new Pure Alpha TTScanner algo and the work I'm doing to try to help more traders. The best part about what I do is that I get to create solutions/tools for traders. I love it.
Get some.
#trading #research #investing #tradingalgos #tradingsignals #cycles #fibonacci #elliotwave #modelingsystems #stocks #bitcoin #btcusd #cryptos #spy #gold #nq #investing #trading #spytrading #spymarket #tradingmarket #stockmarket #silver

Nightly $SPY / $SPX Scenarios for May 29, 2025 🔮 Nightly AMEX:SPY / SP:SPX Scenarios for May 29, 2025 🔮
🌍 Market-Moving News 🌍
🚫 U.S. Trade Court Blocks Tariffs
A federal trade court struck down key sections of President Trump’s steel and aluminum tariffs, sending U.S. stock futures sharply higher as investors anticipate reduced input costs for industrials and manufacturers
🌐 Markets Drift on Lack of Fresh Catalysts
Global equity markets showed muted moves today—stocks dipped and bond yields rose—as traders awaited new drivers of direction, with Nvidia’s ( NASDAQ:NVDA ) mixed earnings doing little to spark a decisive trend
📈 Bond Yields Climb, Pressuring Equities
The U.S. 10-year Treasury yield pushed above 4.6%, its highest in a month, on concerns over federal borrowing and fading rate-cut expectations, dragging the S&P 500 down more than 1% by midday
📊 Key Data Releases 📊
📅 Thursday, May 29:
8:30 AM ET: Advance Q1 GDP
Provides the first estimate of U.S. economic growth in Q1, a critical gauge of recession risk and Fed policy direction.
8:30 AM ET: Personal Income & Spending (April)
Tracks household earnings and outlays, offering insight into consumer resilience amid rising living costs.
⚠️ Disclaimer:
This information is for educational and informational purposes only and should not be construed as financial advice. Always consult a licensed financial advisor before making investment decisions.
📌 #trading #stockmarket #economy #news #trendtao #charting #technicalanalysis

SPY/QQQ Plan Your Trade Update For 5-28 : Calm Before The StormThis update is designed to help you understand why the SPY/QQQ/BCTUSD, as well as GOLD/SILVER and others, should stay rather FLAT today.
Unless there is some major news event (or other event) before the NVDA earnings data, I suspect the markets will stay very muted/flat through the close of trading today.
I hope you are all enjoying my 'Plan Your Trade' videos. Now that I've gotten through most of the family doctor/medical issues, it's back to work for me.
I'm working on a BTCUSD Cycle Pattern system as well as more advanced algos/trade triggers for subscribers.
Let me know how I'm doing. Is there something you want to see in these videos? Let me know.
Get some.
#trading #research #investing #tradingalgos #tradingsignals #cycles #fibonacci #elliotwave #modelingsystems #stocks #bitcoin #btcusd #cryptos #spy #gold #nq #investing #trading #spytrading #spymarket #tradingmarket #stockmarket #silver

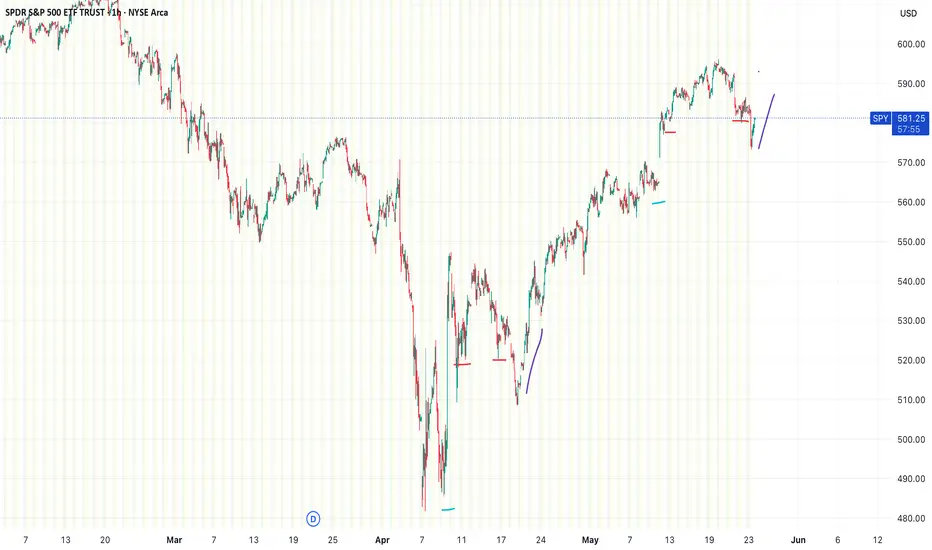
Repeat of Late Apr-May lows & rallyThe chart shows the SPDR S&P 500 ETF Trust (SPY) on a 1-hour timeframe, with a pattern appearing to be repeating itself from late April/May(Liberation day announcements) dip and then boot and rally from trade announcements, all marked by colored lines.
The colored lines (blue, red, purple) highlight a recurring price action setup. Each set of lines seems to mark a sequence of movements:
Blue: Sharp drop, then gap up
Red: Consolidation at a lower higher from gap up, return to high, consolidation back lower at previous lower high
Purple: Breakout & reversal upward.
SPX Bullish Patterns Emerging ahead of NVIDIA EarningsThe SP:SPX has taken out some major pivots and recaptured the ever so important daily 200 MA.
across multiple time frames some very interesting bullish patterns are emerging.
All eyes will be in NASDAQ:NVDA earnings tonight after the bell.
If NVIDIA beats and guides it will breakout of an epic bull flag pattern that will likely casue this market to trend to new All time highs.
Probabilities from a technical pattern standpoint are pointing towards higher price action.
We have already broken out and back tested key support levels and the buying is clearly being observed.
We remain net long with positions already in profit.

SHORT ON SPY (SPX/USD)Spy has given us bearish divergence at a major supply zone.
I will be selling spy to the next support level.
Today is FOMC and I expecting it to influence spy move to the downside.

IBIT aka BITCOIN TOPPING I am moving into In the money PUTS The chart of Blackrock bitcoin ETF needs only one minor new high to reach a projection and to complete The EW pattern from the low to mark in the bullish wave count wave 1 of Super Cycle blowoff this is a 5 % View . The 95 % is the WAVE B Top as we saw at every major peak see 2024 dec 8th forecast for bitcoin and spy Cyles as well as SPIRALS have now entered the window of A major turning point In which I am once again as I shorted bitcoin in ibit at 61 I have taken a65 % short and will move to a 100 % by friday if we can have any rally above the last high to end 5 clean waves Best of trades WAVETIMER

SPY/QQQ Plan Your Trade For 5-28 : Inside Breakaway PatternToday's Inside-Breakaway pattern suggests the markets may attempt to rally above yesterday's close on strong news or earnings. Today is the NVDA earnings day (after the close). I suspect trading will be somewhat flat ahead of these highly anticipated earnings.
Traders would be smart to position into a HEDGE ahead of the NVDA earnings this afternoon.
Obviously, if the earnings are good, the markets will react to the upside. If they are poor/weak, the markets could easily move aggressively downward.
All I know is the tariff moves over the past few weeks pushed gamers and others into buying high-end graphics cards back in April/May because everyone thought prices would skyrocket 30-50% or more. So, maybe NVDA will report strong revenue while costs increase.
It should be an interesting day after the close. Until then, I believe the markets will stay somewhat FLAT - anticipating NVDA data/comments.
Gold and Silver are still working through the FLAG APEX. Silver is already beyond the FLAG APEX and could make a big move higher at any moment. Gold still has one small downward price move to complete before the FLAGGING pattern is complete.
Overall, I believe Gold and Silver are forming a solid base near $3300/$33 for a strong rally in the future.
BTCUSD is stalling. In fact, the SPY/QQQ/BTCUSD are all stalling near the 0.75% Fib level (as shown on my charts). We may be setting up for that big breakdown I've been warning about. But, until we actually SEE price break out of the upward EPP Flagging channel - don't get overly confident of a BIG BREAKDOWN move.
My advice would be to HEDGE any aggressive trades you are trying to take right now. If you believe the markets are going to rally substantially, try to hedge that trade with some risk protection (longer-dated PUTS).
Today could be a catalyst day. We may get a breakout/breakdown move after NVDA's earnings/data.
Buckle up.
Get some.
#trading #research #investing #tradingalgos #tradingsignals #cycles #fibonacci #elliotwave #modelingsystems #stocks #bitcoin #btcusd #cryptos #spy #gold #nq #investing #trading #spytrading #spymarket #tradingmarket #stockmarket #silver

SPY (S&P500 ETF) - Price Bounced Above Gap Support Zone - DailySPY (S&P500 ETF) price has bounced up from the $576 price support gap level.
EMA Golden Cross is still active, the yellow 50EMA crossed above the red 200EMA which could signal a longer term bullish rally.
SPY price has been in an uptrend since May 2025.
Resistance Levels: $594, $596, $600, $607, $613.
Support Levels: $581, $575, $572, $567, $564.
Tariff and trade deal news, corporate earnings, presidential and government law changes, inflation data, economic data, and consumer sentiment can all affect Stock and ETF prices.

Nightly $SPY / $SPX Scenarios for May 28, 2025🔮 Nightly AMEX:SPY / SP:SPX Scenarios for May 28, 2025 🔮
🌍 Market-Moving News 🌍
🏭 Trump’s Tax Bill Threatens Clean-Energy Boom President Trump’s proposed budget aims to accelerate the expiry of key clean-energy tax credits, jeopardizing over $321 billion in investments and forcing manufacturers to pause expansion—risking a slowdown in solar and wind growth.
🛢️ Oil Flat as OPEC+ Output Hike Looms Brent and WTI held steady amid expectations that OPEC+ will announce a 411K bpd production increase for July at today’s ministerial meeting—balancing tighter U.S. supply and easing trade-tension pressures.
💻 Nvidia Earnings Eye Export-Curbs Impact Ahead of Q1 results, analysts warn U.S. chip-export restrictions to China could shave $5.5 billion from Nvidia’s ( NASDAQ:NVDA ) sales this quarter, testing AI-led growth optimism.
📈 Wall Street Climbs on Tariff Reprieve U.S. futures jumped after Trump delayed planned EU tariffs until July 9, lifting risk appetite across megacaps—Nvidia led gains with a 2.7% pre-market rise.
📊 Key Data Releases 📊
📅 Wednesday, May 28:
9:00 AM ET: Case-Shiller Home Price Index Measures month-over-month changes in home values across 20 major U.S. cities—a key gauge of housing-market trends.
10:00 AM ET: Consumer Confidence Index Tracks consumer sentiment on current business and labor-market conditions and expectations for the next six months.
2:00 PM ET: FOMC Minutes (May 6–7 Meeting) Detailed readout of policymakers’ economic outlook and voting rationale—critically watched for hints on future rate policy.
⚠️ Disclaimer: This information is for educational and informational purposes only and should not be construed as financial advice. Always consult a licensed financial advisor before making investment decisions.
📌 #trading #stockmarket #economy #news #trendtao #charting #technicalanalysis

Netflix is gearing up for an epic fallNetflix is sitting in the apex of a very large rising wedge. The rally is stalling here with a larger macro backdrop that may cause some selling pressure. If it breaks down from the rising wedge, we might witness some intense selling. The RSI is showing bearish divergence on multiple time frames. My target is circa $900.

SPY/QQQ Plan Your Trade For 5-27-25 : Blank PatternToday's SPY Cycle Pattern is BLANK. This suggests the market will trend similarly to what we've seen over the past few days - likely melting upward.
A BLANK pattern is a price structure I have not identified as some type of price structure yet. I will check the data to see if I can find anything that correlates with this pattern throughout today.
Generally, we are rolling into a consolidation phase that may attempt to break higher or continue consolidating and roll downward.
Overall, the alignment with the Fibonacci trigger levels suggests the markets will continue to struggle near the ranges I've shown on my charts.
Gold and Silver are rolling downward - likely as a result of the EU tariff pause. That move to pause EU tariffs takes quite a bit of pressure off the metals markets.
I do believe the Gold/Silver will continue to try to rocket higher - but this week metals may stay somewhat flat and trend downward a bit.
BTCUSD is setting up a MASSIVE Excess Phase Peak pattern. This is a very big price rotation that could either INVALIDATE (upward) or CONFIRM (downward). If we get confirmation, BTCUSD could fall back below $75k very easily. If we get invalidation, the sky is the limit to the upside.
Ultimately, I believe the global markets need another 60-90+ days to settle with all the global trade/tariff and other issues before moving into a more bullish price trend.
We'll see if I'm right or not over the next 60-90+ days.
Get some.
#trading #research #investing #tradingalgos #tradingsignals #cycles #fibonacci #elliotwave #modelingsystems #stocks #bitcoin #btcusd #cryptos #spy #gold #nq #investing #trading #spytrading #spymarket #tradingmarket #stockmarket #silver

ES Futures Trading Signal - 2025-05-25ES Futures Analysis Summary (2025-05-25)
Comprehensive Summary of Each Model
Grok/xAI Report
Market context: Price $5,875 above 9-, 20-, 21-, 50-day MAs, just under 200-day SMA at $5,804.75; RSI ~59 neutral; price near upper Bollinger Band. Bias: Moderately Bullish, potential breakout above BB. Trade Plan: Long at 5,900; SL 5,840; TP 6,050; 1 contract; confidence 0.65.
Claude/Anthropic Report
Market context: Price above 20/50/200-day SMAs; RSI ~59; MACD histogram slightly negative; healthy pullback within uptrend. Bias: Moderately Bullish. Trade Plan: Long at 5,875; SL 5,825; TP 5,975; 1 contract; confidence 0.68.
Llama/Meta Report
Market context: Price above 20/50-day SMAs, just under 200-day SMA; RSI neutral; BB middle at 5,787.7. Bias: Moderately Bullish. Trade Plan: Long at 5,880; SL 5,810; TP 6,000; 1 contract; confidence 0.65.
Gemini/Google Report
Market context: Price above all key MAs (20/50/200, EMA9/21); RSI neutral; MACD lines above zero but slight bearish cross; recent 24h bounce after 5-day pullback; BB upper at 6,060.7. Bias: Moderately Bullish. Trade Plan: Long at 5,875; SL 5,845; TP 5,935; 1 contract; confidence 0.70.
DeepSeek Report
Market context: Same MAs and indicators, but emphasizes MACD bearish crossover, price rejection at upper BB, recent pullback. Bias: Moderately Bearish near-term. Trade Plan: Short at 5,875; SL 5,925; TP 5,800; 1 contract; confidence 0.65. Areas of Agreement and Disagreement
Agreement:
All models note price trading above short- and medium-term MAs. RSI ~59 (neutral, room to run). BB upper band is resistance; MACD histogram negative. Consensus that recent 5-day pullback is either consolidation (bullish view) or warning sign (bearish view).
Disagreement:
Directional bias: Four models bullish vs. one moderately bearish. Entry levels: range 5,875–5,900. Stop-loss zones: 5,810–5,840. Take-profit zones: 5,935–6,050. Clear Conclusion
Overall Market Direction Consensus: Moderately Bullish Recommended Trade: Long ES futures
Entry Range: 5,870–5,880 (target 5,875) Stop Loss: 5,845 (30-point risk) Take Profit: 5,935 (60-point reward, 2:1 R:R) Position Size: 1 contract (adjust per account risk; ~1% equity) Entry Timing: Market Open Confidence Level: 70%
Key Risks and Considerations:
Short-term bearish MACD crossover may lead to choppy action or minor pullback. Volatility spike at market open can cause slippage. Negative macro or news catalysts can derail technical setup. ES is highly correlated with broader equity futures; cross-asset moves may amplify moves.
TRADE_DETAILS (JSON Format)
{ "instrument": "ES", "direction": "long", "entry_price": 5875.00, "stop_loss": 5845.00, "take_profit": 5935.00, "size": 1, "confidence": 0.70, "entry_timing": "market_open" }
📊 TRADE DETAILS 📊 🎯 Instrument: ES 📈 Direction: LONG 💰 Entry Price: 5875.0 🛑 Stop Loss: 5845.0 🎯 Take Profit: 5935.0 📊 Size: 1 💪 Confidence: 70% ⏰ Entry Timing: market_open
Disclaimer: This newsletter is not trading or investment advice but for general informational purposes only. This newsletter represents my personal opinions based on proprietary research which I am sharing publicly as my personal blog. Futures, stocks, and options trading of any kind involves a lot of risk. No guarantee of any profit whatsoever is made. In fact, you may lose everything you have. So be very careful. I guarantee no profit whatsoever, You assume the entire cost and risk of any trading or investing activities you choose to undertake. You are solely responsible for making your own investment decisions. Owners/authors of this newsletter, its representatives, its principals, its moderators, and its members, are NOT registered as securities broker-dealers or investment advisors either with the U.S. Securities and Exchange Commission, CFTC, or with any other securities/regulatory authority. Consult with a registered investment advisor, broker-dealer, and/or financial advisor. By reading and using this newsletter or any of my publications, you are agreeing to these terms. Any screenshots used here are courtesy of TradingView. I am just an end user with no affiliations with them. Information and quotes shared in this blog can be 100% wrong. Markets are risky and can go to 0 at any time. Furthermore, you will not share or copy any content in this blog as it is the authors' IP. By reading this blog, you accept these terms of conditions and acknowledge I am sharing this blog as my personal trading journal, nothing more.

SPY Weekly Options Trade Plan 2025-05-25SPY Weekly Analysis Summary (2025-05-25)
Model Summaries
Grok/xAI Report
Technicals: SPY at $579.11, below short-term EMAs (10/50 on 5-min), above 200-period EMA, RSI oversold on 5-min, MACD bearish. Daily chart neutral to slightly bearish. Sentiment: Rising VIX (22.29), max pain at $580. Trade: Buy 2025-05-30 577 put at $5.12, profit target ~3-point move, 20% stop loss, confidence 65%.
Claude/Anthropic Report
Technicals: 5-min and daily charts bearish but RSI oversold intraday. Volume selling peaked. Sentiment: Max pain $580, heavy OI at 575/570 puts, futures up. Trade: Buy 2025-05-30 581 calls at ~$4.91, profit targets 25–50%, 30% stop loss, confidence 65%.
Llama/Meta Report
Technicals: Moderately bearish on 5-min EMAs and MACD, daily neutral. Sentiment: Elevated VIX, max pain at $580. Trade: Buy 2025-05-30 579 put at $5.95, 20% profit target, 10% stop loss, confidence 70%.
DeepSeek Report
Technicals: Mixed signals—5-min oversold vs. daily bearish. Sentiment: Stuck between support $576.86 and max pain $580. Trade: No recommendation (confidence 45%).
Gemini/Google Report
Technicals: Daily and 5-min bearish, price under key EMAs. Futures suggest gap up to $581–581.50. Sentiment: Rising VIX, max pain at $580. Trade: Fade the open—buy 2025-05-30 578 puts at ~$2.20, target $3.00, stop ~$1.60, confidence 65%. Agreement and Disagreement
Agreement
Short-term bearish bias: Most see SPY below intraday EMAs and bearish MACD. Elevated volatility: All cite VIX rising above 20 as a risk factor and opportunity. Max pain magnet: Models note $580 as a gravitational level.
Disagreement
Directional tilt: Claude is moderately bullish (buy calls), others lean bearish or neutral. Trade entry strike: Puts at 577, 578, 579 vs. calls at 581. Risk parameters: Profit targets and stop losses vary widely (10–50% of premium). Conclusion and Recommendation
Overall Market Direction Consensus: Moderately Bearish. SPY is below key short-term EMAs, MACD on multiple timeframes is negative, and although oversold conditions could spark a bounce, the preponderance of models favors downside.
Recommended Trade
Strategy: Buy a single-leg naked put Instrument: SPY weekly put expiring 2025-05-30 Strike: 577.00 (ask $5.12) Premium: $5.12 Entry Timing: At market open, assuming SPY does not gap significantly below $579 or above $581. Profit Target: 40% gain (premium ~$7.17) Stop Loss: 25% premium loss (premium ~$3.84) Size: 1 contract Confidence Level: 65%
Key Risks and Considerations
SPY could bounce strongly from oversold levels or pre-market futures strength, invalidating the bearish setup. Theta decay accelerates late in the week; monitor time decay. VIX spikes could amplify premium and widen bid-ask spreads.
TRADE_DETAILS (JSON Format)
{ "instrument": "SPY", "direction": "put", "strike": 577.0, "expiry": "2025-05-30", "confidence": 0.65, "profit_target": 7.17, "stop_loss": 3.84, "size": 1, "entry_price": 5.12, "entry_timing": "open", "signal_publish_time": "2025-05-25 21:27:17 UTC-04:00" } 📊 TRADE DETAILS 📊 🎯 Instrument: SPY 🔀 Direction: PUT (SHORT) 🎯 Strike: 577.00 💵 Entry Price: 5.12 🎯 Profit Target: 7.17 🛑 Stop Loss: 3.84 📅 Expiry: 2025-05-30 📏 Size: 1 📈 Confidence: 65% ⏰ Entry Timing: open 🕒 Signal Time: 2025-05-25 21:27:49 EDT
Disclaimer: This newsletter is not trading or investment advice but for general informational purposes only. This newsletter represents my personal opinions based on proprietary research which I am sharing publicly as my personal blog. Futures, stocks, and options trading of any kind involves a lot of risk. No guarantee of any profit whatsoever is made. In fact, you may lose everything you have. So be very careful. I guarantee no profit whatsoever, You assume the entire cost and risk of any trading or investing activities you choose to undertake. You are solely responsible for making your own investment decisions. Owners/authors of this newsletter, its representatives, its principals, its moderators, and its members, are NOT registered as securities broker-dealers or investment advisors either with the U.S. Securities and Exchange Commission, CFTC, or with any other securities/regulatory authority. Consult with a registered investment advisor, broker-dealer, and/or financial advisor. By reading and using this newsletter or any of my publications, you are agreeing to these terms. Any screenshots used here are courtesy of TradingView. I am just an end user with no affiliations with them. Information and quotes shared in this blog can be 100% wrong. Markets are risky and can go to 0 at any time. Furthermore, you will not share or copy any content in this blog as it is the authors' IP. By reading this blog, you accept these terms of conditions and acknowledge I am sharing this blog as my personal trading journal, nothing more.

SPY at a CrossroadsUsing the Potterbox strategy on the 4 hour time frame I can see that we are at a huge level of support that is holding at $578, which I think will be crucial in deciding whether we break down or make an attempt to try and head to the upside.
$571 and then $568.50 are downside targets, if we end up breaking down below the $578 support.
Above us, there is a box where price consolidated that we retested the bottom of back on Friday. If we are able to hold support at $578, we are likely to retest and try and secure the floor at $581. With a $582.75 break, which is cost basis, or the median of the box, we are likely to head to the bottom of the next box above us at $588.

05-25-25 Risk Containment & Trading Strategy ExamplesSkilled Traders have learned to manage risk levels using techniques that allow them to preserve capital and move their assets towards future successful traders.
Some beginner traders get stuck trying to swing for the fences.
In this video, I try to share a common Fibonacci price/strategy technique where traders can attempt to limit risks while learning to identify efficient successful trade triggers.
Remember, taking a trade is the easy part. Protecting and growing your capital is much more difficult.
Please use the techniques in this video to learn how to protect and manage your capital.
Get some.
Happy Memorial Day.
#trading #research #investing #tradingalgos #tradingsignals #cycles #fibonacci #elliotwave #modelingsystems #stocks #bitcoin #btcusd #cryptos #spy #gold #nq #investing #trading #spytrading #spymarket #tradingmarket #stockmarket #silver

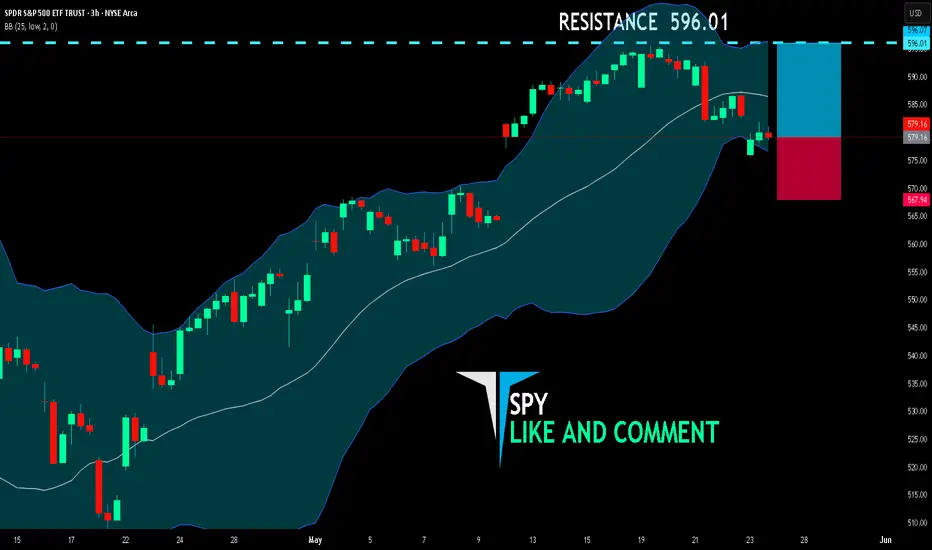
SPY LONG FROM SUPPORT
SPY SIGNAL
Trade Direction: long
Entry Level: 579.16
Target Level: 596.01
Stop Loss: 567.94
RISK PROFILE
Risk level: medium
Suggested risk: 1%
Timeframe: 3h
Disclosure: I am part of Trade Nation's Influencer program and receive a monthly fee for using their TradingView charts in my analysis.
✅LIKE AND COMMENT MY IDEAS✅
Stock Market Forecast | TSLA NVDA AAPL AMZN META MSFT GOOGLStock Market Forecast | CME_MINI:NQ1! CME_MINI:ES1! SPY QQQ
Mag 7 Forecast | NASDAQ:TSLA NASDAQ:NVDA AAPL AMZN META MSFT GOOG

Stock Markets, Gold, Silver: Run With The Bulls!In this Weekly Market Forecast, we will analyze the S&P 500, NASDAQ, DOW JONES, Gold and Silver futures, for the week of May 25 - 31st.
The Stock Markets are bullish, so run with valid buy setups when they form.
Gold and Silver are relatively strong. With tensions in Gaza and Iran, this is expected. Valid buys should be taken.
Crude Oil is a tad bearish due to US inventories, so valid sells are warranted in the short term.
Enjoy!
May profits be upon you.
Leave any questions or comments in the comment section.
I appreciate any feedback from my viewers!
Like and/or subscribe if you want more accurate analysis.
Thank you so much!
Disclaimer:
I do not provide personal investment advice and I am not a qualified licensed investment advisor.
All information found here, including any ideas, opinions, views, predictions, forecasts, commentaries, suggestions, expressed or implied herein, are for informational, entertainment or educational purposes only and should not be construed as personal investment advice. While the information provided is believed to be accurate, it may include errors or inaccuracies.
I will not and cannot be held liable for any actions you take as a result of anything you read here.
Conduct your own due diligence, or consult a licensed financial advisor or broker before making any and all investment decisions. Any investments, trades, speculations, or decisions made on the basis of any information found on this channel, expressed or implied herein, are committed at your own risk, financial or otherwise.

YEN BOTTOMING Look for ABC up back to 144/145The us $ yen trade should now be setup to rally But I can allow one more minor low into,786 But we should begin the final rally up into June 9 to the 16th for support in the carry trade and in SP500 into a seasonal cycle peak . As I have posted the long term chart of a massive Head n shoulder TOP in yen trade . Best of trades WAVETIMER

Apple losing $3Trillion clubNASDAQ:AAPL lost a fair amount of market share this week.
Coming under pressure from comments by Trump and tarrif news.
Apple seems to be a target for the president despite him answering a call on live TV today using an Iphone...kinda ironic.
Apple could easily chop in this 9% range before it makes a definitive move.
I lean more bullish since we're testing the lows of the trade range.
If Apple holds here it could be forming a right shoulder for a very bul,ish inverse head and shoulder pattern.

SPY/QQQ Plan Your Trade EOD Update : Memorial Weekend RisksThis EOD update is to help you try to position for the risks associated with a further breakdown in price trends over the lone Memorial Day weekend.
I know this video will be posted late in the day - but I want you to learn how to hedge against risks and try to learn to take your profits when they are THERE.
This is a really quick video.
Stay safe this weekend and thank you to all our VETS for your service and sacrifices.
We honor you this weekend.
GET SOME.
#trading #research #investing #tradingalgos #tradingsignals #cycles #fibonacci #elliotwave #modelingsystems #stocks #bitcoin #btcusd #cryptos #spy #gold #nq #investing #trading #spytrading #spymarket #tradingmarket #stockmarket #silver
