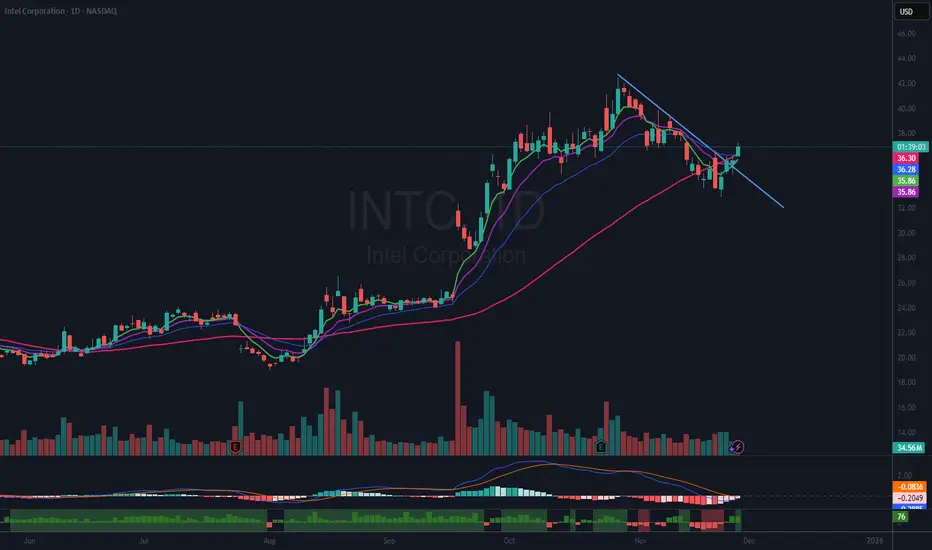
$INTC Classic 20% Pullback AnalysisOverview of Recent INTC Performance
Intel Corporation (INTC) experienced significant positive momentum following its gap-up breakout on September 18th. From the closing high on September 17th to the closing high on October 28th, the stock delivered an impressive gain of 67%.
Subsequent Pullback and Technical Retracement
After reaching its peak, INTC underwent a pullback of just over 19%. This decline represented a 50% retracement of the prior advance, a common technical milestone. During this period, the stock briefly dipped below its 50-day moving average (DMA), a level often regarded as a key support by technical analysts.
Recovery and Position Initiation
Today INTC reclaimed both the 50-day moving average and the 20-day exponential moving average (EMA). Additionally, the stock broke above its downtrend line, signaling renewed strength. In response to these technical developments, I initiated a half-size position in INTC, setting a stop-loss just below the day’s low to manage risk.
Risk Management and Investment Disclaimer
Readers need to conduct their own analysis and adhere to their personal trading strategies. Please remember that all investments involve inherent risks. Making informed decisions is crucial when allocating capital in the financial markets.
SPDR S&P 500 ETF (SPY)
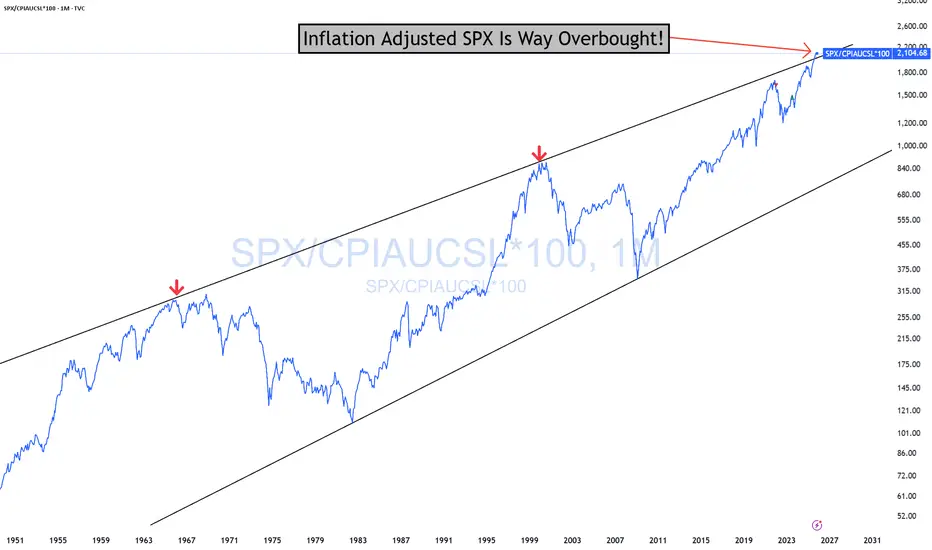
SPX Overbought In Real Terms WARNING!SPX Overbought In Real Terms (Inflation-adjusted) Stripping away inflation shows you the "real" value of SPX.
This is not something you will likely see again in your lifetime. We have only been this overbought twice before since 1947! Both times, what followed was a bear market. You are far more likely to see the price hit the bottom of the channel in your lifetime.
As is always the case, no one will want to touch stocks then. Rest assured, I, for one, will be buying up a storm then.
You have all been WARNED!
GTFO and STFO!
Risk Management is paramount!
THANK YOU for getting me to 5,000 followers! 🙏🔥
Let’s keep climbing.
If you enjoy the work:
👉 Boost
👉 Follow
👉 Drop a solid comment
Let’s push it to 6,000 and keep building a community grounded in truth, not hype.
SPY WEEKLY LIVE 26 NOV 2025This is Spy weekly where I have clearly discussed why not to long here. Best is not to trade if you are not sure otherwise chances are you might get stuck at the top.
NOTE:STAY AWAY FROM GOING LONGS

IBB d2 accumulation buy/hold setup 40% gains🔸Hello guys, today let's review 2daily chart for IBB . Entering re-accumulation
stage now, expecting range bound trading during autumn time season.
Range defined by range highs set at 135 usd and range lows at 117 usd.
🔸Similar fractal observed in 2018/2019. Faded into range after heavy spike,
re-accumulation then 50% pump later during spring 2020.
🔸Recommended strategy bulls: wait for pullback to complete and reload low
near range lows close to 111/113 usd (premium prices). TP1 bulls +20% gains,
TP2 bulls +40% gains. buy/hold setup for patient traders. good luck!
🎁Please hit the like button and
🎁Leave a comment to support our team!
RISK DISCLAIMER:
Trading Futures , Forex, CFDs and Stocks involves a risk of loss.
Please consider carefully if such trading is appropriate for you.
Past performance is not indicative of future results.
Always limit your leverage and use tight stop loss.

SPY - Potential Head & Shoulders And now we have this exhaustion pattern again. I went back and foruth on this yesterday. But in the final minutes a bought shorts again. The right shoulder can consolidate for a few days and the H&S can still be invalidated but I have this on my bucket list. I can´t sit on the sidelines on this one. If it happens, it will be legendary. With first strong support at 605

Weekly QQQ (NQ-US100) Outlook - Prediction (23 NOV)Weekly QQQ (NQ-US100) Outlook - Prediction
📊 Market Sentiment
Market sentiment is driven by fear at the moment. In my opinion, we are trading inside a bearish zone. Unless we get meaningful data or positive news, I expect the market to continue declining. Core PPI will be released on Tuesday at 08:30, which could create a minor bullish reaction; however, I personally do not think this will shift the overall sentiment. PPI is not a strong catalyst for a major sentiment change, so bearish conditions are likely to remain in play.
📈 Technical Analysis
Price ran the 613 level strongly and reversed aggressively on Thursday after NVDA earnings. This move trapped the bulls and filled institutional put positions. As I mentioned on Thursday evening, a weak bounce was possible and that is exactly what occurred.
📌 Outlook – Prediction
Scenario 1 (Bearish Scenario):
I believe this scenario is more likely to play out. I expect price to retrace toward 559. If we see strong bullish momentum on Monday, I will likely become more cautious with my puts.
Scenario 2 (Bullish Scenario):
If price shows strong momentum on Monday and reprices toward 614, then I will consider buying calls around 606, targeting all-time highs afterward.
Follow me for daily SPY–QQQ updates. I will update the idea based on evolving price action.
💬 For detailed insights and broader market context, please check my Substack link in profile.
⚠️ For educational purposes only. This is not financial advice.

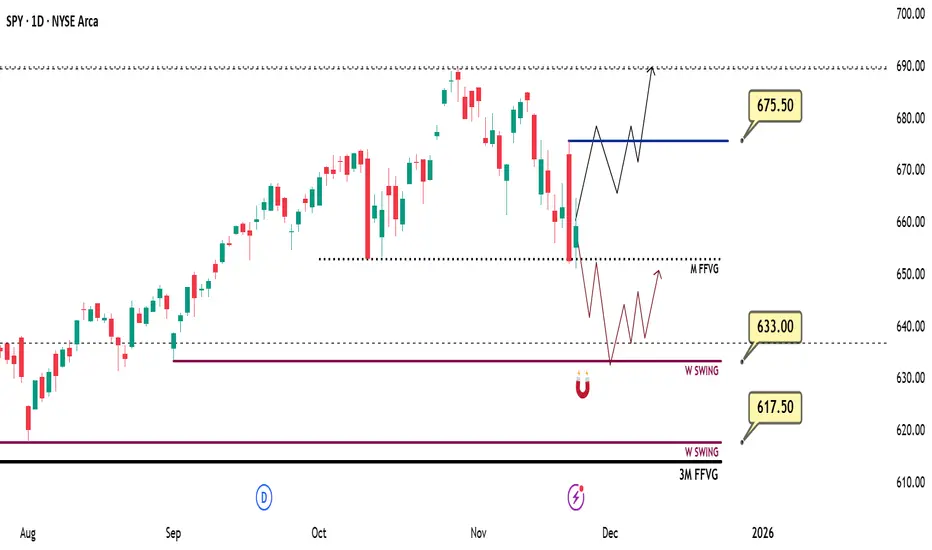
Weekly SPY (ES-US500-SPX) Outlook - Prediction (23 NOV)Weekly SPY (ES-US500-SPX) Outlook - Prediction
📊 Market Sentiment
Market sentiment is driven by fear at the moment. In my opinion, we are trading inside a bearish zone. Unless we get meaningful data or positive news, I expect the market to continue declining. Core PPI will be released on Tuesday at 08:30, which could create a small bullish reaction; however, I personally do not think this will shift overall sentiment. PPI is not a strong catalyst for a major sentiment change, so bearish conditions are likely to remain in play.
📈 Technical Analysis
Price ran 675.5, trapped the bulls, and then reversed sharply to the downside exactly as I anticipated in my previous weekly outlook. Price tapped 653 and bounced from that level, which aligned with Friday’s projection.
📌 Outlook – Prediction
Scenario 1 (Bearish Scenario):
I think this scenario is more likely early in the week. Price may retrace toward 633, which is a significant institutional liquidity pool for me. From there, price could gather energy for a higher expansion or bounce.
Scenario 2 (Bullish Scenario):
If price aggressively reprices back to 675, I will consider the bias short-term bullish. In that case, I will be buying after a retracement to 667.
Follow me for daily SPY–QQQ updates. I will update the idea based on evolving price action.
💬 For detailed insights and broader market context, please check my Substack link in profile.
⚠️ For educational purposes only. This is not financial advice.
$SPY & $SPX Scenarios — Wednesday, Nov 26, 2025🔮 AMEX:SPY & SP:SPX Scenarios — Wednesday, Nov 26, 2025 🔮
🌍 Market-Moving Headlines
🧱 Growth check pre holiday: Weekly jobless claims and durable goods hit together at 8 30 AM, giving a clean read on labor and business demand.
📦 Capex and manufacturing pulse: The delayed September durable goods numbers update the heavy-industry side of the economy before year end.
📘 Fed Beige Book: Afternoon release colors in how businesses are actually feeling about demand, pricing, and hiring across districts.
📊 Key Data & Events (ET)
⏰ 8 30 AM
• Initial Jobless Claims (Nov 22): 225,000 vs 220,000
• Durable Goods Orders (Sept, delayed): 0.5 percent vs 2.9
• Durable Goods ex Transportation (Sept, delayed): 0.4 percent
⏰ 2 00 PM
• Federal Reserve Beige Book — anecdotal read on growth, wages, and pricing
⚠️ Disclaimer: Educational and informational only — not financial advice.
📌 #SPY #SPX #trading #macro #jobs #durablegoods #BeigeBook #stocks #bonds #markets #investing
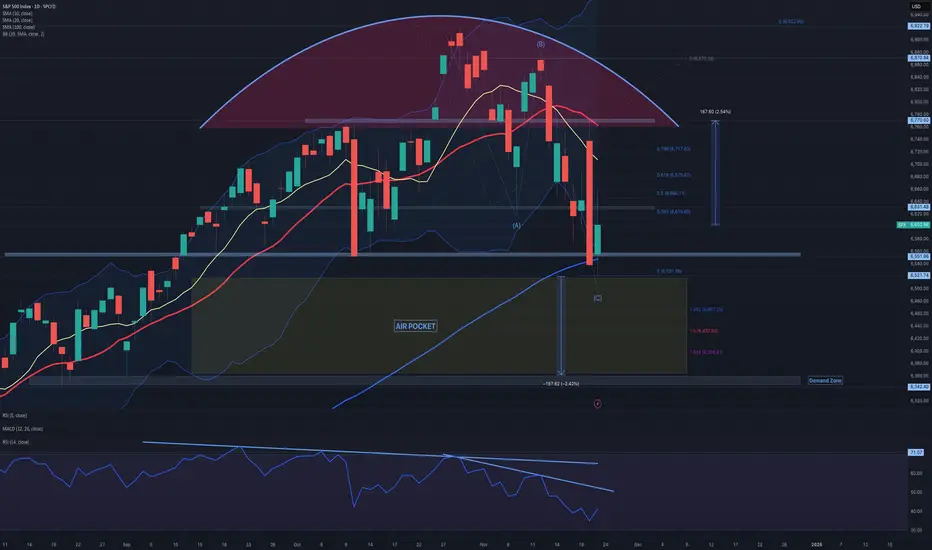
ES (SPX, SPY) Analysis, Levels, Setups for Wed (Nov 26)Market Overview
The equity markets are currently facing a pivotal moment. The E-mini S&P 500 (ES) has made a significant rebound from the daily low around 6,520, approaching robust resistance levels formed by the highs of the previous week and yesterday. Both daily and 4-hour charts reveal a consistent pattern of higher lows emerging from a recent trough. However, the price now finds itself just beneath a key distribution cap and Fibonacci extension zone, estimated between 6,810 and 6,888. The daily momentum oscillator has shifted upward from an oversold position and remains at a mid-range level, indicating that while it is not yet overbought, the general trend still favors buying the dips, provided that crucial support levels are maintained.
Meanwhile, the Nasdaq 100 (NQ) mirrors this momentum, hovering near its New York Pre-Market (NYPM) peak. Recent gains have been bolstered by impressive earnings from Nvidia, highlighting the ongoing AI narrative, even as concerns about a potential market bubble begin to emerge, with NVDA's stock showing signs of volatility.
Events & News for Wednesday 26 Nov (Pre-Thanksgiving)
Wednesday is a data-heavy session in the U.S., and it’s also the last “normal” day before the Thanksgiving holiday liquidity vacuum. Expect volatility spikes and potential regime shifts around:
• 08:30 ET – Weekly jobless claims plus a cluster of delayed October releases: durable goods orders, trade balance/wholesale data, personal income & core PCE inflation, and related indicators.
• 10:00 ET – New home sales and other housing-related data.
• 10:30 ET – EIA crude oil inventories (can move risk sentiment via energy/curve).
• 14:00 ET – Fed Beige Book, giving an updated regional read on growth and inflation ahead of December’s FOMC meeting.
In addition, the BEA has postponed the Q3 GDP second estimate that had been scheduled for this week, so markets are leaning more heavily on the data above for macro guidance.
Net takeaway: 8:30 ET is the main volatility window, with a second impulse risk at 10:00–10:30 and potential trend extension or reversal into the NY morning kill-zone.
Key Zones (ES Z-25, based on current structure)
Immediate Resistance
• R1: 6,790–6,795
NYPM High / Prior Day High cluster (NYPM.H 6,792.5, PDH & Y-VAH 6,792.5). Sellers have defended this intraday band so far; it’s the lid of today’s range.
• R2: 6,805–6,815
1H fib extension 1.272 (≈ 6,810.25) plus likely PWH vicinity. First HTF extension above today’s range; a clean “stop run & decision zone” if 6,795 breaks.
• R3: 6,840–6,850
1H fib extension 1.618 (≈ 6,847.25). If buyers punch through R2, this is the next logical magnet and a strong candidate for an exhaustion spike on good data.
• R4: 6,880–6,900
1H fib 2.000 (≈ 6,888) and prior daily swing-high area. That whole 6,888–6,900 pocket is a big-picture objective and, for now, a likely “weak high” that could attract a stop run but also host the first serious counter-trend attempts.
Support / Demand
• S1: 6,765–6,775
Yesterday’s POC (~6,769.5), NY lunch high/NYL.H (6,774.25), and top of the 1H consolidation shelf. As long as the market keeps closing above this band on 15–60m, the short-term uptrend remains intact.
• S2: 6,720–6,735
Y-VAL 6,720.5, LO.H 6,721.5, ONH 6,732.5. This is the top of the prior value area and a natural “buy-the-dip” location if 6,770 gives way on data noise.
• S3: 6,670–6,705
NYAM.L 6,674.5, IB Low 6,674.5, ONL 6,701.75, plus current LOL 6,701.75. If we get a deeper flush, this is the primary intraday demand band where bulls must step back in to preserve the recent trend from the daily low.
• S4: 6,560–6,580
PDL 6,574.5 and top of the larger daily discount block. A break and sustained acceptance below here would open the door for a much larger retrace back toward the 6,520–6,420 HTF discount zone (daily 1.272/1.618 fibs).
Market Outlook: Bias & Forecast (Overnight → NY Session)
Structural Bias:
The prevailing market sentiment remains bullish as long as the E-mini S&P 500 (ES) sustains its position above the support range of 6,720–6,735 on a closing basis. The likely trajectory indicates a probing towards the 6,810–6,850 extension band. While the recent rally shows signs of being extended, it has not yet reached a point of definitive exhaustion, pointing towards a “late-stage impulse” rather than a confirmed top.
Overnight → London Session:
The base case anticipates a sideways-to-moderately downward movement from the 6,790s back toward the support levels of S1/S2 (6,765 → 6,730). This move aims to address intraday imbalances without disturbing the overall market structure. Should liquidity be limited, there may be an attempt during the London session to trigger stops through today's highs, directing attention towards resistance levels R2 (6,805–6,815) ahead of the New York session's developments.
New York AM Session (8:30–11:00 ET):
Should robust data emerge—indicating a favorable economic climate with subdued core Personal Consumption Expenditures (PCE) and steady labor claims—this is likely to spark a rally through R1 towards R2/R3, targeting 6,810 and subsequently 6,847 as key upside magnets. Conversely, a negative surprise featuring weak growth, a troubling inflation mix, or a risk-off sentiment evident in the Beige Book later in the day could dramatically alter the market landscape, potentially driving a liquidation toward support levels S2/S3, or in case of an unexpected shock, even probing S4 over the coming 24 to 48 hours.
In the near term, the expectation leans towards a gradual upward movement with shallow pullbacks, aiming for the 6,810–6,847 range. However, traders should remain vigilant for an increased risk of an exhaustion spike and a possible intraday reversal as this target zone is approached.
A++ Setups for Tomorrow
A++ Setup 1 – Trend Long from Retest of 6,730–6,770
Trigger:
Price trades down into 6,730–6,770 (S1/S2 overlap) either overnight or on the 8:30 data flush.
15m prints a higher low and closes back above ~6,755, reclaiming the mid-range.
5m confirms with a clear reclaim and hold of 6,760–6,770, then a higher low on 1m.
Entry Zone: 6,760–6,775 on a clean pullback after reclaim (not the first knife-catch wick).
Initial Stop: Below 6,720, tucked beyond Y-VAL/LO.H and the pullback low (≈ 35–45 pts risk depending on your exact fill).
Targets:
• TP1: 6,810–6,815 (R2 / 1.272 fib).
• TP2: 6,840–6,850 (R3 / 1.618 fib).
• Stretch: 6,880–6,900 (R4 / 2.0 fib) if data and risk sentiment stay supportive.
A++ Setup 2 – Exhaustion Short from 6,847–6,888
Trigger:
Impulsive move into 6,847–6,888 during NY AM or early PM, ideally on or shortly after 8:30 data.
15m candle shows rejection (long upper wick) and closes back below ~6,847.
5m prints a lower high under that rejection high, and 1m fails to make new highs on retests.
Entry Zone: 6,845–6,865 on the first proper lower-high after the rejection (avoid shorting the exact wick; let the LH print).
Initial Stop: Above 6,900, beyond the 2.0 fib and psychological round number (≈ 35–45 pts risk).
Targets:
• TP1: 6,790–6,795 (R1 / NYPMH/PDH cluster).
• TP2: 6,760–6,770 (S1 pivot band).
• Stretch: 6,720–6,735 (S2 / top of value) if selling pressure persists.

Will SPX Make New All Time Highs? We dive into the recent technical setup of the S&P500.
We are on the verge of triggering a new massive bullish patterns.
The backdrop of soft commodities. soft yields, softer dollar and the December 10 rate cute.
We have the tailwinds in place for higher price.
I would like to see some sideways chop to make this rally more sustainable, but bull market bounces are very fierce especially when they come from failed bearish patterns.

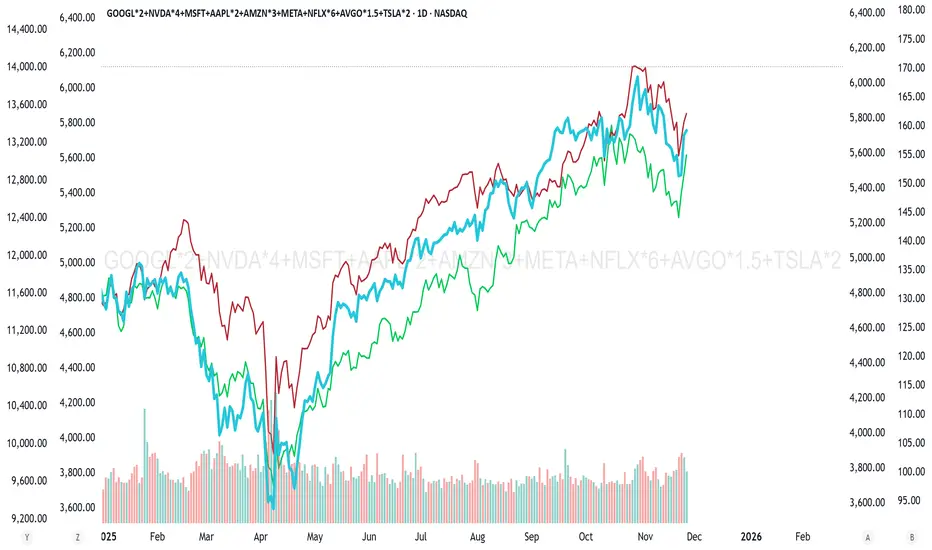
Got Microcaps?Sure the market is whipsawing up and down, the VIX is comparatively high, and the Head and Shoulders pattern on Bitcoin and SPY looms large. But... have you checked out IWC, the ETF that tracks an index of microcap stocks? They have performed in line with other indexes, but today this ETF is up two and a half percent, while QQQ and SPY are plodding higher at less than one percent.
Looking for setups on small caps and micro caps might be a worthwhile addition to your trading tactics from now until the end of the year.
HYG THE LAST WAVE of LIQUIDITY Bubble to Burst 82Well I do think it is time to post the chart below as to provide an Early warning for what is nearing .I have stated that 2026 is a rather Negative cycle has to All markets based on the 4 year cycle . This is the wave structure I have not alt it or saw any reason the last year plus and feel that The bull market from the MARCH 23th low 2020 is nearing the end . I see interest rates in 2026 to rise and rise rather sharp Not what the street or most traders feel The market is telling me huge issues are near . the 4 yr and the 65 month cycles are Hard down similar to 2002 decline . Best of trades WAVETIMER

ES (SPX, SPY) Analysis, Levels, Setups for Tue (Nov 25th)Market Outlook: Analyzing Technical Trends and Economic Indicators
The recent rebound from the 6520–6450 support zone has generated a constructive short-term outlook. However, the market now approaches a significant supply area in the 6800 range. While the immediate trend appears to favor modest gains, contingent upon maintaining support between 6660 and 6645, a pivotal decision zone resides between 6765 and 6815. A strong acceptance above this band could trigger an upward movement towards 6855–6930, while failure to hold could lead to a corrective phase targeting 6690, 6625, and potentially 6550.
Upcoming Economic Data: November 25
The week ahead is marked by a wealth of economic data expected to impact trading activity, particularly in the U.S. housing market and consumer sentiment. Key reports scheduled for Tuesday morning include the S&P/Case-Shiller Home Price Index for September, the Conference Board Consumer Confidence Index for November, Pending Home Sales for October, and the Richmond Fed Manufacturing Index. These releases, set for the 9:00–10:00 ET window, could introduce volatility into the markets.
Recent trends in consumer confidence have suggested a dampened sentiment due to the prolonged government shutdown and slow job growth. A disappointing report could perpetuate discussions of recession and further Fed interest rate cuts, while an unexpected improvement would likely support the current risk-on sentiment.
On the corporate front, pre-market earnings from major players like Analog Devices, Alibaba, Best Buy, Dick’s Sporting Goods, J.M. Smucker, and NIO could further influence market dynamics in the early hours, especially if there are surprises in their guidance.
Technical Analysis: Higher-Timeframe Perspective
From a higher-timeframe standpoint, the daily chart reflects a completed down-swing exiting the prior weak high around 6930, retracting to the extension zone between 6525 and 6455 where buyers have demonstrated strong interest. This low now appears as a "strong low" in technical analysis terms, aligning with higher timeframe discount levels and previous demand signals. Oscillators indicate a shift from oversold conditions, currently suggesting a corrective rally rather than an immediate resumption of a downward trend.
However, trading remains constrained within a 4-hour supply band between approximately 6765 and 6815. This range is characterized by the last notable lower high and previous sell-side momentum that precipitated the significant drop to 6520. Unless price breaches the 6815 threshold, the overall swing structure continues to reflect a "lower-high" scenario, which necessitates caution for any bullish positions as they occur within a broader corrective framework.
Intraday Trading Dynamics: Expectations for the Day
Analyzing the intraday structure on the 1-hour and 30-minute charts reveals that Monday’s trading culminated in a robust upward trend from the London low of 6625 to the New York AM low of 6646, concluding with a consolidation phase just beneath the Asia session high at 6724. The cluster of highs around 6715–6725 precisely correlates with an intraday equilibrium line situated just below the upper edge of the 4-hour supply band.
Volume data indicates strong buying activity emerging from the base established at 6520–6625, tapering off as prices approached the 6715–6725 range. Further insights from the 1-hour oscillator hint at a cooling in momentum, suggesting that initial price reactions may favor mean reversion rather than an unimpeded breakout.
Looking ahead into the New York trading hours:
- Asia Session: Anticipate a trading range likely between 6700 and 6730, with potential stop raids above 6725 and minor retracements towards 6685.
- London Session: If buyers can sustain the 6685–6660 level during potential pullbacks, this could establish a foundation for another attempt at reaching the 6765–6815 supply zone during the New York data release.
- New York Open: Provided that the 6660–6645 area holds during 15-minute closes, the baseline scenario suggests a rotation into the 6765–6815 decision band between late London and early New York. A significant rejection in this zone, characterized by long upper wicks and unsuccessful 15-minute closes above 6815, would favor a pullback towards 6690–6710 by day’s end. Conversely, clear acceptance above 6815 on robust volume would pave the way for targets at 6855 and potentially back to 6930.
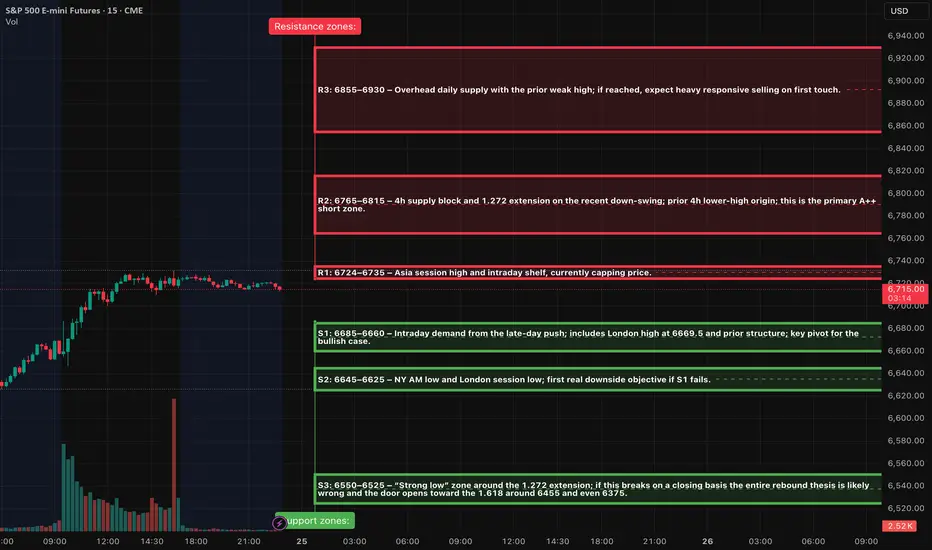
Key zones
Resistance zones:
R1: 6724–6735 – Asia session high and intraday shelf, currently capping price.
R2: 6765–6815 – 4h supply block and 1.272 extension on the recent down-swing; prior 4h lower-high origin; this is the primary A++ short zone.
R3: 6855–6930 – Overhead daily supply with the prior weak high; if reached, expect heavy responsive selling on first touch.
Support zones:
S1: 6685–6660 – Intraday demand from the late-day push; includes London high at 6669.5 and prior structure; key pivot for the bullish case.
S2: 6645–6625 – NY AM low and London session low; first real downside objective if S1 fails.
S3: 6550–6525 – “Strong low” zone around the 1.272 extension; if this breaks on a closing basis the entire rebound thesis is likely wrong and the door opens toward the 1.618 around 6455 and even 6375.
A++ Setup 1 – Short fade from 6765–6815 (Tier-1 rejection play)
Entry zone: 6780–6805, leaning as close to 6800 as price action allows after the spike and stall.
Invalidation / hard stop: 6827, above the 4h supply high and the 1.272 line; if price can close above there, the rejection idea is wrong.
Targets and management:
TP1: 6710–6690 (retest of intraday equilibrium and prior 30m shelf). That gives roughly 2R from a 6785–6800 entry with a 20–25 point stop.
TP2: 6645–6625 (London and NY AM lows cluster). This is where you want the bulk of the remaining size off if sellers stay in control.
TP3: 6550–6525 (strong low zone) only if macro tape turns risk-off; treat this as a runner target, not baseline.
A++ Setup 2 – Long continuation from 6660–6680 (Tier-1 acceptance play)
Entry zone: 6670–6680 after the sweep and reclaim; avoid catching the first knife if momentum is still heavy.
Invalidation / hard stop: 6643, below the combined London low band; a 15m close below 6645 means the demand shelf failed.
Initial risk: roughly 30–37 points depending on fill.
Targets and management:
TP1: 6724–6735 (Asia high / intraday range top). From a 6675 entry with a 30-point stop this is just over 1.5R; to keep the setup A++, bias toward entries closer to 6670 or take partials slightly higher, around 6740, where 2R is reached.
TP2: 6765–6815 (4h supply band). This is where you expect strong counter-flow; plan to remove most of the remaining size here.
TP3: 6855–6930 only if price slices through 6815 on strong volume and macro data support risk-on; in that case trail under 1h higher lows rather than using static targets.
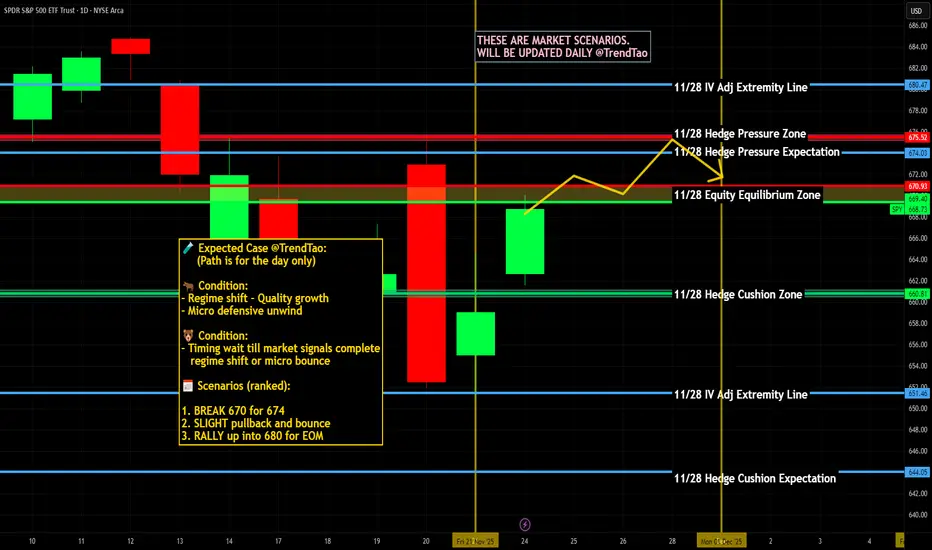
$SPY & $SPX Scenarios — Tuesday, Nov 25, 2025🔮 AMEX:SPY & SP:SPX Scenarios — Tuesday, Nov 25, 2025 🔮
🌍 Market-Moving Headlines
🧾 Backlog data hits at once: Delayed Sept Retail Sales + PPI finally print, giving a clearer view of demand and pipeline inflation.
📉 Cooler demand, firm prices: Sales miss old expectations while PPI stays positive, not the clean disinflation combo bulls want.
🏠 Housing and confidence: Case Shiller, Confidence, and Pending Home Sales update how higher rates are hitting owners and buyers into holiday season.
📊 Key Data & Events (ET)
⏰ 8 30 AM block — Sept backlog
• Retail Sales (delayed): 0.3 percent vs 0.6 old forecast
• Retail Sales ex Auto: 0.3 percent vs 0.7
• PPI (delayed): 0.3 percent | YoY 2.6 percent
• Core PPI: 0.3 percent | YoY 2.8 percent
⏰ 9 00 AM
• Case Shiller 20 City Home Prices (Sept): 1.3 percent vs 1.6
⏰ 10 00 AM
• Business Inventories (Aug, delayed): 0.0 percent vs 0.2
• Consumer Confidence (Nov): 93.2 vs 94.6
• Pending Home Sales (Oct): 0.0 percent
⚠️ Disclaimer: Educational and informational only — not financial advice.
📌 #SPY #SPX #trading #stocks #macro #PPI #retailsales #consumer #housing #inflation #markets #investing
Will December Rate Cut Save the Market?Is Rate Cut Probability up a Short-Term Bounce or continuation of the downtrends?

ES (SPX, SPY) Week Ahead Analysis - (Nov 24th - 28th)Executive Overview
Equity markets, particularly the E-mini S&P 500 (ES), are currently navigating a broader weekly uptrend, yet have entered a phase of short-term correction after encountering resistance around the 6,900 to 7,000 level. Presently, prices hover near 6,660, finding support from a robust pocket in the mid-6,500s.
Recent volatility indices have surged, with the VIX now in the low 20s and the term structure exhibiting a near flat or slight backwardation. Meanwhile, key credit metrics, funding conditions, and spread behaviors remain stable, suggesting that the current market dynamics are more indicative of equity valuation adjustments and positioning realignments rather than a sign of systemic distress.
Looking ahead to the coming week, we anticipate a choppy trading environment characterized by two-sided price movements within a range of 6,520 to 6,780. Intraday strategies are likely to involve selling into strength around resistance levels R1 and R2, while seeking to capitalize on buying opportunities when prices approach support levels S1. Notably, the VIX is expected to remain elevated above its recent teens regime during this period.
A critical point of focus will be the 6,520 to 6,540 support zone. Should this area fail to hold on a daily closing basis, we could see the correction extend toward the 6,420 to 6,450 range, with further downside potential targeting the low-6,300s.
Multi-Timeframe Analysis of Market Structure
Weekly Trend: Premium/Discount
The current market structure remains characterized by higher highs (HH) and higher lows (HL). The last significant upward movement peaked just shy of 7,000, while the ongoing pullback has managed to hold above the previous weekly higher low band, located in the high-5,000s to low-6,000s range. A notable supply zone exists from approximately 6,850 to just above 7,000, identified as a weak high. Below this, a robust demand/value area spans from around 5,850 (at the 1.272 Fibonacci retracement) down to approximately 5,575 (the 2.0 Fibonacci level) from the previous major leg. On this timeframe, the E-mini S&P (ES) is trading at a premium in relation to the substantial 5,800–5,900 weekly value area. However, we have transitioned from momentum-driven expansion to a mean-reverting correction phase.
Daily Trend and Range
Shifting to a daily perspective, the structure has inverted to a short-term downtrend, marked by a lower high established near 6,900, followed by a lower swing low around the 6,520s. Fibonacci retracement levels from the last sell-off align as follows: 1.272 at approximately 6,521, 1.618 at around 6,418, and 2.0 at approximately 6,304. The 6,520s zone is precisely where price action found support. For the upcoming week, the operative daily range can be defined between 6,520–6,540 as the lower band and 6,760–6,780 as the upper band, coinciding with the previous breakdown area and recent four-hour lower high.
Four-Hour Structure
Analyzing the four-hour chart reveals a clear downward impulse from the mid-6,700s lower high to lows in the mid-6,500s, followed by a sharp rebound. A Fibonacci sequence applied to this movement suggests retracement levels of 1.272 at approximately 6,527, 1.618 at around 6,455, and 2.0 at roughly 6,376. These levels coincide with a notable demand block around the 6,520–6,540 range, identified as a "strong low," with additional liquidity found in the 6,450s and 6,370s. The recent upward movement from these lows appears corrective within the broader impulse, indicating a potential lower high is forming under the 6,680–6,700 area. Until price reclaims and maintains this band, the four-hour swing remains in a down-to-sideways trend.
Hourly Context
From an hourly viewpoint, the ES experienced a decline from approximately 6,770 to the mid-6,500s, subsequently establishing a series of higher lows as it grinds upward. Recent hourly activity shows price pressing against an overhead resistance zone located around 6,660–6,670, just beneath the Asia Session high of 6,662.5 and the New York PM high / previous day high at 6,677.5. The volume-weighted average price (VWAP) is situated near 6,609.75, with prior intraday lows clustering between 6,594 and 6,611.75. Intraday, the ES is currently mid-range, confined between support levels at 6,640–6,642 (Asia Session Low) and resistance at 6,662.5–6,677.5 (Asia Session High / New York PM High / Previous Day High / Yearly Value Area High).
Weekly and Daily Oscillators / Momentum
The weekly oscillator has retracted from overbought conditions but remains elevated, signifying a cool-off within a strong uptrend. Conversely, the daily oscillator is currently oversold and beginning to reverse, showing readings in the mid-20s with the first uptick following a significant downturn. This pattern is classic for potential bounces; however, confirmation of a full trend reversal is yet to materialize.
Key levels and zones
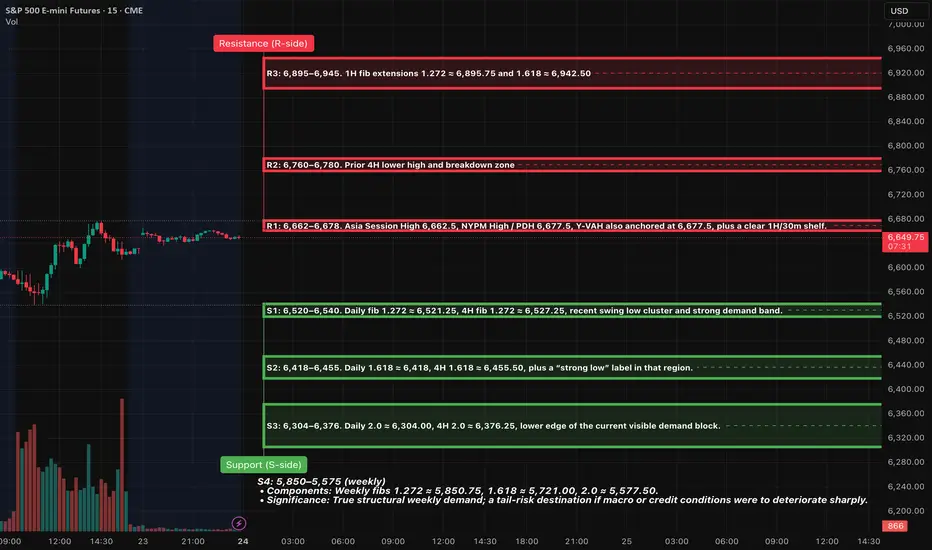
Resistance (R-side)
R1: 6,662–6,678
• Components: Asia Session High 6,662.5, NYPM High / PDH 6,677.5, Y-VAH also anchored at 6,677.5, plus a clear 1H/30m shelf.
• Significance: This is the nearest control ceiling; it capped Friday’s rebound and marks the boundary between neutral intraday and more aggressive squeeze potential.
• Role: First place to fade “pop-and-fail” wicks for short A++ plays, and the first area that must be decisively reclaimed for bulls to press a larger squeeze.
R2: 6,760–6,780
• Components: Prior 4H lower high and breakdown zone; 1H HH before the large red impulse bar; sits just below a dense daily supply band.
• Significance: A retest of broken support turned resistance. Acceptance back above here would suggest the entire recent flush was a failed breakdown, opening the path to retest the highs.
R3: 6,895–6,945
• Components: 1H fib extensions 1.272 ≈ 6,895.75 and 1.618 ≈ 6,942.50, plus prior weekly weak high / supply band just under 7,000.
• Significance: This is the larger-timeframe cap. Reaching this zone in one week would likely require either a decisively dovish Fed tone or very strong data.
---
Support (S-side)
S1: 6,520–6,540
• Components: Daily fib 1.272 ≈ 6,521.25, 4H fib 1.272 ≈ 6,527.25, recent swing low cluster and strong demand band.
• Significance: This is the primary weekly pivot for the current correction. First major A++ long location if it’s flushed and reclaimed during liquid hours.
S2: 6,418–6,455
• Components: Daily 1.618 ≈ 6,418, 4H 1.618 ≈ 6,455.50, plus a “strong low” label in that region.
• Significance: This is deeper discount inside the current swing, where larger timeframe players would be expected to defend aggressively if the broader uptrend is to remain intact.
S3: 6,304–6,376
• Components: Daily 2.0 ≈ 6,304.00, 4H 2.0 ≈ 6,376.25, lower edge of the current visible demand block.
• Significance: If price reaches here this week, the market is in a full-fledged risk-off extension, but still within the context of the broader weekly uptrend.
S4: 5,850–5,575 (weekly)
• Components: Weekly fibs 1.272 ≈ 5,850.75, 1.618 ≈ 5,721.00, 2.0 ≈ 5,577.50.
• Significance: True structural weekly demand; a tail-risk destination if macro or credit conditions were to deteriorate sharply.
---
Volatility Backdrop
The VIX spot closed at approximately 23.4 on Friday, having surged beyond 26 earlier in the week, marking the highest levels observed since spring. The VIX futures curve has shifted to a flat or mildly backwardated structure, with near-term contracts hovering around 22.9 for late November and extending into subsequent months. Meanwhile, rates volatility (MOVE) is situated near 78–79, close to its historical average, indicating it is not in crisis territory.
The volatility complex is signaling a notable expectation of an equity shock, although it does not reflect panic in the funding or rates sectors. The flat to slightly backwardated volatility curve suggests potential for larger intraday swings and gap risks, while also presenting significant reward opportunities when market entries align with critical price levels.
Options and Positioning
The total put/call ratio currently stands at approximately 0.87, with the index put/call ratio around 1.03, and exchange-traded products (ETP) at about 1.28. In contrast, the equity-only put/call ratio is at a lower 0.56. The 10-day moving average of the total put/call ratio is approximately 0.90, which is not indicative of panic extremes. The SKEW index is around 148—elevated, yet falling short of the extreme levels (150–160+) that typically signal substantial tail-risk hedging.
Institutional hedging remains present but lacks urgency; there is a distinct preference for put options in indices and ETFs, while single-stock options continue to skew toward calls. Coupled with a VIX in the low-20s and a near-flat curve, this indicates that dealers are likely moderately short gamma at current strike prices. Consequently, price movements beyond key levels may extend further than usual before reversion occurs. This inference, drawn from the volatility and put/call configurations, does not represent a direct measurement.
Market Breadth and Internals
Earlier in the week, the NYSE experienced a significant imbalance, with decliners outnumbering advancers by more than 3:1, alongside a higher count of new lows than new highs, a classic indicator of distribution. However, by Friday, the breadth reversed sharply, with approximately 2,237 advancers against 548 decliners on the NYSE. Nevertheless, the McClellan Oscillator remains negative (~-72), and the Summation Index is in a downward trajectory, suggesting ongoing repair rather than the emergence of a new bull trend. Defensive sectors, including health care and consumer staples, have outperformed, while tech and speculative AI stocks led the recent selloff.
The market has transitioned from a clear uptrend to a choppy corrective phase characterized by distribution. The activity on Friday, while indicative of an oversold breadth thrust, has not confirmed a market bottom.
Credit and Funding
The high-yield ETF (HYG) is trading around 80.3, only slightly below recent highs, indicating no signs of disorderly selling. The US high-yield option-adjusted spread (OAS) is near 3.17%, and B-rated high-yield OAS is about 3.3%, both well below long-term averages (>5%) and only marginally above recent tight levels.
Conclusion:
Credit markets display relative calm, reinforcing the notion that the recent weakness in equities is driven by valuation and sentiment rather than a funding crunch.
Sentiment and Crowd Positioning
Recent AAII survey results indicate roughly 32.6% of respondents identify as bulls, while 23.9% classify as bears. This results in a negative bull-bear spread of about -11%, contrasted with a long-run average of +6%. The combination of an elevated VIX, a negative bull-bear spread, and moderate put/call ratios reflects a climate of pessimism without full-fledged capitulation.
Practical Takeaway:
There exists potential for an upward squeeze if macroeconomic headlines shift towards dovish sentiment. However, a prolonged risk-off environment remains possible if critical support levels like S1 and S2 break.
Cross-Asset and Global Risk Tone
Global equities experienced their most significant weekly pullback since early this year, with the MSCI World Index declining by roughly 3%. Europe’s Stoxx 600 recorded its largest weekly drop since summer, primarily driven by weakness in the tech sector and increased volatility. The cryptocurrency market is in a full risk-off stance, with Bitcoin dipping to a seven-month low before rebounding around $84k, accompanied by sentiment indicators reflecting extreme pessimism and heavy liquidations, now followed by a weekend bounce from oversold RSI levels.
Relative Risk Tone:
The Nasdaq-100 (NQ) remains weaker compared to the S&P 500 (ES), aligning with the decline in tech and AI sectors, while defensive and value-oriented sectors maintain resilience. Overall, the cross-asset narrative suggests a risk-off tone, yet not systemic in nature—exactly the backdrop where well-defined level trading is most effective.
Macro and Data Calendar
The upcoming holiday-shortened week is set to unveil a series of delayed U.S. economic data, including September retail sales, PPI, Core PPI, home prices, pending home sales, inventories, and consumer confidence on Tuesday, followed by jobless claims, durable goods, Chicago PMI, and the Beige Book on Wednesday. The prior government shutdown has postponed key GDP and inflation reports, heightening uncertainty around the Fed's December decisions. Federal Reserve officials exhibit divided opinions about another rate cut in December; some advocate for a pause with inflation near 3%, while others, including at least one governor and the NY Fed president, lean toward support for an additional 25 basis point reduction. Market odds for a December cut have shifted within a ~50–70% range, depending on daily fluctuations.
Classification of the Recent Move:
This market dynamic appears primarily as a reset in valuations and positioning following the exuberance surrounding AI and tech, exacerbated by data-related uncertainty rather than stemming from a definitive “data shock” event.
13. Two A++ setups (for the coming sessions)
These are plan-level plays, to be executed only if price action and vol conditions line up as described.
A++ Setup 1: R1 Rejection Short
Trigger
Inside NY AM or the first hour of NY PM:
1. 15m candle wicks above 6,670–6,675 and closes back under 6,665.
2. 5m prints a lower high beneath that wick, closing back below ~6,660.
3. 1m breaks down through the intraday shelf near 6,655 with increased selling volume / negative delta.
Execution
• Entry: around 6,660–6,665 on the first 1m pullback that fails under the broken shelf.
• Initial stop: above the wick high, e.g. 6,690 (adjust to the actual 15m high but keep risk in the 20–25 point range).
• Risk (example): entry 6,665, stop 6,690 → 25 pts.
Targets
• TP1: 6,615–6,620 (VWAP / prior intraday shelf) → about 2R (50 pts) from a 25-pt stop.
• TP2: 6,540–6,550 (upper edge of S1 / prior congestion) – roughly 4R.
• TP3 (runner): 6,520–6,530 (core of S1 cluster) – 5R+ if reached.
A++ Setup 2: S1 Flush-and-Reclaim Long
Trigger
15m candle flushes below 6,530, ideally tagging 6,520–6,525, with a long tail and closes back above ~6,535–6,540.
5m shows a higher low above the 15m wick low, with real bids stepping in and volume picking up.
1m pushes back through 6,545–6,550 and holds, turning that band into a floor.
Execution
• Entry: 6,545–6,550 on the first 1m pullback that holds above 6,540 after the reclaim.
• Initial stop: below the 15m flush low, e.g. 6,515–6,520.
• Example parameters: entry 6,550, stop 6,520 → 30-pt risk.
Targets
• TP1: 6,595–6,600 (local shelf / prior L at 6,594 and ONH/VWAP neighborhood) → about 2R (60 pts) from a 30-pt stop.
• TP2: 6,662–6,678 (R1 band) – the same ceiling from Setup 1; that’s roughly 4R+ from the entry.
• TP3 (runner): 6,760–6,780 (R2) if data and vol cooperate, giving 7R+ potential.
If that microstructure doesn’t show up, downgrade each play from A++ to stand-aside – let someone else fight in the middle of the range and keep your capital for when the levels truly light up.
Good Luck !!!
Weekly Market Forecast: Indices Are Weak! Wait For Sells!In this Weekly Market Forecast, we will analyze the S&P 500, NASDAQ, Gold and Silver futures, for the week of Nov 24-29th.
Enjoy!
May profits be upon you.
Leave any questions or comments in the comment section.
I appreciate any feedback from my viewers!
Like and/or subscribe if you want more accurate analysis.
Thank you so much!
Disclaimer:
I do not provide personal investment advice and I am not a qualified licensed investment advisor.
All information found here, including any ideas, opinions, views, predictions, forecasts, commentaries, suggestions, expressed or implied herein, are for informational, entertainment or educational purposes only and should not be construed as personal investment advice. While the information provided is believed to be accurate, it may include errors or inaccuracies.
I will not and cannot be held liable for any actions you take as a result of anything you read here.
Conduct your own due diligence, or consult a licensed financial advisor or broker before making any and all investment decisions. Any investments, trades, speculations, or decisions made on the basis of any information found on this channel, expressed or implied herein, are committed at your own risk, financial or otherwise.

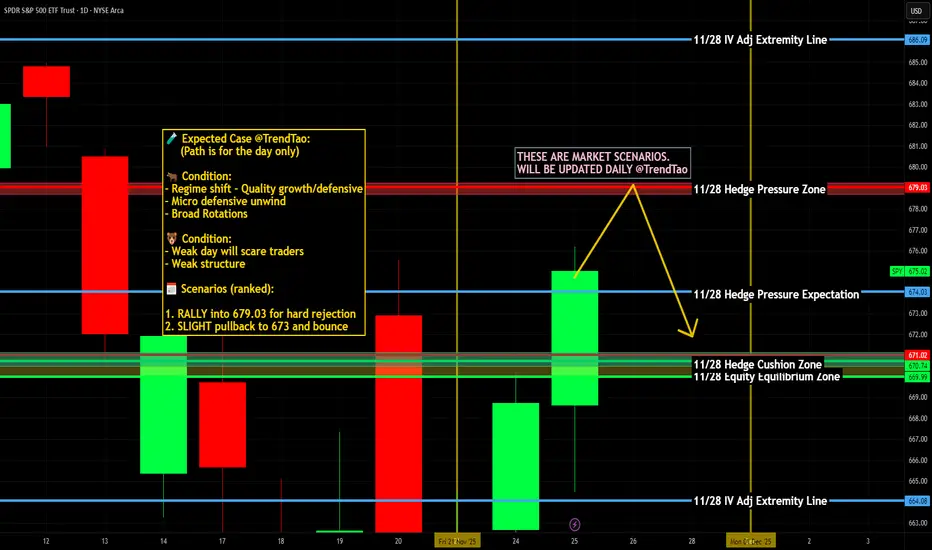
$SPY and $SPX Scenarios — Week of Nov 24 to Nov 28, 2025🔮 AMEX:SPY and SP:SPX Scenarios — Week of Nov 24 to Nov 28, 2025 🔮
🌍 Market-Moving Headlines
📉 Shutdown backlog week: Most major September reports finally drop on Tuesday and Wednesday — Retail Sales, PPI, Durable Goods — all of which normally move markets but are arriving late due to the October shutdown.
🏠 Housing and consumer read-through: Case Shiller, Consumer Confidence, and Pending Home Sales give traders a real-time read on the health of housing and spending as the holiday season begins.
📉 Liquidity thinning: Thanksgiving week historically brings lighter volume and sharper moves when data surprises.
📊 Key Data and Events (ET)
Below are only the trader-relevant items, with delayed reports clearly marked.
TUESDAY, NOV 25 — The Big Data Dump
⏰ 8:30 AM — Retail Sales (Delayed Sept)
Actual: 0.3 percent (vs 0.6 forecast)
⏰ 8:30 AM — Retail Sales ex-Autos (Delayed Sept)
Actual: 0.3 percent (vs 0.7 forecast)
⏰ 8:30 AM — Producer Price Index PPI (Delayed Sept)
Actual: 0.3 percent
Year over year: 2.6 percent
⏰ 8:30 AM — Core PPI (Delayed Sept)
Prior: 0.3 percent
Current: Not available due to shutdown
⏰ 8:30 AM — Core PPI Year over Year
Actual: 2.8 percent
⏰ 9:00 AM — Case Shiller Home Price Index, 20-City (Sept)
Actual: Not available
Forecast: 1.6 percent
⏰ 10:00 AM — Business Inventories (Delayed Aug)
Actual: 0.1 percent
⏰ 10:00 AM — Consumer Confidence (Nov)
Actual: 93.4 (vs 94.6 forecast)
⏰ 10:00 AM — Pending Home Sales (Oct)
Actual: 0.0 percent
WEDNESDAY, NOV 26
⏰ 8:30 AM — Initial Jobless Claims (Nov 22)
Actual: 225,000 (vs 220,000 forecast)
⏰ 8:30 AM — Durable Goods Orders (Delayed Sept)
Actual: 0.3 percent (vs 2.9 percent prior)
⏰ 8:30 AM — Durable Goods ex-Transportation (Delayed Sept)
Actual: 0.4 percent
THURSDAY, NOV 27
🦃 Thanksgiving — No economic releases
FRIDAY, NOV 28
⏰ 9:45 AM — Chicago PMI (Nov)
Forecast: 43.8
⚠️ Note: Many September reports are still delayed due to the federal government shutdown from Oct 1 to Nov 12. All delayed items are explicitly labeled above.
⚠️ Disclaimer: Educational and informational only. Not financial advice.
📌 #SPY #SPX #macro #trading #stocks #inflation #consumer #PPI #retailsales #housing #markets
SPY Set To Grow! BUY!
My dear subscribers,
My technical analysis for SPY is below:
The price is coiling around a solid key level - 659.05
Bias - Bullish
Technical Indicators: Pivot Points Low anticipates a potential price reversal.
Super trend shows a clear buy, giving a perfect indicators' convergence.
Goal - 669.74
About Used Indicators:
By the very nature of the supertrend indicator, it offers firm support and resistance levels for traders to enter and exit trades. Additionally, it also provides signals for setting stop losses
Disclosure: I am part of Trade Nation's Influencer program and receive a monthly fee for using their TradingView charts in my analysis.
———————————
WISH YOU ALL LUCK

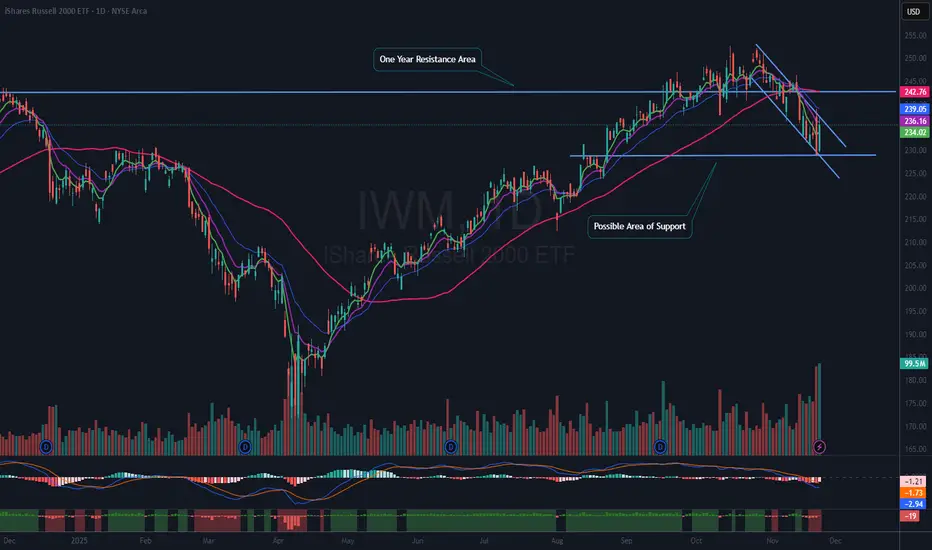
Analysis of $IWM: Flag Pattern or Breakdown?Overview of AMEX:IWM and the Russell 2000 Index
IWM is an exchange-traded fund (ETF) that tracks the Russell 2000 Index. According to Investopedia, the Russell 2000 is the most widely quoted measure of the overall performance of small-cap to mid-cap stocks. This index represents approximately 7% of the total market capitalization of the Russell 3000 and is composed of the bottom two-thirds of companies in terms of size within the Russell 3000 index. The broader Russell 3000 reflects the movements of nearly 96% of all publicly traded U.S. stocks.
Significance of IWM in Market Analysis
One of the reasons for focusing on this ETF is its role as a market barometer. IWM provides insight into whether small-cap stocks are participating in a broader bull market or lagging. Healthy bullish market continuations typically require participation from small-cap stocks. If small caps underperform, it may serve as an early warning that the overall market could be poised for a downturn, as these stocks are generally considered riskier.
Recent Technical Observations
A review of the chart shows that from mid-September to mid-November, IWM has struggled to remain above a resistance area established one year ago. The ETF has declined about 8.5% from its recent highs and may be forming a flag pattern. There was a strong bounce on Friday, accompanied by heavy volume, but the price remains within the current downtrend.
It appears that IWM may have found support at a previous breakout level, though this is not yet confirmed. The ETF is currently trading well below both the 50-day moving average (red line) and the 21-day exponential moving average (blue line).
Potential Trade Considerations
A trade setup would be of interest if IWM can break above the downtrend line defining the flag pattern and regain the 21 EMA. Should this occur, waiting for the ETF to establish a higher low would provide an opportunity for a favorable risk-reward entry.
Conclusion and Cautions
At present, IWM does not offer a setup that fits the criteria for action within this trading strategy. Nevertheless, it may be worthwhile to add the ETF to a watchlist for future opportunities. All readers are encouraged to perform their own analysis and follow their personal trading rules. It is important to remember that all investments carry inherent risks, and making informed decisions is essential when allocating capital.
Weekly QQQ (US100-NQ) Outlook - Prediction (16 NOV)Weekly QQQ (US100-NQ) Outlook - Prediction (16 NOV)
📊 Market Sentiment
Market sentiment appears bearish right now, in my opinion. The FED may pause rate cuts in December, which has contributed to recent selling pressure and possible hedging flows. However, with the U.S. government reopening last week, we will start receiving updated economic data again. If employment data weakens and CPI comes in low or stable, it could trigger a renewed bullish momentum.
NVDA will report earnings this Wednesday after market close. I will be watching closely in my view, if NVDA were to miss expectations, QQQ and SPY could see a strong retracement. However, I think this is unlikely. I expect solid earnings growth and believe the AI cycle continues to support upside.
Additionally, U.S. Treasury Secretary Scott Bessent stated that the Trump administration aims to finalize its trade agreement with China by Thanksgiving (November 27). This could add further bullish sentiment to the market.
📈 Technical Analysis
The market showed a strong bounce on Friday after tapping the 599 level. RSI has also reset, meaning price is no longer overbought. We remain inside the weekly range, and price has reached the 0.75 max discount zone for the second time.
📌 Game Plan – Prediction
Bullish Scenario (Black Line):
I think this scenario is more likely. I want to see price close a 4H candle above 613. If that happens, I will be targeting 618 next. Price may run 618, pull back slightly, then eventually push toward 625 and potentially all-time highs around 637.
Bearish Scenario (Red Line):
If we see strong selling on Monday, I will assume price may follow the bearish path. In that case, I expect a move toward 595.5 and then the range low at 589. From there, we could see a bounce and a reclaim of 595.5.
💬For detailed insights and broader market context, please check my Substack link in profile.
⚠️ For educational purposes only. This is not financial advice.
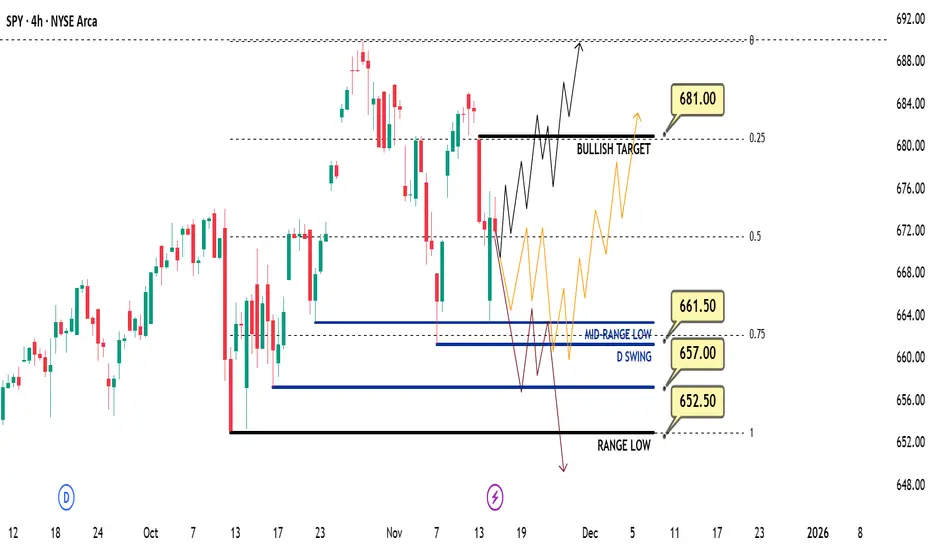
Weekly SPY (US500-ES-SPX) Outlook - Prediction (16 NOV)Weekly SPY (US500-ES-SPX) Outlook - Prediction (16 NOV)
📊 Market Sentiment
Market sentiment appears bearish right now, in my opinion. The FED may pause rate cuts in December, which has contributed to recent selling pressure and potential hedging flows. However, with the U.S. government reopening last week, we will begin receiving updated economic data again. If employment data weakens and CPI comes in low or stable, it could support renewed bullish momentum.
NVDA will report earnings this Wednesday after market close. I will be watching closely in my view, if NVDA were to miss expectations, both QQQ and SPY could see a strong retracement. However, I think this is unlikely. I expect solid earnings growth and believe the ongoing AI cycle will continue to support upside.
Additionally, U.S. Treasury Secretary Scott Bessent stated that the Trump administration aims to finalize its trade agreement with China by Thanksgiving (November 27). This could help bring additional bullish sentiment into the market.
📈 Technical Analysis
Price retraced into the 0.75 max discount zone, ran the mid-term range low, and closed back above it creating another higher expansion bounce. On Friday, we saw a second retest of the range low followed by another strong reaction. In my opinion, price remains strong here.
📌 Game Plan – Prediction
I currently see three scenarios:
Bullish Scenario (Black Line):
I believe this is the most likely scenario. I want to see price close above 675.5 and continue expanding higher. The first bullish target is 681. After clearing 681, a small retracement may occur, followed by a potential expansion toward all-time highs around 690.
Orange Scenario:
If the market opens less bullish on Sunday night, price may run 661 to gather more liquidity and energy for a move higher. If 661 is swept and a 4H candle closes back above it, I will assume this scenario is playing out.
Bearish Scenario (Red Line):
If price breaks aggressively below 661 and closes underneath it, that would indicate the market may want to move lower. In that case, I will exit my calls and buy puts, targeting a move toward at least 562.5.
💬 For detailed insights and broader market context, please check my Substack link in profile.
⚠️ For educational purposes only. This is not financial advice.
$SPX: dead cat bounce SP:SPX : Following the unexpected downturn on Thursday, SP:SPX stabilized last Friday after an intraday decline below the horizontal support at 6,550, which aligns with the 100-day simple moving average (SMA). The candlestick wicks on the daily chart suggest a potential short-term pause in the prevailing selling pressure. Monday will probably see a continuation of the rebound from Friday’s lows; however, it remains unclear whether Friday’s low marks the end of the current pullback. The RSI14 is approaching, but not yet within, oversold territory, and does not exhibit positive divergence. For the upside scenario, retracement levels from Friday’s high have been identified. Bulls must first reclaim the 6,530 resistance to maintain momentum; nevertheless, unless the key resistance at 6,770—168 points above Friday’s close—is breached, the probability of another downward move remains elevated, targeting the 6,360–6,340 region.