$SPY the final leg higher, then 20%+ correctionI know there are a lot of people calling for a crash right here, and while I do think we end up getting one, I think there's one last move higher above $700 first.
I think we need to squeeze out the shorts and convince everyone the next leg is starting before we see a move down.
I do think after we hit and reject one of the upper resistances, that it will set up a great short opportunity.
The trigger for the short will be UVIX to hit it's lower support levels combined with SPY hitting it's upper resistances.
Don't know what will cause the move, but I think it'll likely happen even faster than the April move.
So be prepared to exit as we approach the highs or set tight stop losses.
Spylong

SPY Bullish: Flag Breakout Toward 691–705SPY on the 1D is trending cleanly higher, with price holding above the MA20/60/120 and consolidating near the highs in a neat bull flag. Short-term resistance sits at $691.70 (ATH), while key structure support is anchored around $654.00. The flag’s ceiling is near $685.00, and the MA20 around $672.84 has been acting as first dynamic support after October’s sharp shakeout and swift recovery.
Primary path: a daily close above $685.00 on rising volume opens the door to a retest of $691.70, with extension toward $705.00 based on the measured move. Traders can consider two tactics: buy dips into the MA20 support zone at $672.00–$675.00, or buy strength on a break-and-close above $685.00. Initial profit-taking can be staged back into $691.70, with runners left for $705.00 if momentum expands.
If the flag fails, a decisive close back below the MA20/flag support near $672.00 risks a fade toward $660.00. The bullish thesis is invalidated on a daily close below $654.00, which would mark a larger structure break. A tactical stop just under $670.00 keeps risk contained while the consolidation resolves.
This is a study, not financial advice. Manage risk and invalidations

SPY Bullish Breakout: Flag Setup Aims for 700–715SPY remains in a strong 1D uptrend, printing higher highs and higher lows from June through November. Price continues to respect the 20-day MA as dynamic support, with a clean demand zone near $671.72. Overhead, the recent all-time high at $689.76 aligns with the upper boundary of a developing bull flag (upper trendline ≈ $688). Structure is bullish; momentum stays positive while volatility cools after October’s expansion.
Primary path: a daily close above $689.76/$690 confirms the flag breakout and likely drives a continuation toward the psychological $700 handle first, then the $710–$715 extension as participation broadens. Alternatively, a constructive pullback into $671–$675 offers a dip-buy zone so long as the 20-day MA holds. If $671.72 fails decisively, watch the 60-day MA around $658.57 as the next support area.
Triggers and risk: Break-and-hold above $690 or a strong rebound from $671 activates longs; scale out near $700 with room for $710–$715 if momentum persists. Invalidation for breakout entries sits below the recent consolidation lows around $678; for dip buys, a break under the prior swing low near $668 negates the immediate bullish thesis. A daily close below $671 would be an early bearish warning. This is a study, not financial advice. Manage risk and invalidations

S&P500 - $8.000 is the ultimate target!🎊S&P500 ( TVC:SPX ) continues the bullrun:
🔎Analysis summary:
Over the course of the past couple of months, the S&P500 has been rallying +40%. However, this does not mean that the bullrun is over any time soon. Since the S&P500 perfectly respects the rising channel pattern, a move to the upper trendline is the target.
📝Levels to watch:
$8,000
SwingTraderPhil
SwingTrading.Simplified. | Investing.Simplified. | #LONGTERMVISION

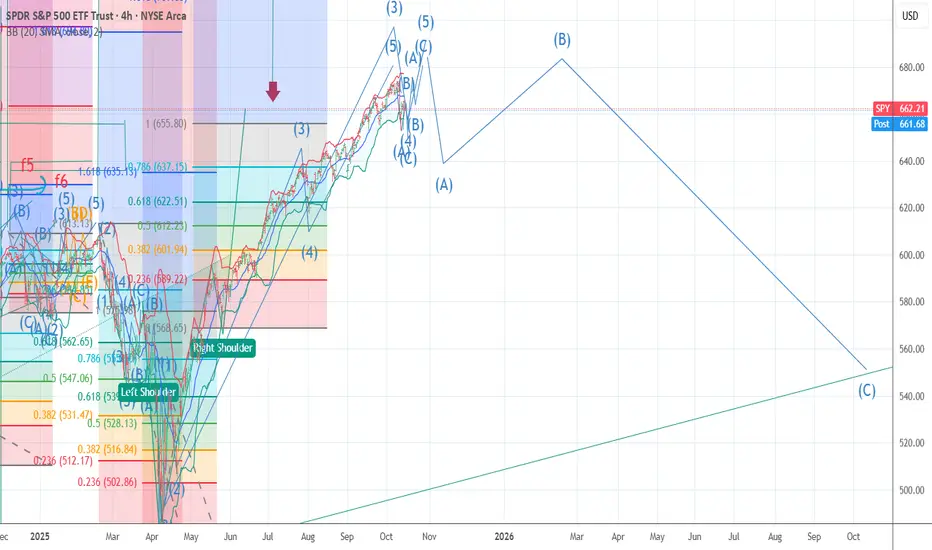
Time for the UPDATE form only !! Well it is time to upload my view since the April 7 low for wave 4 . As most know back on april 7 t=when we were at 4835 I called the bottom is in , the drop of 1312 sp points matched the 2022 drop in wave 2 and that the drop on a PCT basis was exactly .786 as well . I have also stated that this top will be similar to 11/29 /12/6 to 2/18/19 topping so far so good . the low at 6551 was .618 of wave 2 and now we have a e 3 wave rally in the form of an ABC up into .618 . . i think we will see a new record rather soon . in fact odds are high by friday close. but I see rotation and still see the mag 7 leading us into that last pop . I have traded in and out and made some ok $ . . I will now tell you they are going to look to chop up alot of traders in the next 2 weeks .
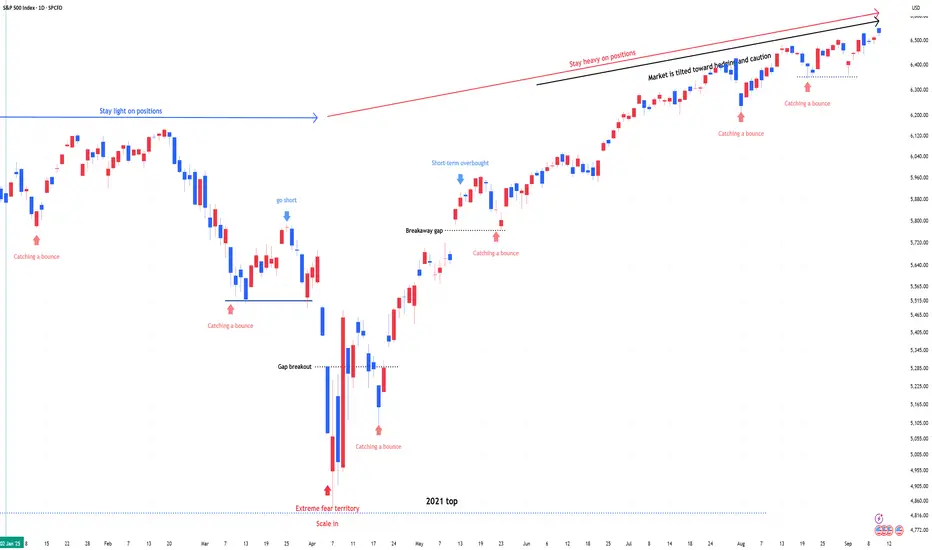
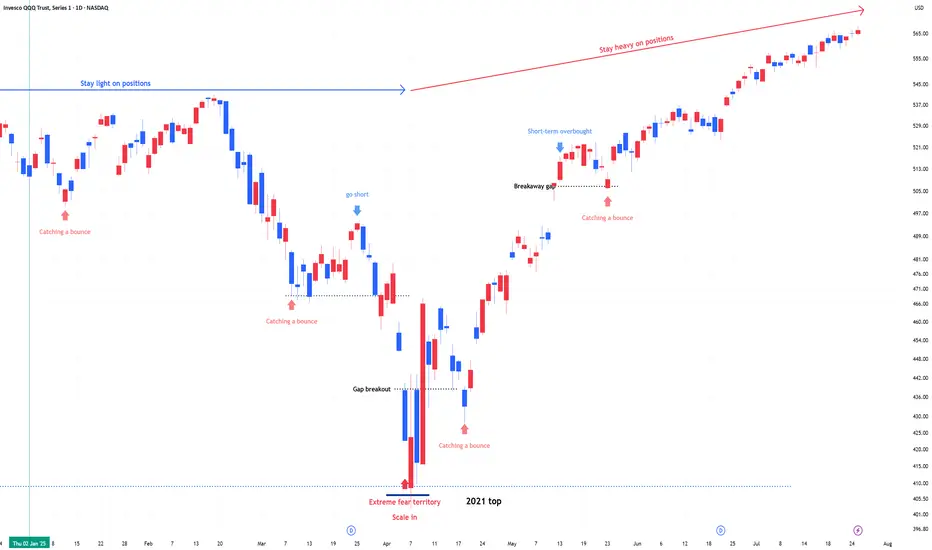
SPX & NDX : Stay heavy on positionsSPX & NDX : Stay heavy on positions (2x leverage)
Same view as before. No change
** This analysis is based solely on the quantification of crowd psychology.
It does not incorporate price action, trading volume, or macroeconomic indicators.
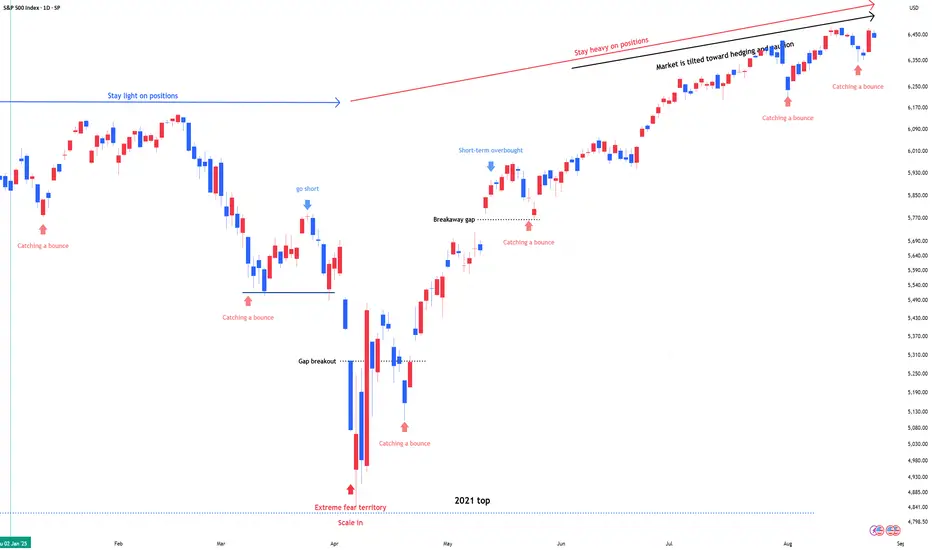
SPX & NDX , Stay heavy on positionsSPX & NDX , Stay heavy on positions (2x leverage)
Currently in a short-term bounce signal zone. Maintaining the same outlook as before.
** This analysis is based solely on the quantification of crowd psychology.
It does not incorporate price action, trading volume, or macroeconomic indicators.
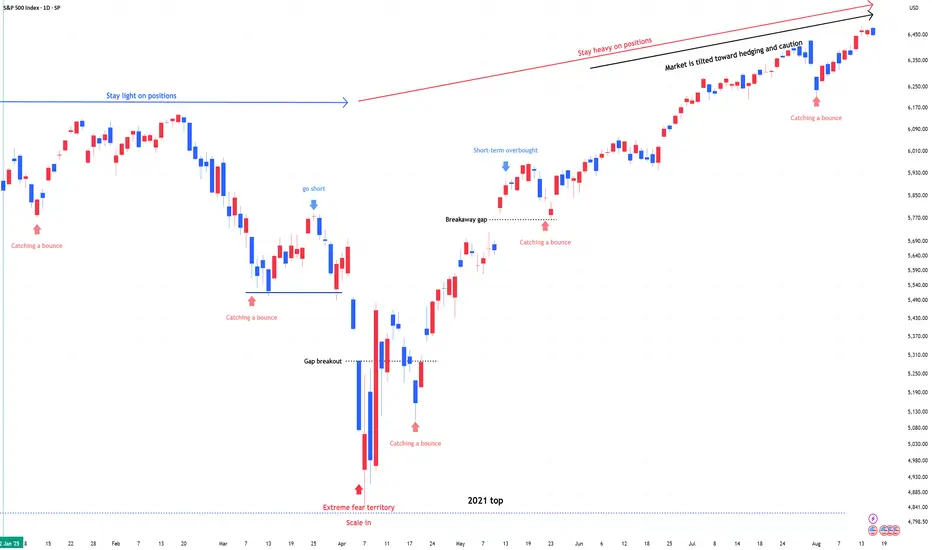
SPX & NDX , Stay heavy on positions.SPX & NDX , Stay heavy on positions. (2x leverage)
Same view as before. No change.
While the market continues to break all-time highs, market participants remain cautious.
Some are even anticipating a pullback in September, and overall, expectations for a correction are widely present.
** This analysis is based solely on the quantification of crowd psychology.
It does not incorporate price action, trading volume, or macroeconomic indicators.
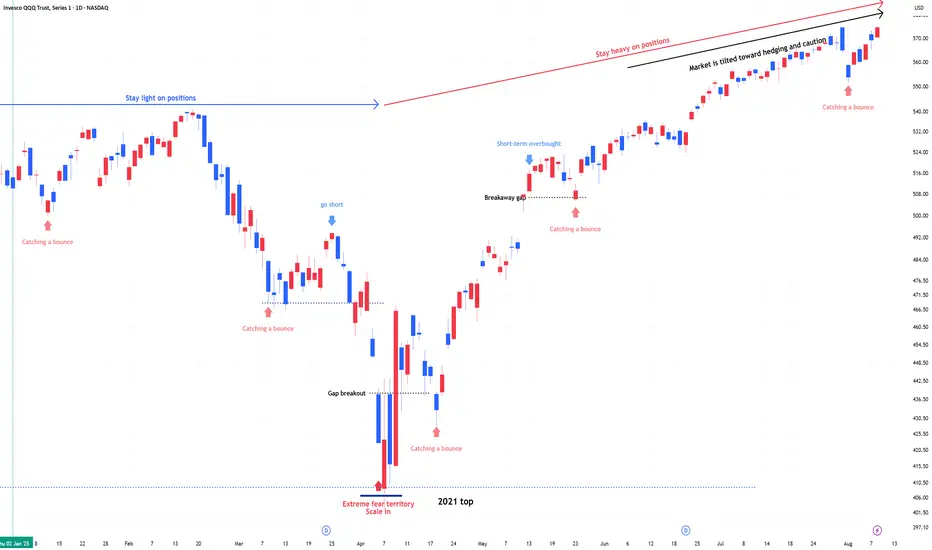
QQQ , Stay heavy on positionsQQQ , Stay heavy on positions. (QLD, TQQQ)
Despite the rebound, the market remains tilted toward hedging and caution.
In stay light on positions zones, I hold QQQ and reduce exposure.
In stay heavy on positions zones, I increase allocation using a mix of QLD and TQQQ.
NDX & SPX , Stay heavy on positionsNDX & SPX , Stay heavy on positions. (QLD, TQQQ)
Despite the rebound, the market remains tilted toward hedging and caution.
In stay light on positions zones, I hold QQQ and reduce exposure.
In stay heavy on positions zones, I increase allocation using a mix of QLD and TQQQ.

QLD, Stay heavy on positions (NDX & SPX)QLD, Stay heavy on positions (+ TQQQ)
In stay light on positions zones, I hold QQQ and reduce exposure.
In stay heavy on positions zones, I increase allocation using a mix of QLD and TQQQ.
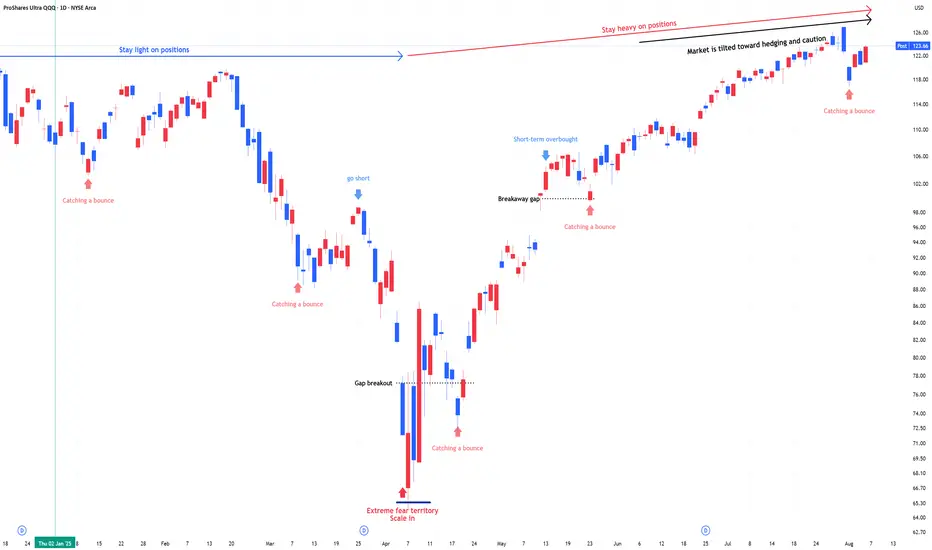
QQQ : Stay Heavy on Positions QQQ, QLD, TQQQ : Stay Heavy on Positions
Amid record-high markets, fear-hedging sentiment is slowly transitioning into renewed risk-taking.
When entering an underweight zone, I rotate out of QLD or TQQQ into QQQ and reduce overall exposure.
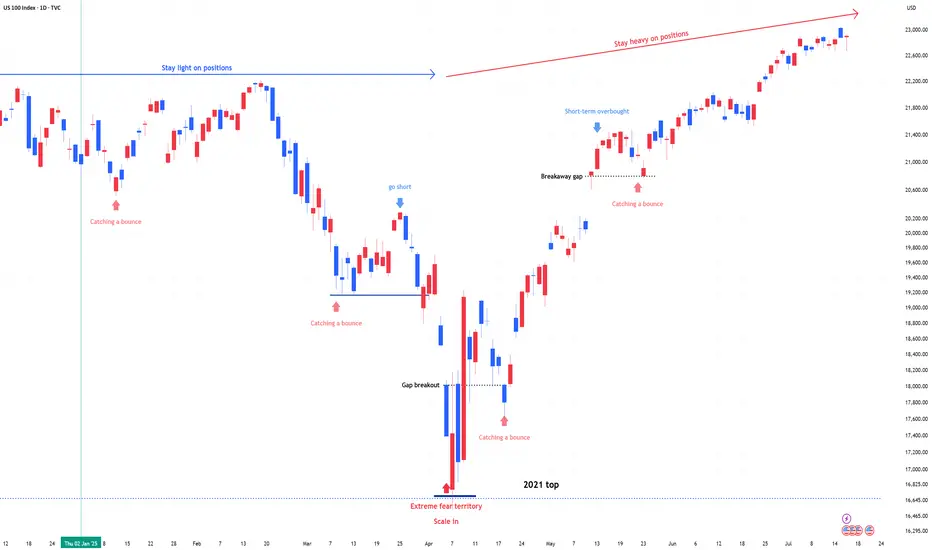
US 100 (NDQ) : Stay Heavy on Positions1) April Fear & Buy Signals
In early April, the Nasdaq 100 experienced a sharp sell-off, triggering extreme fear sentiment across the market.
At that point, scale-in buy signals appeared—classic "buy the fear" conditions.
2) Current Market State: No More Fear, but Watching
Since then, the market has stabilized.
The fear has disappeared, but we are still in a wait-and-see mode as traders assess the next move.
Momentum is holding, but participation remains cautious.
3) Stay Heavy on Positions
Despite short-term uncertainty, I’m maintaining an overweight position on the Nasdaq 100.
As long as we don’t see a major breakdown, the bias remains bullish.
Opportunity Beneath the Fear: SPY's Reversal SetupIn the Shadow of Headlines: SPY’s Drop Could Be 2025’s Big Opportunity
As markets react sharply to renewed tariff fears and Trump-related headlines, SPY continues its descent. Panic is setting in—but behind the noise, a strategic opportunity may be quietly forming.
While many rush to exit, others are beginning to position for the bounce. A well-structured entry strategy could be key to turning uncertainty into gains.
Entry Zone (Staggered):
🔹 543: First watch level—look for signs of slowing momentum.
🔹 515: Deeper entry point as the selloff extends.
🔹 <500 (TBD): Stay flexible—if panic accelerates, this could mark a generational setup.
Profit Targets:
✅ 570: Initial rebound target.
✅ 590: Mid-range level if recovery builds.
✅ 610+: Full recovery potential—rewarding those with patience and vision.
Remember: Headlines fade, but price action and preparation stay. This selloff may continue—but it might also be laying the foundation for 2025’s most powerful move. The key? Enter with discipline, protect your capital, and let the market come to you.
⚠️ Disclaimer: This content is for educational purposes only and does not constitute financial advice. Trading carries significant risk. Always conduct your own research and use proper risk management.

ES Futures Trading Signal - 2025-05-25ES Futures Analysis Summary (2025-05-25)
Comprehensive Summary of Each Model
Grok/xAI Report
Market context: Price $5,875 above 9-, 20-, 21-, 50-day MAs, just under 200-day SMA at $5,804.75; RSI ~59 neutral; price near upper Bollinger Band. Bias: Moderately Bullish, potential breakout above BB. Trade Plan: Long at 5,900; SL 5,840; TP 6,050; 1 contract; confidence 0.65.
Claude/Anthropic Report
Market context: Price above 20/50/200-day SMAs; RSI ~59; MACD histogram slightly negative; healthy pullback within uptrend. Bias: Moderately Bullish. Trade Plan: Long at 5,875; SL 5,825; TP 5,975; 1 contract; confidence 0.68.
Llama/Meta Report
Market context: Price above 20/50-day SMAs, just under 200-day SMA; RSI neutral; BB middle at 5,787.7. Bias: Moderately Bullish. Trade Plan: Long at 5,880; SL 5,810; TP 6,000; 1 contract; confidence 0.65.
Gemini/Google Report
Market context: Price above all key MAs (20/50/200, EMA9/21); RSI neutral; MACD lines above zero but slight bearish cross; recent 24h bounce after 5-day pullback; BB upper at 6,060.7. Bias: Moderately Bullish. Trade Plan: Long at 5,875; SL 5,845; TP 5,935; 1 contract; confidence 0.70.
DeepSeek Report
Market context: Same MAs and indicators, but emphasizes MACD bearish crossover, price rejection at upper BB, recent pullback. Bias: Moderately Bearish near-term. Trade Plan: Short at 5,875; SL 5,925; TP 5,800; 1 contract; confidence 0.65. Areas of Agreement and Disagreement
Agreement:
All models note price trading above short- and medium-term MAs. RSI ~59 (neutral, room to run). BB upper band is resistance; MACD histogram negative. Consensus that recent 5-day pullback is either consolidation (bullish view) or warning sign (bearish view).
Disagreement:
Directional bias: Four models bullish vs. one moderately bearish. Entry levels: range 5,875–5,900. Stop-loss zones: 5,810–5,840. Take-profit zones: 5,935–6,050. Clear Conclusion
Overall Market Direction Consensus: Moderately Bullish Recommended Trade: Long ES futures
Entry Range: 5,870–5,880 (target 5,875) Stop Loss: 5,845 (30-point risk) Take Profit: 5,935 (60-point reward, 2:1 R:R) Position Size: 1 contract (adjust per account risk; ~1% equity) Entry Timing: Market Open Confidence Level: 70%
Key Risks and Considerations:
Short-term bearish MACD crossover may lead to choppy action or minor pullback. Volatility spike at market open can cause slippage. Negative macro or news catalysts can derail technical setup. ES is highly correlated with broader equity futures; cross-asset moves may amplify moves.
TRADE_DETAILS (JSON Format)
{ "instrument": "ES", "direction": "long", "entry_price": 5875.00, "stop_loss": 5845.00, "take_profit": 5935.00, "size": 1, "confidence": 0.70, "entry_timing": "market_open" }
📊 TRADE DETAILS 📊 🎯 Instrument: ES 📈 Direction: LONG 💰 Entry Price: 5875.0 🛑 Stop Loss: 5845.0 🎯 Take Profit: 5935.0 📊 Size: 1 💪 Confidence: 70% ⏰ Entry Timing: market_open
Disclaimer: This newsletter is not trading or investment advice but for general informational purposes only. This newsletter represents my personal opinions based on proprietary research which I am sharing publicly as my personal blog. Futures, stocks, and options trading of any kind involves a lot of risk. No guarantee of any profit whatsoever is made. In fact, you may lose everything you have. So be very careful. I guarantee no profit whatsoever, You assume the entire cost and risk of any trading or investing activities you choose to undertake. You are solely responsible for making your own investment decisions. Owners/authors of this newsletter, its representatives, its principals, its moderators, and its members, are NOT registered as securities broker-dealers or investment advisors either with the U.S. Securities and Exchange Commission, CFTC, or with any other securities/regulatory authority. Consult with a registered investment advisor, broker-dealer, and/or financial advisor. By reading and using this newsletter or any of my publications, you are agreeing to these terms. Any screenshots used here are courtesy of TradingView. I am just an end user with no affiliations with them. Information and quotes shared in this blog can be 100% wrong. Markets are risky and can go to 0 at any time. Furthermore, you will not share or copy any content in this blog as it is the authors' IP. By reading this blog, you accept these terms of conditions and acknowledge I am sharing this blog as my personal trading journal, nothing more.

Rising wedge on SPY - Melt up? or Next leg down? Immediate Bias (Tomorrow):
Scenario 1 – Bullish Continuation (Low Probability unless there's a macro catalyst):
Breaks above ~$596–$598 cleanly
Retests that zone as support (watch 595.50 intraday)
Then targets:
600 psychological
604–608 upper resistance channel
Possible end-of-month blow-off top: 612–618
Scenario 2 – Pullback / Rejection (More Probable Setup):
Rejected at ~596–597 zone (which aligns with upper wedge resistance)
Breakdown below $590 intraday
Then targets:
587.80 EMA cluster (20/50)
If lost → 576.44 next EMA + demand level
Followed by major support at 565.87 / 563.43
🔥 Week Ahead Trade Plan (May 20–24)
✅ Bullish Possibility:
If NVDA earnings, FOMC minutes, or macro data surprise to the upside
Watch for breakout above the red wedge and hold above 600
Target range: 604 → 612 max upside
🚨 Bearish Scenario:
Wedge breakdown below ~$590
Momentum cracks down to:
587
576 (watch for bounce)
If panic selling → 565–563 (larger time frame buying zone)
Volume divergence and overbought EMAs support a potential cool-off.
📅 Monthly Projection (End of May):
If wedge breaks down → consolidation range between 563 – 587
If wedge breaks out → blow-off rally up to 612–620, but likely to fade quickly
Fed commentary and NVDA earnings on May 22 will be major catalysts
📌 Key Levels
Type Price Notes
Resistance (R3) 612–618 Final upside blow-off zone (channel top)
Resistance (R2) 604 Overhead channel line
Resistance (R1) 595–598 Wedge top + major resistance
Support (S1) 587 EMA cluster + strong local demand
Support (S2) 576 Clean structure + prior breakout
Support (S3) 565–563 Confluence of long-term EMAs + trendline
🎯 Trade Setups
📉 Bearish (Favored if no breakout tomorrow):
Short 595–597 with stop above 600
Targets: 587 → 576
Optional: Add below wedge break (~590)
📈 Bullish (Confirmation-based):
Break + retest of 597–600
Target: 604, then scale out at 612
Avoid front-running long unless you see volume + price close outside wedge

SPY Breakout Watch: Triangle Pressure Builds Above 590SPY has surged in a strong V-shaped recovery from the March low of ~480 to testing major resistance around 595–600. The daily chart shows sustained higher highs and higher lows, but price now stalls at a key supply zone with multiple doji candles—signaling indecision. A rising trendline provides strong support near 570.
Zooming into the 60-minute chart, SPY forms an ascending triangle with flat resistance at 590 and rising support from 584. Volume contraction suggests accumulation, priming a potential breakout. A 60-min close above 590 targets 596, with a stop under 588.
On the 15-minute timeframe, bull-flags form frequently after morning gaps, with breakouts typically launching 4–5 points higher. VWAP and the 20-MA converge near 588.5, making it an ideal pullback entry zone.
Strategy for May 19–23:
Long on a clean breakout above 590 (target: 594–596)
Stop under 587.5–588
Caution if daily closes below 570
Expect early-week upside tests of 590–594, followed by a potential breakout toward 595–600. If a high-volume rejection occurs near that zone, a quick scalp-short may be in play.

SPY Technical Outlook – Bullish Continuation Favored Above $584SPY remains in a strong uptrend, confirmed by a bull flag breakout on the daily chart, with price currently testing the $588–590 resistance zone. A rising channel on the hourly chart has guided price since early May, with repeated bounces off the lower trendline around $578–582. Recent volume expansion on breakouts reinforces bullish conviction.
On the 15-minute chart, a breakout and retest setup around $585–586 suggests a low-risk intraday long opportunity. The intraday VWAP and moving averages support this level, with momentum favoring a push toward $590. A failure to hold $584 could open downside to $582 or $578.
The near-term trading bias remains bullish above $584, with targets of $590–592. Short-term traders should look to buy defined pullbacks with tight risk, while watching for volume to confirm continuation. If $590 breaks with strength, swing targets extend to $595–600. Conversely, a breakdown of the hourly channel would favor quick shorts targeting support zones below.

S&P 500 Index Most Bullish Signal In 15 YearsThis is why it is very clear, certain, that the stock market, the S&P 500 Index (SPX) is set to grow in the coming months. Last week produced the highest volume session, on the bullish side, since April/May 2010, that's 15 years. Back then, when this signal showed up, this index went to grow for years non-stop.
The SPX also produced the strongest weekly session in several decades, maybe the strongest week ever, and a bounce happened (support found) exactly at the 0.618 retracement Fib.
This is all we need to know. When the bulls enter the market and do so with force, it is because the market is set to grow. The correction produced decline of 21%. This is pretty standard. The fact that the correction happened really fast, it means that it will also have a fast end.
The low is in. The correction is over. The S&P 500 Index is set to grow.
You can be certain. If you have any doubts, just ask the chart.
Namaste.

SPY in Focus: Tactical Day Trading Amid a Bullish RecoveryAs of early May, SPY consolidates around $560–$570, testing former support-turned-resistance.
On the daily chart, the market is pausing after a rapid rally, with $610 as major resistance and $540–$485 as key support. The 1-hour chart reflects a solid uptrend with recent consolidation between $555–$568, while the 15-minute chart shows intraday weakness with critical support at $560.
Three trading strategies emerge: (1) Bullish breakout, buying above $564–$568 with targets up to $580;
(2) Bearish breakdown, shorting below $560 with downside to $545; and
(3) Range trading, buying/selling within $558–$568 using tight stops. Confirmation via volume and candlestick patterns (e.g., engulfing or hammer) is essential.
Short-term bias is bullish, but with caution—if SPY holds $560, it could retest $570 or break higher. A drop below $556 invalidates the bullish outlook.

SPX Fractal Expansion: New Highs Ahead Despite FearAs of April 14, 2025, the CBOE:SPX is exhibiting a clear fractal expansion, suggesting the beginning of a new bullish leg. The recent correction, which caused widespread panic, appears to have completed a fractal cycle reset, with price respecting historical support near 4704 and forming a new fractal edge around 5300.
Despite the fear-driven selloff, momentum indicators like RSI and MACD show signs of bottoming, and volume surged on rebound days, confirming strong institutional buying. The price is now testing temporary resistance at 5878, with a path open to reclaim all-time highs (6100+).
Global & Technical Tailwinds
Technical momentum is recovering across timeframes, with positive divergence on stochastic oscillators.
Breadth is improving: More stocks are participating in the rally, reflecting internal strength.
Sentiment has flipped: The VIX has cooled from panic levels (above 45), and investor fear is easing.
Macro support: Inflation is declining, and central banks are signaling potential rate cuts by late 2025.
Earnings outlook remains solid, and analysts forecast SPX to end 2025 around 6500–7100.
🔍Conclusion
The SPX is carving out a fractal mirror of past bullish reversals, reinforced by strong macro and technical context. Barring unexpected shocks, the index is likely to break above resistance and push toward new highs, even as residual fear lingers. The setup favors buying dips within this emerging structure.

SPY LONG SET UP(BUY THE DIP)Entry 1 $500.00
Entry 2 $460.00
Stop loss $440.00
Take profit 1- $550.00
(Close 25%)
Take profit 2- $600.00
(Close 50%)
Take profit 3-$650.00
(Close 75%)
Take profit 4-$700.00
(Close 100%)

SPY Technical Outlook - Will Buyers Step In?AMEX:SPY is experiencing a corrective move after rejecting the upper boundary of the ascending channel. This rejection led to increased selling pressure, bringing price back to the lower boundary of the channel, where buyers may step in to defend the trendline support.
If the price holds at this dynamic support level, a bullish reaction could send AMEX:SPY toward the midline of the channel, with the next target around 607.00. Holding above this level would reinforce the bullish trend structure and increase the probability of continuation toward the upper boundary of the channel.
However, a breakdown below the trendline support would weaken the bullish outlook and open the door for further downside. Monitoring price action, volume, and confirmation signals will be crucial in determining the next move.
