STG Stargate Finance PriceT after Court approves FTX LiquidationGiven the recent developments in the crypto space, there are several factors that point towards a bearish outlook:
FTX Liquidation of $3.4 Billion in Crypto Assets: The approval by the Delaware Bankruptcy Court for FTX to liquidate $3.4 billion in crypto assets is a significant event. This influx of a substantial amount of cryptocurrency into the market could potentially lead to an oversupply situation. When a large amount of assets is dumped into the market at once, it can put downward pressure on prices.
Limited Sales in the First Week: The imposed limit of $50 million for the first week indicates a controlled release of these assets. This may imply that FTX anticipates potential market disruption if a large volume is sold at once. However, even with controlled release, the market could still experience downward pressure.
Potential for Increased Limits: The provision for increasing the limit with the approval of the creditors’ committee and ad hoc committee, or potentially even up to $200 million weekly with court approval, shows that there's room for further selling pressure in the coming weeks.
Binance US CEO Resignation: The resignation of Binance US President and CEO, Brian Shroder, could potentially signal internal challenges within the exchange. Leadership changes in major crypto exchanges can lead to uncertainty and can impact market sentiment.
Asset List: The assets listed for liquidation include some of the major cryptocurrencies in the market such as Bitcoin, Ethereum, WBTC, WETH, USDT, SOL, XRP, STG, APT, BIT, DOGE, MATIC, FTT, TON and more. If a significant portion of these assets are sold off, it could have a widespread impact on the market.
Market Sentiment and Confidence: These events combined might lead to a loss of confidence in the crypto market, especially if investors perceive them as signs of instability or potential oversupply.
Regulatory Considerations: The fact that a bankruptcy court is involved in this process highlights the regulatory environment surrounding cryptocurrencies. Heightened regulatory scrutiny or intervention can have a dampening effect on the market.
Considering the above, my Price Target for STG Stargate Finance is $0.35.
Looking forward to read your opinion about it.
STGUSDT

$STG Looks Good for Day trade From the heart of the cosmos, a powerful alliance forms! 🌌
Welcoming
@StargateFinance
as our premier partner in the first Saga. Here's to the start of our #GalacticSynergy journey.
Who's next? Guess and be the lucky winner of 5000 $WIGO!

Retest support | 0.64Daily chart
Stargate Finance ( BINANCE:STGUSDT ) is pulling back to 0.64
Chart 4H TF
STG's a confluence around 0.64
Wait for a next move

STGUSDT rejected by daily resist, may bounce from hourly supportThe price has bounced well from the daily support zone DS1 and hit the daily resistance level DR1. From that resistance level DR1, the price is experiencing a pullback which might lead the price to reach upto hourly support zone 1HS1. I expect the price to bounce from there again to ai, the daily resistance DR1 and therefore a long shall be favorable from that support 1HS1. I also expect the price to aim for the confluence of monthly and weekly resistance MR1+WR1 sooner or later. But lets first look at the first target of DR1.

Finally Stg Long Consolidation Is Over Seems Like ready for Bullish Impulse Falling Wedge Breakout Has Already Confirmed Expecting Move Towards 1.50$ In Coming Days

STGUSDTSTGUSDT is trading in bullish parallel channel and price is quiet respecting channel high and low along with 100EMA. currently the price is retracing a bit and creating a support for another bullish impulse.

STG LOOKS BULLISHHi, dear traders. how are you ? Today we have a viewpoint to BUY/LONG the STG symbol.
For risk management, please don't forget stop loss and capital management
When we reach the first target, save some profit and then change the stop to entry
Comment if you have any questions
Thank You

AB=CD STGUSDT LONG Got my long entry for 6.24 RR ON stgusdt
My stop is breaking C point .
Expecting bullish move for this coin

STG ANALYSIS Hi, dear traders. how are you ? Today we have a viewpoint to BUY/SELL the STG symbol.
For risk management, please don't forget stop loss and capital management
When we reach the first target, save some profit and then change the stop to entry
Comment if you have any questions
Thank You

Stg It's Over Stgusdt
Losing Support / No Volume
Expecting Breakdown incase of successful breakdown it will drop 40-60%

STGUSDT Bullish Scenario: Potential 34% Increase#STGUSDT continues to show a strong long-term uptrend, which has been validated by the recent bounce off the uptrend trendline. This is a bullish signal and indicates that the price of #StargateFinance is likely to continue its upward trajectory in the near future.
Additionally, the recent rejection of the 88.6% Fibonacci support level, which also corresponds to the VolumeProfile support, further strengthens the bullish scenario. This indicates that there is significant demand for #STG at this price level and that buyers are stepping in to support the market.
Overall, the $0.70 price level is a critical demand zone for #STG, and as long as it holds, we can expect the price to continue its upward momentum towards the April high. This presents a potential 34% price increase in the mid-term, making it an attractive opportunity for traders and investors alike.

Waiting for a confirmation to open positionDaily TF
STG's going to support zone.
Just waiting for a confirmation for Long/Short Order in lower TF
Wait and see
STGUSDT LONG IDEAIt seems that STG has changed its trend from downtrend to uptrend by changing the character and making higher low and higher high.
⚠️ Disclaimer: This chart and analysis are not meant to be, and do not constitute financial, investment, trading, or other types of advice or recommendations. #DYOR

STGUSDTHow do you do,
*Mars Signals Team wishes you high profits*
This is a one-day-time frame analysis for STGUSDT
Clearly, R4, R3, and R2 are the resistance areas in this chart with their presentation of the disability of the price to rise at several points. R1 used to be a support area. And S1 is our support area at the bottom that contains the support of price at some different points. As it is shown in the chart, the price experienced a severe fall down to S1 and by the time it was not able to rise above R3 at several points, it had a rejection and decline each time after touching the mentioned area. Then when it was rejected at R3 for the last time and by receiving support at S1, it rose again toward our first resistance area. Thus, it is fluctuating in R1 area now and we predict it to provide us two scenarios. One of them is breaking R1 upward and by giving us some fixation and fluctuation, more rise is there for it to touch higher amounts including R2 or R3. But by the time the price falls below R1 and loses the support, definitely more decline will happen then. According to the chart, we believe the price would have some correction and it is possible to fall toward S1 and then start another rise upward. Please consider the market situation in lower time frames and then decide what to do exactly. We suggest you to save your profits in the resistance areas due to the fact that in the decline of the price, you will not have so much loss. Keep moving with our updates and analyses to have multiple pieces of information and ideas.
Warning: This is just a suggestion and we do not guarantee profits. We advise you to analyze the chart before opening any positions.
Wish you luck

STGUSDT - Short Scalp- Price creates Buy Side Liquidity on the 1H TF, then clears this liquidity by taking out its highs
- Price then retraces back down with displacement (aggressive selling) on the 15m TF, taking out multiple lows on the way down
- Price moves back up to the 5m FVG that is in the premium zone (above the 50% FIB) and we go short here
- SL set a few ticks above the 5m FVG and TP set to 1H Sell Side Liquidity

STG/USDT🔵🐇 #STG/USDT
📍as you can see we have a bullish divergence around a main liquidity and we have a Liquidity magnet zone as a resistance that not filled yet
🪄#Stargate Position Based On Fresh Liquidity and Order Blocks and Structures
#eth #btc #bitcoin #ethereum #cryptocurrency #crypto #Trade #trading #Invest #Trader #Signal #forex #Scalp #altcoins #chart #RTM #ICT
@aliceinmoneyland

STGUSDT - Stargate by LayerZero with $120M Series B FundingLayerZero Labs recently raised $120 million in a Series B round, with participation from big names like a16z crypto, Christie's, Circle Ventures, OpenSea Ventures, Samsung Next, and Sequoia Capital, among others. This funding round has catapulted LayerZero Labs to a remarkable $3 billion valuation.
STG chart looks ready to fly to hit $1.15 which will be +40% from current price.
What's gonna stop STG from flying?

Triangle wave before drop 0.45STG's happening the triangle wave ABCDE without D & E waves hadn't complete.
Need to wait for that two waves to confirmed triangle wave.
Wait and see

STG LONGThe coin found support on 200 ema
Very important to see D TF close above 0.7480 to open Long position

Stg | Looks promising hereStgusdt
Looks like a breakout is happening but we have to be patient. Many people rush into a situation like a breakout but always pro traders wait for the next candles, we will also wait for the next candles, if the buyer activity continues I am expecting a bullish move. action In case of a fake out, the next support which is the green trendline support will be our entry.
This is just our opinion, Allah knows best.
Remember: We only give ldea's from our
experience and knowledge, it does not
mean that it will be 100% correct, the
market is always unpredictable, anything
can happen anytime.
Always trade with your own research and
knowledge. If You Are Satisfied With Our
Work Then Join & Take Our Entry

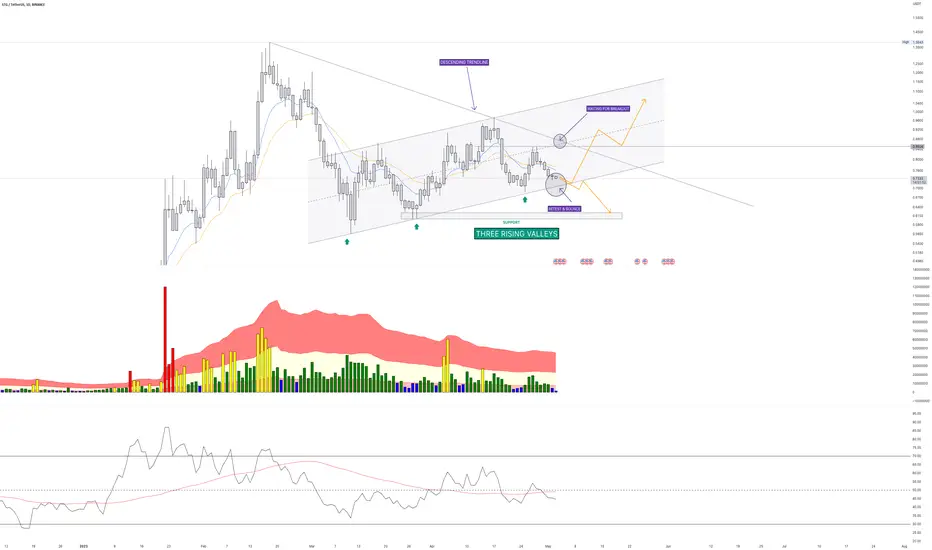
STG sitting on strong trendline supportSTG sitting on strong trendline support!
Wait for Breakdown with Retest or Bounce for Long or Short

Consolidation in range 0.62 - 0.73Hi traders,
BINANCE:STGUSDT might go down 0.62 before go up.
- Hidden Divergence Price, Volume and RSI
- Confluence MA50 and Resistance Zone at 0.382 FibRe
Wait and see next move

STGUSDTHey traders, here is the analysi.
If you guys like my analysis please hit like👍 and follow.
Thanks.
DISCLAIMER- This is not financial advice.
SMART MONEY CONCEPT
