Micron Technology - This bullrun is still not over!💵Micron Technology ( NASDAQ:MU ) can rally a final +25%:
🔎Analysis summary:
Micron Technology retested major support in mid 2025. After we then witnessed textbook bullish confirmation, it was clear that this stock will rally. With the recent move of +300%, Micron Technology is almost back at major resistance, but it can rally another +25% first.
📝Levels to watch:
$300
SwingTraderPhil
SwingTrading.Simplified. | Investing.Simplified. | #LONGTERMVISION
Stockmarketanalysis

Somethings Off. Santa Clause Rally Ending In Sync w/Dollar Drop?Trading Fam,
Providing a quick update on a few new and alarming chart events and indications I am seeing. Usually, when the dollar drops, as long as the VIX remains low, stocks and crypto will rise. However, an anomaly is currently occurring on the charts. As stocks seem to be topping, the dollar is also testing major 17 year and 42 year support! I am not quite sure how to read this, but it seems that in this case, we could see stocks drop along with the dollar. How could this happen? Unknown. Could it have something to do with BRICS? Could it have something to do with the upcoming Fed decision? I honestly don't know how to answer this. I am simply just reading what the charts are showing me and telling you what it might mean for stocks and crypto.
Let's dive in!
✌️Stew

VIX mid-term TAI've been watching VIX closely since September, and the accumulation has been growing since then and it's not stopped yet, it looks like it set double top and currently is cooling down but the indicators are still very strong and they don't get that strong that often on daily time frame, the VIX may look like it's cooling down for a holiday cheer but it didn't go away yet. So be prepared for a possible volatility to hit again.

Review and plan for 2nd December 2025Nifty future and banknifty future analysis and intraday plan.
This video is for information/education purpose only. you are 100% responsible for any actions you take by reading/viewing this post.
please consult your financial advisor before taking any action.
----Vinaykumar hiremath, CMT

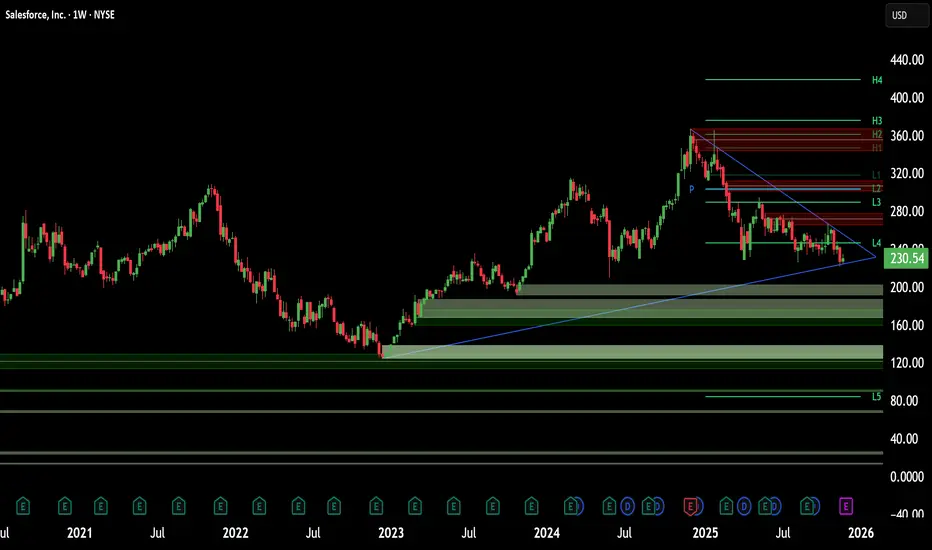
Salesforce’s AI Pivot: The Rise of the Agentic EnterpriseSalesforce (CRM) stands at a pivotal intersection of software legacy and artificial intelligence innovation. Despite a year-to-date stock correction of 32%, the company’s fundamentals tell a story of aggressive evolution. The cloud pioneer is systematically re-engineering its DNA to dominate the "Agentic Era." Investors focusing solely on the current share price of $227 may miss the underlying structural shift. With Q3 earnings approaching, we analyze the multi-domain drivers fueling Salesforce’s fundamental ascent.
Financial Resilience: Economics & Business Models
The subscription economy remains Salesforce's financial fortress.
In Q2 Fiscal 2026, the company generated $10.2 billion in revenue, a 10% annual increase. Crucially, $9.7 billion of this flowed from stable subscriptions and support. This recurring revenue model insulates the company against macroeconomic volatility. Furthermore, management’s focus on operational efficiency drove adjusted earnings per share (EPS) to $2.91, beating prior periods. This discipline balances aggressive R&D spending with shareholder returns, a vital equilibrium in high-interest rate environments.
High-Tech & Science: The "Agentic" Shift
Salesforce is redefining the science of work. CEO Marc Benioff envisions an "Agentic Enterprise" where human workers and AI agents collaborate seamlessly. This is not theoretical; the Data & AI division’s revenue more than doubled to $1.2 billion last quarter. The company’s proprietary platform, Agentforce, utilizes advanced Large Language Models (LLMs) to automate complex workflows. This moves beyond simple chatbots to autonomous agents capable of executing multi-step tasks in sales and service.
Patent Analysis: We anticipate a surge in IP filings regarding "autonomous agent orchestration" as Salesforce builds a legal moat around this technology.
Strategic M&A: Technology & Cyber
Data is the fuel for AI, and Salesforce just bought a bigger pipeline. The recent acquisition of Informatica secures critical cloud data management infrastructure. This strategic move allows Salesforce to ingest, clean, and secure vast datasets from disparate sources.
Cybersecurity Implication: By controlling the data layer, Salesforce offers a "walled garden" for enterprise clients. This reduces cyber risk and ensures data governance, a primary concern for Fortune 500 CIOs adopting AI.
Geopolitics & Geostrategy: Middle East Expansion
Salesforce is aggressively diversifying its geographic footprint. The recent launch of an Arabic version of Agentforce signals a strategic pivot toward the Middle East. This region is currently investing heavily in digital transformation to diversify away from oil dependence. By providing localized, AI-driven automation, Salesforce embeds itself into the infrastructure of emerging economic powers. This reduces reliance on Western markets and taps into sovereign wealth capital flowing into technology.
Management & Leadership: Culture of Innovation
Leadership is driving a forced evolution. Benioff is pivoting the company culture from "Cloud First" to "Agent First." This cultural shift is difficult but necessary to avoid obsolescence. The integration of Informatica and the push for $60 billion in revenue by 2030 demonstrate a long-term commitment to growth. Management is willing to sacrifice short-term margins for long-term dominance in the AI application layer.
Outlook: The December Catalyst
All eyes turn to Wednesday, December 3. Salesforce will release its Q3 2025 earnings after the bell. Analysts expect revenue of $10.27 billion and further EPS growth. The market will scrutinize the adoption rates of Agentforce and cloud subscription metrics. A positive report could validate the "Agentic" strategy and reverse the stock's recent bearish trend. For the strategic investor, Salesforce represents a disconnect between current sentiment and fundamental reality.
NOV.30,2025 ANALYSIS ON SPX500 & NAS100 INDICES The monthly charts have printed hanging man candles and hence if the closing of next month candle is below the body of the candle, it will confirm that the rally is over and the next months have a bearish setup. Indicators also support the rally is over based on the weekly and daily charts on both indices.
The weekly candle looks bullish but since the volume is low it does not confirm the rally and is a market maker manipulation setup for retail traders. For shorts bias use tight stop loss, price should not exceed the invalidation levels noted in the video.
The daily charts also show a hidden bearish divergence on MACD Histogram bars, Stochastic cycle & Momentum at fib resistance of 0.786 retrace and Oct, 2023 fib extension of 1) for the SPX500 and fib 0.618 retrace for the NAS100. Daily Stoch cycles support shorts more than long. Price uprise since Wed, Nov 26th, has been on declining momentum, see MACD histogram on 4H. RSI is overbought on 4H with a hidden bearish divergence too.
So, I see more bearish signal on the indices than bullish continuation.
Thank you again for supporting my publications and consider giving my publication a boost and comment with your own insights too. Iron sharpens Iron, let conquer the market together. Cheers !!

14% Yield: Monthly Income or Ticking Time Bomb?AGNC Investment defies standard market logic. While the S&P 500 offers meager yields, AGNC delivers a staggering 14% . This payout is ten times the market average. Furthermore, the firm pays monthly, attracting income-focused investors globally. However, high yield often signals high risk. Investors must dissect the financial engineering behind this Real Estate Investment Trust (REIT) to determine its sustainability.
Business Models and Financial Innovation
AGNC operates differently from traditional landlords. The company does not own physical properties. Instead, it deploys a complex "Financial Engineering" model focused on Agency residential mortgage-backed securities (MBS).
Government-sponsored enterprises like Fannie Mae and Freddie Mac guarantee these pools of mortgages against credit loss. This structure makes the assets inherently low-risk. To generate double-digit returns from low-yielding assets, AGNC utilizes significant leverage. They fund operations primarily through repurchase agreements, amplifying both potential returns and volatility.
Macroeconomics and The "Alignment" Metric
Standard earnings metrics often fail to value Mortgage REITs (mREITs) accurately. The critical economic indicator for AGNC is the alignment between its Cost of Capital and Return on Equity (ROE) .
In the third quarter, AGNC achieved a critical equilibrium. The company’s cost of capital stood at 17% . Simultaneously, new MBS investments generated an ROE between 16% and 18% . This mathematical alignment suggests the current dividend is supported by actual cash flows, despite the net spread per share ($0.35) trailing the quarterly dividend payout ($0.36).
Management and Strategic Leadership
AGNC leadership is aggressively capitalizing on favorable industry trends. CEO Peter Federico maintains a "constructive outlook," citing manageable supply and growing demand for MBS.
Management proved this confidence by executing a massive capital raise in Q3. The firm completed a $345 million preferred stock issuance, the largest by an mREIT since 2021. Additionally, they issued over $300 million in common stock at a premium. This liquidity injection allows leadership to purchase high-yielding assets immediately, securing future revenue streams before market conditions shift.
Geostrategy and Market Risks
While the current environment is robust, the mREIT business model remains sensitive to broader geopolitical and economic shifts. Interest rate volatility, driven by Federal Reserve policy or global trade tensions, can disrupt the Repo market.
History serves as a warning. AGNC has cut dividends previously when borrowing costs spiked faster than asset yields, most recently in 2020. A sudden "misalignment" between funding costs and asset returns would threaten the payout again.
Investment Verdict
AGNC represents a high-reward play for risk-tolerant portfolios. The dividend rests on a stable foundation today, supported by strong capital alignment and aggressive management. However, this is not a "set it and forget it" stock. Investors must actively monitor interest rate spreads to ensure the dividend remains viable.

Micron Technology - The end will come soon!✂️Micron Technology ( NASDAQ:MU ) will create a top soon:
🔎Analysis summary:
Starting back in mid 2025, Micron Technology retested a major confluence of support. This retest was followed by an expected rally of about +250%. But soon, Micron Technology will create a short term top formation, followed by a healthy correction towards the downside.
📝Levels to watch:
$250
SwingTraderPhil
SwingTrading.Simplified. | Investing.Simplified. | #LONGTERMVISION

S&P 500 Roadmap: Correction Rally Ending—Another Drop Is ComingAs I expected in the previous idea , the S&P 500 index( SP:SPX ) moved toward the broken Support lines and completed its pullback, reaching its targets.
Given that the S&P 500 index nowadays shows a significant correlation with the cryptocurrency market and Bitcoin( BINANCE:BTCUSDT ), it’s wise to pay even more attention to this index, as it can help us gauge the crypto market trends.
The S&P 500 is approaching a Resistance zone($6,675_$6,637), and considering the momentum of last weekend’s decline, it appears that this recent upward movement is merely a correction. Therefore, we should expect another decline in the S&P 500.
Since the U.S. dollar index( TVC:DXY ) is also likely to maintain an upward trend, the rise in the dollar can lead to more capital flowing into safer assets, potentially impacting the S&P 500 negatively.
The S&P 500 is also influenced by the US 10-Year Government Bond Yield( TVC:US10 ). If the US 10-Year Government Bond Yield trends upwards , then riskier assets like cryptocurrencies might go down more, and this, in turn, could also impact the S&P 500.
Considering all the above, I expect that the S&P 500 will at least test its Support zone($6,580_$6,490) again and, if that Support zone($6,580_$6,490) is broken, we could anticipate further declines in the U.S. stock market and the S&P 500.
First Target: $6,526
Second Target: $6,413
Stop Los(SL): $6,731
💡 Please respect each other's opinions and express agreement or disagreement politely.
📌S&P 500 Index Analyze (SPX500USD), 4-hour time frame.
🛑 Always set a Stop Loss(SL) for every position you open.
✅ This is just my idea; I’d love to see your thoughts too!
🔥 If you find it helpful, please BOOST this post and share it with your friends.

QQQ long-term TAQQQ has broken mid-term uptrend, and it's currently in distribution phase, we have to give it some time to find the bottom, weekly uptrend is still in place.
P.S.
There are many other indicators that are being used for this TA, the above snapshot is only an example.

Rising 10_Yields Ahead?Here’s How It Could Hit BTC, Gold, StocksWhy the US 10-Year Yield Matters
The US 10-Year Treasury yield is one of the most important benchmarks in global finance. It reflects investor expectations for inflation, growth, and Federal Reserve policy. Because it influences everything from mortgage rates to equity valuations and the strength of the US dollar( TVC:DXY ), understanding its direction helps traders anticipate major market shifts.
Key Scenarios to Watch
1. Yield Rising (Bullish Yield / Bearish Bonds)
Signals stronger economic expectations or sticky inflation.
Usually pushes the USD higher and puts pressure on risk assets like tech stocks and crypto.
Markets begin pricing fewer rate cuts or even potential tightening.
2. Yield Falling (Bearish Yield / Bullish Bonds)
Indicates rising recession risk, softer inflation, or expectations of Fed rate cuts.
Supports equity markets and risk assets (including crypto).
Typically weakens the US dollar.
3. Sideways / Stable Range
Suggests economic uncertainty or balanced expectations.
Markets remain in consolidation until new macro data or Fed signals arrive.
Why Traders Follow It:
Small moves in the 10-year yield can shift global liquidity, risk sentiment, and currency flows — making it a core indicator for forecasting market direction.
Given the current data and signals, my short-term forecast is for yields to remain flat or move slightly higher, but the likelihood of a significant decline in the near term seems slim.
-----------------------------------------------------
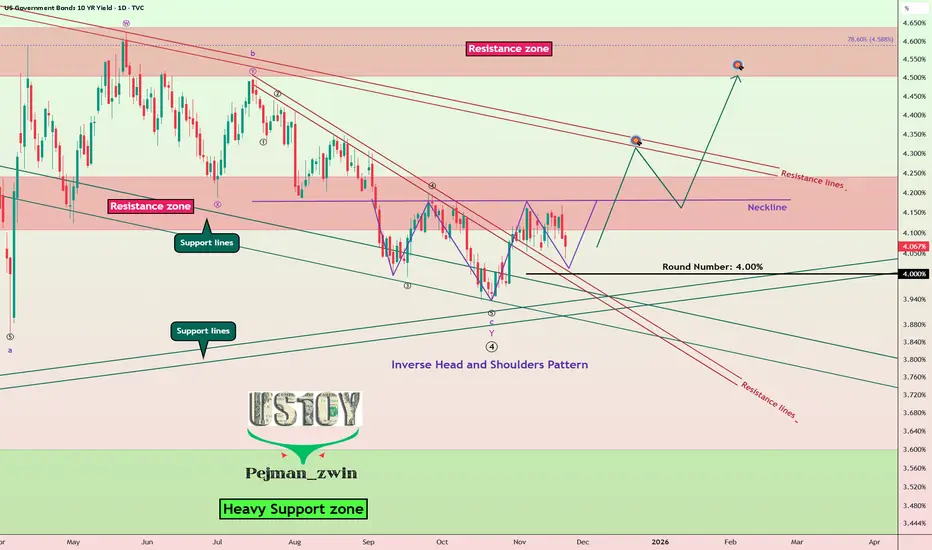
Now let's take a look at the US 10-Year Government Bond Yield chart on the daily time frame.
The US 10-Year Government Bond Yield is currently moving near the support lines and the 4.00% (Round Number).
In terms of classic technical analysis, we can expect that the US 10-Year Government Bond Yield's uptrend could start with an Inverse Head and Shoulders Pattern.
In terms of Elliott Wave theory, it appears that the US 10-Year Government Bond Yield has succeeded in completing the main wave 4 with a Double Three Correction(WXY).
I expect the US 10-Year Government Bond Yield to attack Resistance lines after breaking the Neckline and Resistance zone(4.24%-4.14%).
-----------------------------------------------------
Impact of a Rising US 10-Year Yield
•Bitcoin( BINANCE:BTCUSDT ):
A higher 10-year yield usually reduces liquidity and increases funding costs, which puts pressure on risk assets. BTC typically faces short-term downside or slower momentum when yields rise.
•Gold( OANDA:XAUUSD ):
Gold often moves inversely to yields. Rising yields increase the opportunity cost of holding gold, making it less attractive. This usually leads to weakness or consolidation in gold.
•Stocks (Equities):
Higher yields tighten financial conditions and lower valuations, especially for tech and growth stocks. Equities generally face selling pressure when yields rise sharply.
If you would like to see technical analysis on the weekly timeframe, I recommend you take a look at the link below.👇
-----------------------------------------------------
💡 Please respect each other's opinions and express agreement or disagreement politely.
📌US 10-Year Government Bond Yield Analyze ( TVC:US10 ), Daily time frame.
🛑 Always set a Stop Loss(SL) for every position you open.
✅ This is just my idea; I’d love to see your thoughts too!
🔥 If you find it helpful, please BOOST this post and share it with your friends.
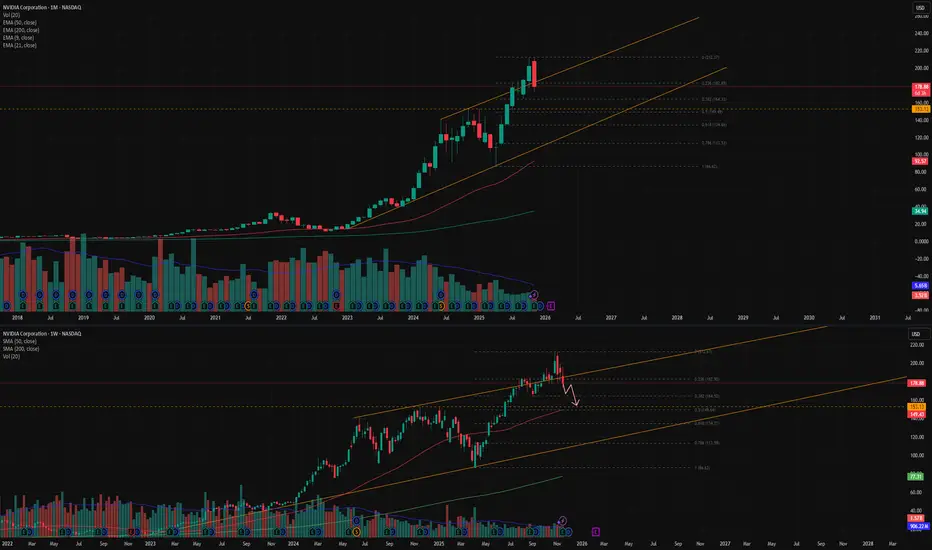
NVDA ALERT: Critical Drop AheadNvidia remains in a broader uptrend, but the chart shows a clear trendline breakout followed by the beginning of a pullback.
Using Fibonacci, a correction typically starts after a red candle forms following a sequence of green candles. In most cases, the pullback continues toward the 0.5 retracement level. In this setup, the 0.5 level aligns with a major key support, increasing its importance.
On the weekly timeframe, the 50 EMA is also converging at the same zone, which often acts like a magnet for price. This creates multiple confirmations pointing toward a potential move downward.
The weekly chart has printed a bearish engulfing , followed by three consecutive red candles, adding another strong confirmation for a continued correction.
Both MACD and RSI are sloping downward, supporting the bearish momentum.
If price reaches the expected zone, monitoring the reaction will be critical. A deeper decline into the global trendline is possible only if the key level is broken, though this scenario appears less likely.
Overall, NVDA shows several aligned signals indicating a move toward the correction zone before any potential recovery.
S&P 500 Reversal Roadmap: Second Bottom Forming at PRZ?As I expected in the previous idea , the S&P 500 index has indeed reached its targets after breaking through the Support lines .
Currently, the S&P 500 is approaching the Support zone($6,580_$6,490) , Potential Reversal Zone (PRZ) , and the 100_SMA(Daily) .
There’s a possibility of forming a second bottom and a descending channel in the S&P 500, suggesting that the second bottom could form near the PRZ .
From an Elliott Wave perspective, it seems that the S&P 500 is completing the microwave 5 of the microwave C of the main wave Y .
I expect that, after entering the PRZ or approaching the 100_SMA(Daily) , the S&P 500 will resume its upward movement and potentially rise to around $6,664 .
Note: The S&P 500 currently has a significant impact on the markets, especially cryptocurrencies like Bitcoin( BINANCE:BTCUSDT ). Therefore, a potential rise in the S&P 500 could positively influence Bitcoin as well.
First Target: $6,664
Second Target: $6,723
Stop Los(SL): $6,499
Please respect each other's ideas and express them politely if you agree or disagree.
S&P 500 Index Analyze (SPX500USD), 1-hour time frame.
Be sure to follow the updated ideas.
Do not forget to put a Stop loss for your positions (For every position you want to open).
Please follow your strategy and updates; this is just my Idea, and I will gladly see your ideas in this post.
Please do not forget the ✅' like '✅ button 🙏😊 & Share it with your friends; thanks, and Trade safe.

IT SECTORNeed to keep a watch on IT sector next. Not sure when it will break the ongoing resistance zone. but looks like some good potential point are there on the upside.

SPX – Deep Correction or Opportunity for a Rebound?While the S&P 500 has seen impressive recoveries recently, current technical signals and macroeconomic factors indicate a high likelihood of a deep decline in the short term.
From a macroeconomic perspective , rising bond yields and excessive optimism about tech stocks have contributed to a strong correction in the SPX. Additionally, concerns about the Fed not continuing to cut interest rates have increased caution in the market.
From a technical analysis standpoint, SPX is currently facing strong resistance around 6,850. The chart shows that the index is trading near an upward trendline, but if it breaks the 6,600 support, SPX could continue to fall sharply to 6,550 in the medium term.
Conclusion: With both technical and macroeconomic factors supporting a bearish trend, the likelihood of SPX continuing a sharp correction in the next 24-48 hours is very high. If the price fails to hold the 6,600 support, a deeper decline is a likely scenario.
Recommendation: Monitor key support and resistance levels and consider opening a SELL position if the price confirms a break of these critical support zones.

Markets are flashing MAJOR warning signs…Markets are flashing MAJOR warning signs… NASDAQ:QQQ AMEX:SPY
In this video, we will look at the 21 ema on the Daily charts to review the move since April and where we could go from here.
If you have money in this market, you need to see this ASAP 👇

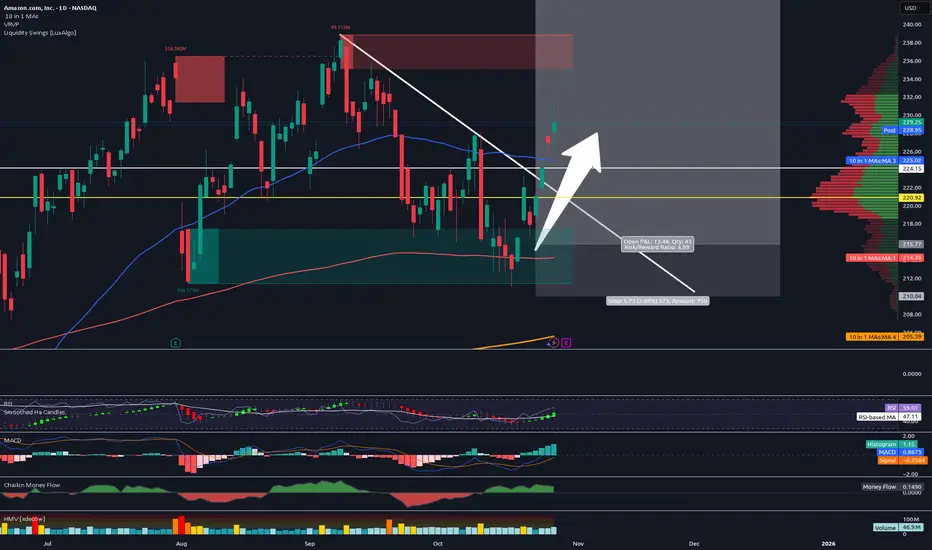
Sold Half Amazon - Raised Stops - Halfway to Final Target!Trading Fam,
We are halfway to my final target. I've been trading safe lately. So, I decided to sell half here, capture some profit, and raise my stops to $225, ensuring we're all in the money on this trade.
Congrats to those who followed me. We are 14 wins for the last 14 trades with an avg. of 33% profit per trade. Since implementing my new indicator just over a year ago, I continue to improve trade accuracy with each trade. Experience is growing and so are our wallets. Our portfolio is up 69% since we started with the indicator! Those are incredible stats for any trader, nevermind someone like me who just learned how to trade liquidity!
You guys know where to find me and all of my trades. 100% free to all of my followers.
✌️Stew
Robinhood (HOOD) | Explosive Q3 & Bullish Setup📊 Fundamental Highlights – Q3 2025
Robinhood NASDAQ:HOOD just posted blowout earnings for Q3:
🔼 Revenue up 100% YoY to $1.27B
💥 EPS up 259% YoY
📈 Total platform assets surged 119% to $333B
💸 Transaction-based revenues +129%, led by crypto, options & equities
💰 Net interest income +66% to $456M
🏦 Cash reserves > $4B
👑 Robinhood Gold users up 77% YoY to 3.9M
They also hinted at adding Bitcoin to the balance sheet, which could fuel major sentiment momentum in the coming quarters.
📐 Technical Setup
HOOD is currently trading above strong support near $113–$118. Price is consolidating in a healthy zone following the earnings spike.
🟢 Trade Idea
Entry Zone: $113–$118 (watch for reaction near support)
Targets (TP): $137 and $153
Stop Loss (SL): $105
Risk-reward is attractive with strong fundamentals and growing institutional interest. If markets hold, this could be a runner.
🔔 Watchlist Material – Stay alert for breakout confirmation or Bitcoin-related news from HOOD in upcoming quarters.

S&P 500 at Critical Support – Last Line of Defense?Since the S&P 500 index( SP:SPX ) is one of the key indicators in the financial markets, and it’s been highly correlated with parallel markets recently, it's always a good idea to keep an eye on its analysis.
Now, for example, Bitcoin ( BINANCE:BTCUSDT ) started to decline as the S&P 500 index dropped, and right now the S&P 500 index is at a pretty critical Support zone($6,774_$6,689) and Support lines. It's essentially moving right around its last line of hope.
From an Elliott Wave theory perspective, in this current zone, the S&P 500 index could be completing the Triple Three Correction(WXYXZ)=main wave 4.
Looking ahead, we might expect the S&P 500 index to climb up toward its Resistance zone($6,894_$6,859). And given the current positioning, the risk-to-reward ratio looks quite favorable—as long as you keep a reasonable stop loss in place and practice good risk management.
Note: if these Support lines break downward, we could see further declines in the S&P 500 index and in those correlated markets as well. So it's definitely something to monitor closely.
Please respect each other's ideas and express them politely if you agree or disagree.
S&P 500 Index Analyze (SPX500USD), 1-hour time frame.
Be sure to follow the updated ideas.
Do not forget to put a Stop loss for your positions (For every position you want to open).
Please follow your strategy and updates; this is just my Idea, and I will gladly see your ideas in this post.
Please do not forget the ✅' like '✅ button 🙏😊 & Share it with your friends; thanks, and Trade safe.

S&P 500 Bulls Back in Control – New All-Time High Ahead?As I expected in my previous idea , the S&P 500 index( SP:SPX ) pulled back from its Resistance lines and hit its target.
Right now, the S&P 500 index is in the process of breaking through a Resistance zone($6,894_$6,859). Just a few hours ago, it successfully broke above the upper line of a descending channel , which is a positive sign for a renewed upward move .
From an Elliott Wave perspective, it seems that the S&P 500 index has completed its main wave four, and after breaking this Resistance zone($6,894_$6,859) , we can anticipate the start of a main wave 5 .
I expect that once the S&P 500 index breaks through this Resistance zone($6,894_$6,859) , it will likely climb at least up to the next Resistance lines and the Potential Reversal Zone (PRZ) .
Note: The cryptocurrency market, and especially Bitcoin( BINANCE:BTCUSDT ), has been highly correlated with the S&P 500 index these weeks.
Please respect each other's ideas and express them politely if you agree or disagree.
S&P 500 Index Analyze (SPX500USD), 1-hour time frame.
Be sure to follow the updated ideas.
Do not forget to put a Stop loss for your positions (For every position you want to open).
Please follow your strategy and updates; this is just my Idea, and I will gladly see your ideas in this post.
Please do not forget the ✅' like '✅ button 🙏😊 & Share it with your friends; thanks, and Trade safe.

CHILE Stock Market Technical and Fundamental PerspectivesChile’s stock market is primarily represented by several key indices, each with distinct characteristics and coverage:
IGPA (Índice General de Precios de Acciones) BCS:SPCLXIGPA
The IGPA is the broadest and most representative index, covering the majority of stocks traded on the Santiago Stock Exchange. It is a capitalization-weighted index, revised annually, and includes companies across all major sectors of the Chilean economy. As of May 2025, the IGPA reached a historic high of over 42,000 points, reflecting robust market performance.
IPSA (Índice de Precios Selectivo de Acciones) BCS:SP_IPSA
The IPSA is a more focused index, comprising the 40 most heavily traded stocks on the Santiago Stock Exchange. It is revised quarterly and serves as the benchmark for large-cap Chilean equities.
S&P/CLX INTER Index 10 BCS:SPCLXIN10
This index tracks the 10 main Chilean stocks that also have American Depositary Receipts (ADRs) listed abroad, providing a bridge between local and international investors.
STOXX® Chile Total Market Index
This index aims to cover approximately 95% of Chile’s free-float market capitalization, with top components including major companies such as Falabella, Banco de Chile, LATAM Airlines Group, Cencosud, Banco Santander Chile, Empresas Copec, and Sociedad Química y Minera de Chile (SQM).
Key Components
The leading companies in Chile’s indices span various sectors:
Financials: Banco de Chile, Banco Santander Chile, Banco de Crédito e Inversiones
Retail: Falabella, Cencosud
Utilities/Energy: Enel Américas, Empresas Copec
Mining/Chemicals: Sociedad Química y Minera de Chile (SQM)
Forestry/Paper: Empresas CMPC
Airlines: LATAM Airlines Group
Long-Term Technical Perspective and Recent Trends
The Chilean stock market, as reflected by the IGPA and IPSA, has experienced a strong rally in 2025, with the major indices gaining over 25% year-to-date
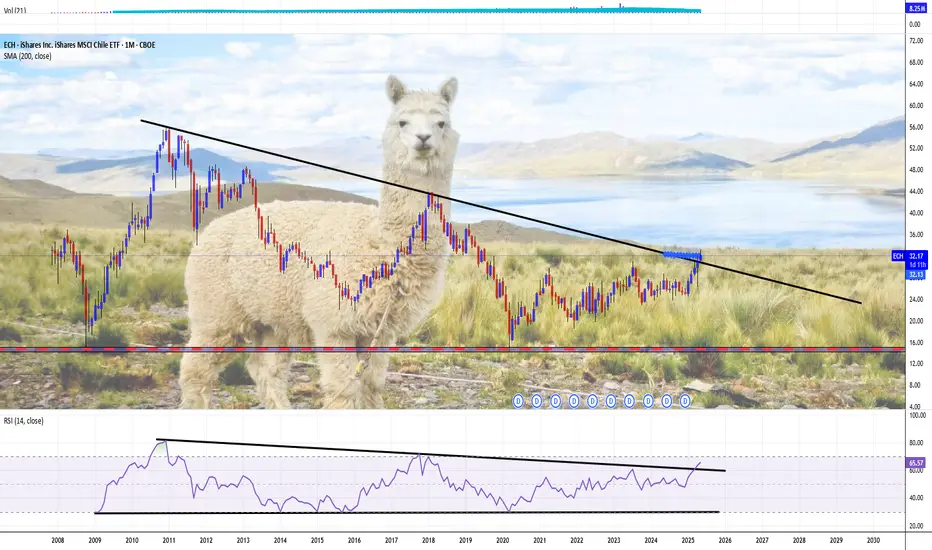
The MSCI Chile index currently presents a mixed technical picture. While long-term moving averages (200-day) signal a "buy," shorter-term indicators (5-100 day) are on "sell," and several oscillators (RSI, Stochastic, MACD) indicate oversold conditions or continued selling pressure.
This suggests that, despite the recent rally, some short-term consolidation or correction could occur, but the long-term trend remains constructive.
Fundamental breakdown
The Santiago Stock Exchange’s market capitalization stands at approximately $187 billion, with a price-to-earnings (P/E) ratio of 12.08, which is below both the emerging markets average (14.3) and the global average (22.12).
This relatively low valuation, even after a significant rally, suggests Chilean equities remain attractive on a fundamental basis.
The Chilean economy is projected to grow by 2.3% in 2025. Inflation has moderated to 4.5%, and the central bank’s benchmark interest rate is stable at 5%.
The banking sector is particularly robust, with Banco de Chile reporting a 14.2% year-over-year increase in net income for Q1 2025.
The mining sector, especially lithium, is poised for growth following major investments and Chile’s strategic push to regain global leadership in lithium production.
The combination of strong fundamentals, sectoral diversity, and attractive valuations positions Chile’s stock market for steady long-term growth, though short-term volatility is possible as global and local conditions evolve.
Conclusion
Chile’s stock market demonstrates strong long-term potential, underpinned by solid economic fundamentals, sectoral strengths, and attractive valuations, though investors should remain mindful of cyclical corrections and global market influences.
Thу main technical chart for CBOE:ECH - iShares MSCI Chile ETF (total return) points on massive 200-months SMA breakthrough, attempts to break long term 'descending top/ flat bottom' technical figure.
--
Best wishes,
@PandorraResearch Team 😎
S&P 500 Index Showing Weakness – Correction Ahead?Over the past seven days, the S&P 500 index( SP:SPX ) has been on a bullish run, frequently hitting new all-time highs. However, in the last two or three weeks, it's been influenced by the ongoing tariff tensions between the U.S. and China .
Let's look at the latest news about the S&P 500 index :
The IMF has flagged that market valuations might be a bit high, hinting at possible corrections. Plus, there's been a fresh look at how well China’s sticking to the 2020 trade deal, and on top of that, a new trade agreement in Southeast Asia is in the mix. So that’s the quick rundown!
Right now, if we look at the S&P 500 on a 1-hour timeframe, the index is near its Resistance lines and has lost its uptrend line , which is a sign of weakening momentum .
We also saw a Shooting Star Candlestick pattern form in the last few hours with good volume, adding credibility to the potential for a pullback .
From an Elliott Wave standpoint, it seems the S&P 500 has completed its wave 3, and we might see a wave 4 correction in the coming hours or days.
There's a noticeable Negative Regular Divergence(RD-) between the recent tops , and even on the daily timeframe, there's a divergence signaling potential weakness.
I expect the S&P 500 could drop at least to its Support line , around the $6,857 .
Note: The cryptocurrency market, and especially Bitcoin , has been highly correlated with the S&P 500 index these weeks, and a possible correction in this index could lead to a correction in this market.
Please respect each other's ideas and express them politely if you agree or disagree.
S&P 500 Index Analyze (SPX500USD), 1-hour time frame.
Be sure to follow the updated ideas.
Do not forget to put a Stop loss for your positions (For every position you want to open).
Please follow your strategy and updates; this is just my Idea, and I will gladly see your ideas in this post.
Please do not forget the ✅' like'✅ button 🙏😊 & Share it with your friends; thanks, and Trade safe.

IFL Finance Limited BUY Setup Entry: ₹506-508 (Current Level)
Target 1: ₹516-520
Target 2: ₹525-530
Stop Loss: ₹495
Technical Rationale:
Stock trading above EMA (469.90), showing bullish momentum
RSI at 68.69 indicating strength but not yet overbought
Price consolidating in a rectangular pattern between 490-507
Recent breakout with strong volume (2.38M)
Support from rising trendline visible
+4.43% gain today shows buying interest
Risk-Reward: Favorable 1:2+ ratio
