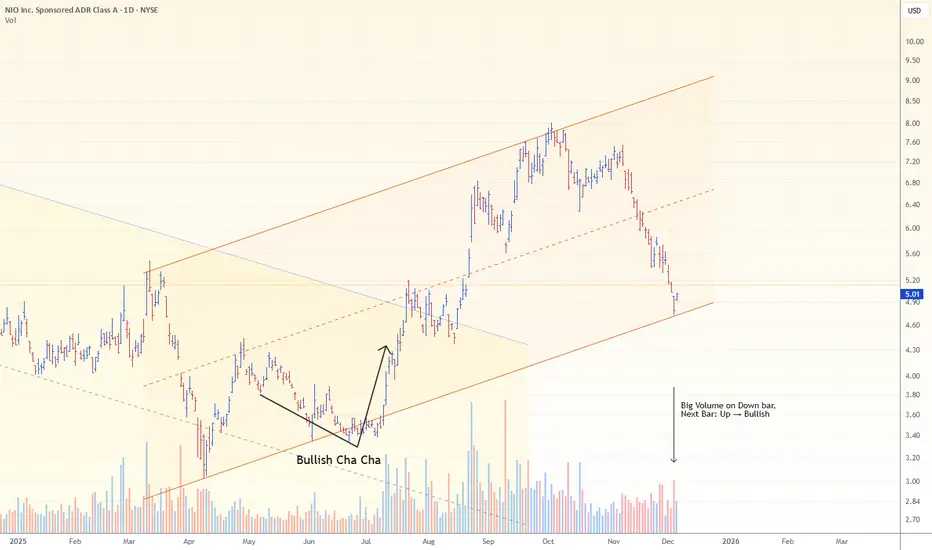
NIO: Price can find supportNIO broke below $5, extending a ~30% slide over the past month.
Pressure came after earnings showed a slight revenue miss and cautious delivery guidance — enough for bears to push the stock to new lows.
But the chart isn’t all doom:
→ price is testing the lower boundary of the 2025 ascending channel
→ yesterday opened with a bullish gap, signaling buyers may be stepping in around the key $5 level
If bulls manage to defend this zone, the trend could stabilize — with further direction depending on momentum for ONVO & Firefly heading into 2026.
Stockpicks
META Stock Tip LongHere is our stock signal for NASDAQ:META
Meta Stock Signal
🎉Entry: 597.13
⚠️SL: 482.50
✔️TP1: 732.42
✔️TP2: 911.95
✔️TP3: 1134.37
Don't forget, if you are on a challenge/funded you can trade main stocks
Hope all of our friends in USA have a good holiday
Best
ETAforex

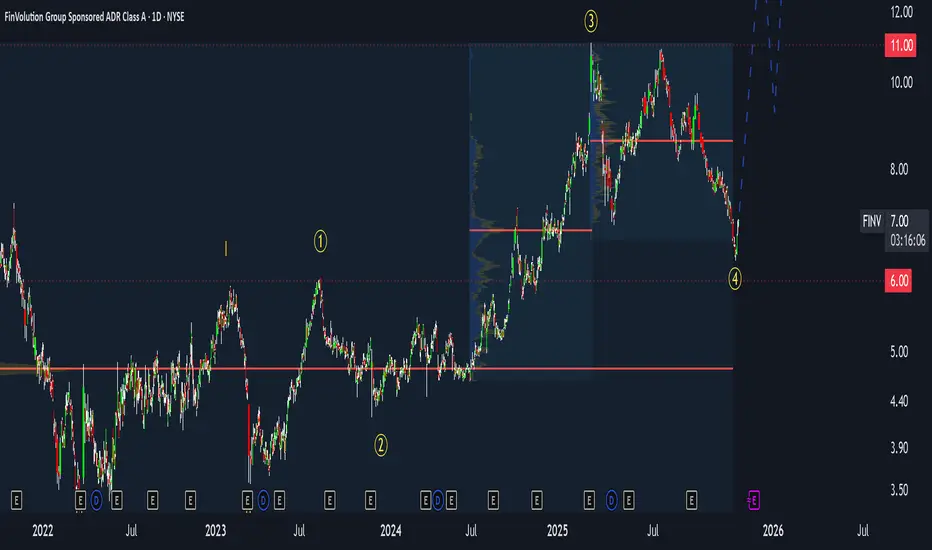
FinVolution (FINV)- Massive Selloff, Massive Opportunity?⚡ Market Context
FinVolution ( NYSE:FINV ) just went through one of its strongest selloffs in years.
After the recent earnings release, the stock dropped about 12 percent in one session and roughly 60 percent over the last six months.
What is surprising is that the earnings report itself was not bad. Revenue remains stable, the company is still profitable, and cash flows continue to look healthy. Fundamentally the decline looks excessive relative to the numbers. It is possible that the market is pricing in China specific risks that we cannot clearly see, but the size of the move still appears disconnected from the financial results.
📉 Technical Structure
From a structural point of view, FINV has now returned to one of the largest accumulation clusters on the entire chart.
This support zone stretches from 3.5 to 7, and the price is already trading near the upper boundary of this block.
The recent collapse fits well into a corrective pattern inside the larger wave structure. The current price action is likely completing the final part of the decline. The global bullish structure is still intact.
Key levels:
Major accumulation zone: 3.5 to 7
Current price: around 4.7
Wave invalidation level: 2.68
(Only a break below 2.68 cancels the entire long term structure.)
Until the price breaks below 2.68, the wave count remains valid and the bullish scenario stays active.
🔍 My Position and Strategy
My stop loss was hit during the drop, so I am currently out of the market.
Right now I am waiting for a clear confirmation signal before reentering.
My plan:
Price must break out of the current downward channel.
After the breakout, I need to see a clean retest from above.
That retest becomes the entry trigger, with a tight stop.
If the price moves lower before the breakout, that is acceptable inside the current wave structure.
The most important part is the confirmation and the retest.
📊 Bigger Picture
Even though the decline looks brutal, the long term structure remains bullish.
We are inside the largest multi year accumulation zone, and the broader formation still points to a potential long term upside once the correction completes.
The next big move can start only after the structure confirms the reversal. Until then, patience is the strategy.
✅ Summary
Earnings were acceptable, but the market reaction was extremely negative.
Price is now inside a huge accumulation cluster between 3.5 and 7.
Wave structure remains valid unless 2.68 breaks.
I am currently out and waiting for a breakout and retest signal.
Long term bias remains bullish.
💬 What do you think?
Is this a deep accumulation opportunity, or is the market pricing in hidden risks?
Share your thoughts below and drop your tickers for the next analysis.

Sold Half PYPL. Raised Stops.Trading Fam,
Recently, you may remember, my new indicator triggered a BUY alert on quite a few stocks. Paypal was one of them. I entered this trade at around $69 dollars with a moderate target of $79 for a 1:2 rrr. We've nearly reached that target today. So, I've sold half, taken profit, raised my stops, and I'll let the rest ride. You know where to track the remainder of my trades.
Congrats to those who followed me. We've now won the last 13 of 13 trades for an avg. profit of 37%. As I continue to grow in experience with my indicator, we will only get better.
✌️Stew

Sold Half Amazon - Raised Stops - Halfway to Final Target!Trading Fam,
We are halfway to my final target. I've been trading safe lately. So, I decided to sell half here, capture some profit, and raise my stops to $225, ensuring we're all in the money on this trade.
Congrats to those who followed me. We are 14 wins for the last 14 trades with an avg. of 33% profit per trade. Since implementing my new indicator just over a year ago, I continue to improve trade accuracy with each trade. Experience is growing and so are our wallets. Our portfolio is up 69% since we started with the indicator! Those are incredible stats for any trader, nevermind someone like me who just learned how to trade liquidity!
You guys know where to find me and all of my trades. 100% free to all of my followers.
✌️Stew
Sold Half CTSH. Raised Stops to Break Even.Trading Fam,
I feel that we are closing in on a local top here in the U.S. stock market for a while. My target on Cognizant Tech. may have been too aggressive above that 200 SMA and 350 SMA so, I've decided to sell half, capture any profits that I have, and raise my stops to break even on the remainder of this position. You know where to catch the remainder of my open positions.
This last move takes my portfolio up to 86% profit on the year. We've have closed the last 17 exits as profit with an average profit of almost 30%. Congrats to all those who have been following me and my new indicator over the past year. We've done well and I expect more to come, though, we may have to start looking at some shorts at this time.
✌️Stew

FinVolution Group (FINV) - A Quiet Giant on the Edge of Breakout⚡ FinVolution Group (FINV) — A Quiet Giant on the Edge of Breakout
While everyone is chasing the inflated Big Tech bubble, a much quieter — and potentially far more explosive — opportunity is forming right now in the fintech and online lending space.
That opportunity is FinVolution Group (FINV) — a Chinese and Southeast Asian fintech player that looks ready to break through its 2021 highs. Once that breakout happens, the move could be massive.
🔸 Fundamentals
FinVolution has quietly turned a corner.
Recent quarters have been consistently profitable — both revenue and EPS are growing.
The most striking part?
The forward P/E ratio is just 0.7 — yes, less than one.
That’s an extraordinary valuation for a profitable fintech with expanding operations across multiple Asian markets.
It’s a risky play, no doubt, but these are exactly the kind of setups that tend to drive portfolio growth over time: low valuation, improving financials, and clear technical breakout potential.
🔸 Technical Picture
From a technical perspective, FINV is at the start of what looks like the third major wave of its long-term structure.
Since 2021, the price has been consolidating sideways — but that phase seems to be ending now.
Key resistance: $11
Current price: around $7
Breakout level: above $11 (with volume confirmation)
First targets: $20 → $30 → $40
If the price breaks below $6, the bullish scenario pauses — it doesn’t collapse, but likely extends the sideways phase.
That sets up a risk of roughly 10–15%, while the potential upside remains multiple times higher.
The risk/reward profile here is exceptionally strong.
🔸 My Strategy
I’m already positioned - entered near $7, with a stop-loss around $6.
Once we approach $11, I plan to take partial profits and watch for a breakout confirmation.
If we get a strong breakout above $11 with solid volume, that’s my next entry trigger.
Then I’ll look to add on pullbacks, applying my call stacking strategy - building exposure gradually as the trend confirms and accelerates.
🚀 Summary
FinVolution (FINV) shows a rare combination:
✅ Profitable growth
✅ Deep undervaluation
✅ Strong breakout setup
It’s one of those asymmetric opportunities — where the downside is limited, but the upside could multiply several times over.
If the $11 breakout confirms, this could easily become one of the most powerful fintech moves of the next few quarters.
⚡ Call to Action
If you like this type of setup - low-risk, high-upside plays - tap 🚀 to support the idea,
and drop a comment with tickers you’d like me to review next.
(Full technical breakdown and strategy details are discussed in my latest videos — available via my profile.)
McDonald's stock monthly demand imbalance playing outMcDonald’s (MCD): Monthly Demand Level Still in Control
McDonald’s stock is currently respecting a monthly demand level at $294, which remains firmly in control. That’s a key point — the monthly timeframe is a much larger and more powerful structure than anything happening in the weekly or daily charts.
What I’m seeing now is a new bullish price action pattern forming in the smaller timeframes (weekly and daily), meaning buyers are stepping back in from that institutional zone. That gives me confirmation that demand is in control and that McDonald’s remains one of the strongest bullish stocks in the consumer sector.
A monthly demand level in control means that big money — institutions and funds — are accumulating. Retail traders might think it’s “too expensive” at $290+, but professional traders know that the presence of a monthly imbalance means there’s still room for price expansion to the upside.
This is where patience pays. The art of waiting for the price to return to that imbalance and observing how it reacts separates a disciplined trader from an impulsive one driven by greed or fear.

STOCKS Trading at 52 WEEK LOW - WatchlistHello Stonks Watchers 👀📈
Stocks that are hot on my watchlist right now for a possible buy , or a buy soon include:
1️⃣ Merck & Co. (MRK)
NYSE:MRK
Sector: Health Care
Last price: $81.51. 52-week low: $73.31.
% above 52-week low: 11.19%
Analysts are split: several bulls point to Keytruda pipeline upside and dividend support, but the consensus tilts toward “hold” as near-term risks (patent/biosimilar pressure) remain.
2️⃣ Costco Wholesale (COST)
NASDAQ:COST
Sector: Consumer Staples.
Last price: $943.26. 52-week low: $867.16.
% above 52-week low: 8.78%
Wall Street generally views Costco positively (membership model, resilient comps), with a consensus around “moderate buy” though some caution exists because the stock already trades at a premium.
3️⃣Saudi Aramco (2222.SR)
TADAWUL:2222
Sector: Energy
Last price: 24.95 (SAR). 52-week low: 23.13.
% above 52-week low: 7.87%
Market sentiment for Aramco is favorable for income investors because of its high, reliable dividend; investors watch oil fundamentals and geopolitics as the main swing factors.
4️⃣ONEOK, Inc. (OKE)
NYSE:OKE
Sector: Energy (midstream)
Last price: $71.55. 52-week low: $70.63.
% above 52-week low: 1.30%
Analysts and income-focused commentators highlight a strong dividend yield and attractive price targets, calling it a buy for yield/DFCF recovery in many writeups.
5️⃣The Trade Desk (TTD)
NASDAQ:TTD
Sector: Communication Services / Ad Tech
Last price: $52.03. 52-week low: $42.96
% above 52-week low: 21.11%
Long-term bulls point to programmatic ad recovery and profitable scaling, but consensus services show many firms at “hold” — sentiment is mixed while investors await sustained ad-spend improvement
$NIFTY: Nifty 50 – India’s Market Meltdown or Hidden Gem?(1/9)
Good Morning, folks! ☀️ NSE:NIFTY : Nifty 50 – India’s Market Meltdown or Hidden Gem?
Gift Nifty’s at 22,555, down 65 points, and the index is off 13% since October 2024! Is this a crash landing or a golden ticket in disguise? Let’s unpack the chaos! 🔍
(2/9) – PRICE PERFORMANCE 📊
• Gift Nifty: 22,555, down 65 points (Mar 6, 2025) 💰
• Recent Trend: 13% drop from Oct 2024 highs 📏
• Sector Mood: Autos, real estate dragging, per web reports 🌩️
It’s a bumpy ride, but bargains might be brewing! 🔧
(3/9) – MARKET POSITION 📈
• Index Weight: 50 top Indian firms, 65% of NSE market cap 🏅
• Scope: Spans 13 sectors, from banks to tech ⏳
• Trend: Bearish streak persists, down 13% since Oct 🎯
Still a heavyweight, but feeling the squeeze! 🌐
(4/9) – KEY DEVELOPMENTS 🔑
• Earnings Slowdown: Growth at 5%, down from 20%+ 🔄
• Macro Woes: U.S. tariffs, trade tensions spook investors 🌍
• Market Vibe: Gift Nifty signals a sour start 📋
Tough times, but sectors might shine through! 💡
(5/9) – RISKS IN FOCUS ⚡
• Geopolitics: U.S. tariff threats hit exports 🔍
• Sector Slump: Autos, real estate under pressure 📉
• Volatility: Bearish trend grips tight 🌪️
Rough waters ahead, but storms pass! 🛡️
(6/9) – SWOT: STRENGTHS 💪
• Diversity: 13 sectors, broad economic play 🏆
• Scale: Tracks India’s biggest players 📈
• Value: Potentially undervalued, per web buzz 🔩
A battered champ with fight left! 💼
(7/9) – SWOT: WEAKNESSES & OPPORTUNITIES ⚖️
• Weaknesses: 5% earnings growth, macro drag 📉
• Opportunities: Sector plays in banks, tech shine 📈
Can it dodge the punches and rally? 🤔
(8/9) – 📢Nifty at 22,555 (Gift), down 13%—your call? 🗳️
• Bullish: $24K soon, undervalued steal 🦬
• Neutral: Flatline, risks offset ⚖️
• Bearish: $20K next, bears rule 🐻
Vote below! 👇
(9/9) – FINAL TAKEAWAY 🎯
Nifty’s 13% slide and $116 Gift price signal trouble 📉, but undervalued sectors tease upside 🌱. Volatility’s our mate—dips are DCA fuel 🔥. Buy low, aim high! Hit or miss?

$DG: Dollar General – Discount Dynamo or Bargain Bust?(1/9)
Good afternoon, folks! ☀️ NYSE:DG : Dollar General – Discount Dynamo or Bargain Bust?
NYSE:DG ’s at $82, riding a rocky retail road! Is this budget king stacking cash or just scraping by? Let’s rummage through the bins! 🔍
(2/9) – PRICE PERFORMANCE 📊
• Current Price: $ 82
• Recent Moves: Down 0.78% from Mar 7 close, per web data 📏
• Sector Vibe: Retail shaky, but discounts hold appeal 🌟
It’s a bumpy ride with a bargain twist! 🚛
(3/9) – MARKET POSITION 📈
• Market Cap: ~$18B (219.93M shares) 🏆
• Operations: 20,000+ stores, rural retail champ ⏰
• Trend: X posts hint at turnaround hopes 🎯
Tough, but planted firm in small towns! 🏡
(4/9) – KEY DEVELOPMENTS 🔑
• Analyst Takes: Bernstein’s $90 PT, per X 🔄
• Store Push: 575 new stores planned for 2025 🌍
• Market Mood: Mixed—soft sales vs. value focus 📋
Chugging along, eyes on the prize! 💪
(5/9) – RISKS IN FOCUS ⚠️
• Consumer Woes: Low-income pressure, per X 🔍
• Competition: Walmart, Dollar Tree crowding in 📉
• Margins: Profit dips spook, per web data ❄️
Risks stalk like aisle lurkers! 🕵️
(6/9) – SWOT: STRENGTHS 💪
• Scale: 20,000+ stores, rural reach 🥇
• Value Play: Budget shoppers’ haven 📊
• Growth: New store spree in 2025 🔧
A lean, mean discount machine! 🛒
(7/9) – SWOT: WEAKNESSES & OPPORTUNITIES ⚖️
• Weaknesses: Margin squeeze, soft sales 📉
• Opportunities: Reinvestment, consumer shift 📈
Can it turn pennies into profit? 🤔
(8/9) – 📢DG at $82, retail’s rough—your guess? 🗳️
• Bullish: $95+ soon, value shines 🐂
• Neutral: Flatline, risks weigh ⚖️
• Bearish: $70 crash, margins fade 🐻
Cast your lot below! 👇
(9/9) – FINAL TAKEAWAY 🎯
DG’s $82 stance shows grit 📈, but retail’s a grindstone 🌾. Volatility’s our sidekick—dips are DCA gems 💰. Snap ‘em up, rise steady! Paydirt or pyrite?

$AVGO: Broadcom – AI Chip Powerhouse or Tariff Tightrope?(1/9)
Good morning, crew! ☀️ NASDAQ:AVGO : Broadcom – AI Chip Powerhouse or Tariff Tightrope?
With NASDAQ:AVGO at $194.94 after a Q1 earnings slam dunk, is this semiconductor star riding the AI wave to glory or teetering on trade war woes? Let’s unpack the circuits! 🔍
(2/9) – PRICE PERFORMANCE 📊
• Current Price: $ 194.94 as of Mar 10, 2025 💰
• Q1 2025: Revenue $14.92B (up 23% YoY), EPS $1.60 📏
• Movement: Up 10% post-earnings Mar 6, +8.6% Mar 7 🌟
It’s buzzing like a chip factory on overdrive! ⚡
(3/9) – MARKET POSITION 📈
• Market Cap: ~$93.5B (151.62M shares) 🏆
• Operations: AI chips, software solutions ⏰
• Trend: 42% of 2024 revenue from software, per web data 🎯
A heavyweight in the AI silicon ring! 🌐
(4/9) – KEY DEVELOPMENTS 🔑
• Earnings: Q1 beat with $14.92B, Q2 forecast tops estimates 🔄
• AI Boom: Custom chips fuel hyperscaler demand 🌍
• Sentiment: Shares rallied, per Mar 6-7 posts 📋
Thriving, wired for the future! 💡
(5/9) – RISKS IN FOCUS ⚠️
• Tariffs: Trade uncertainties loom, per web reports 🔍
• Competition: Nvidia, Marvell in the race 📉
• Valuation: Premium pricing raises eyebrows ❄️
High stakes, but risks are on the radar! 🕵️
(6/9) – SWOT: STRENGTHS 💪
• Q1 Win: $14.92B revenue, EPS $1.60 beat 🥇
• AI Edge: 77% AI revenue growth in Q1 📊
• Forecast: Q2 sales outlook shines 🔧
Powered up for the AI era! 🔋
(7/9) – SWOT: WEAKNESSES & OPPORTUNITIES ⚖️
• Weaknesses: Tariff risks, high valuation 📉
• Opportunities: 18% earnings growth projected 📈
Can it outrun trade clouds and soar? 🤔
(8/9) – 📢Broadcom at $194.94, AI chips sizzling—your vibe? 🗳️
• Bullish: $220+ by June, AI rules 🐂
• Neutral: Stable, tariffs balance ⚖️
• Bearish: $170 slide, risks bite 🐻
Drop your pick below! 👇
(9/9) – FINAL TAKEAWAY 🎯
Broadcom’s $14.92B Q1 haul screams AI strength 📈, but tariff shadows hover 🌫️. Volatility’s our sidekick—dips are DCA dynamite 💰. Snap ‘em up, ride the surge! Goldmine or gamble?

How Ride the AI Wave in 2025 | Top AI Stocks The AI boom is still making waves on Wall Street
Over the past 15 months, investors have injected more than $ 5 billion into tech sector funds. This surge was fueled by three consecutive interest rate cuts by the Federal Reserve in 2024, coupled with Donald Trump's presidential victory, which led investors to pour over $140 billion into the stock market, hoping tax reforms would boost corporate profits. A significant portion of this activity has been driven by the growing interest in artificial intelligence, with AI driven companies leading a remarkable 25% rally in the S&P 500 this year. Nvidia (NVDA), a key player in the AI sector, has soared 149% in the past year, while major tech firms like Microsoft (MSFT) and its collaboration with OpenAI, and Google’s (GOOG) Gemini project, have also contributed to the rise in stock prices.
The AI market is expected to expand from approximately $540 billion last year to over $1.8 trillion by 2030, with a projected compound annual growth rate (CAGR) of 20% through 2032. In the final weeks of his presidency, Joe Biden's administration introduced new regulations to block the export of US-made semiconductors to adversarial nations, including Russia and China. This move is part of the ongoing AI arms race, with the US aiming to maintain its lead in manufacturing the chips essential for powering AI technology.
AI Stocks: The Only ‘Bubble’ You Want to Be In
North America held the largest share of the global AI market in 2023, accounting for nearly 37%. Europe, Asia Pacific (APAC), and Latin America followed with shares of 25.5%, 24%, and 13.6%, respectively.
Whoever controls AI holds the power and the same is true in the corporate world. AI related stocks, such as Palantir Technologies (PLTR) and Nvidia, delivered triple digit returns and led the market in 2024. Growing investor interest has also made it easier to trade AI focused exchange-traded funds (ETFs), which offer exposure to broader industry themes rather than individual companies. However, performance can vary.
For instance, the Defiance Quantum ETF (QTUM) and the Invesco Semiconductors ETF (PSI) have shown comparable results since 2020, consistently outperforming the broader market.
Meanwhile, the iShares Future AI & Tech ETF (ARTY) has underperformed compared to the S&P 500. So, how can you identify the top AI stocks when certain ETFs are lagging? This is where the Quant Rating System comes in. Quant Ratings combine proprietary computer processing technology with "quantamental" analysis, allowing you to filter out the noise and focus on AI stocks with strong fundamentals that are expected to grow earnings at an above average rate.
Leading AI Companies Worldwide
Major tech giants like Amazon (AMZN), Google, Apple (AAPL), Meta (META), Microsoft (MSFT), and IBM (IBM) have invested billions into AI research to secure a dominant position in this highly profitable space. Whether it's backing high-potential startups like MSFT’s $11 billion stake in OpenAI, or supplying crucial AI hardware such as Nvidia's (NVDA) graphic processing units (GPUs), these companies are striving to stay ahead of competitors.
While generative AI tools like ChatGPT are undeniably shaping the global economy, the potential for significant returns from AI stocks is more nuanced. For instance, Palantir Technologies (PLTR) has dropped over 20% from its all-time high in December, receiving a "hold" rating from Seeking Alpha's Quant system and analysts across Wall Street as of January 9, 2025. Even Nvidia, despite a strong performance in 2024, has seen its stock show signs of stagnation. Other AI stocks are showing signs of potential overvaluation. For example, SoundHound AI (SOUN) recently dropped more than 16%, with analysts highlighting concerns over its unsustainable valuation given its weak fundamentals.
2025 Top AI Stocks
The hype in Silicon Valley can make it challenging to distinguish between AI stocks with long-term potential and those that are overhyped
Our data driven Quant system uses advanced computer processing and proprietary algorithms to analyze thousands of stocks in real time across a range of metrics like value, growth, profitability, EPS revisions, and momentum. To find the top performing AI stocks, I analyzed securities from three leading AI focused ETFs Global X Robotics & Artificial Intelligence ETF (BOTZ), Robo Global Robotics and Automation Index ETF (ROBO), and Global X Artificial Intelligence & Technology ETF (AIQ). From this analysis, I selected six top-performing stocks—three largecap and three small-to-medium-cap (SMID)—which represent the diverse opportunities in the AI space. These stocks, both from tech companies providing AI solutions and non-tech firms utilizing AI to enhance productivity, boast an average levered free cash flow margin of about 18.6% and have returned an average of 60% more than the past 12 months.
1. Twilio Inc
Market Capitalization $16.6B
Twilio, a cloud communications company, has returned nearly 51% over the past year and ranks second in the Top Internet Services and Infrastructure sector, just behind Kingsoft Cloud Holdings. The company’s growth has been driven by stronger revenues, reduced losses, increased cash flow, and the completion of a high-profile ETF investor Cathie Wood’s stake sale. Twilio’s strong Q3’24 earnings suggest it’s well-positioned to capitalize on the growing AI trend well into 2025, with its stock more than doubling since May.
Like many cloud computing companies, Twilio, based in San Francisco, gained prominence during the COVID-19 pandemic but initially struggled with high expenses and slow revenue growth. However, the surge in demand for generative AI, particularly through Twilio's CustomerAI platform which leverages large language models (LLMs) and natural language processing (NLP) to analyze customer data has played a key role in its remarkable recovery.
TWLO Revisions, Momentum, and Valuation
Over the past 90 days, Twilio has seen a remarkable 23 upward revisions to its earnings per share (EPS) and 27 revisions to its revenue projections from analysts, signaling a strong financial rebound. This turnaround is reflected in its ‘A’ Momentum Score, with six-month and nine-month price performances of 93.5% and 81.3%, respectively—both figures vastly outperforming the sector medians by over 1000%. As a result, Twilio has nearly doubled the performance of the S&P 500 in recent months.
Twilio also demonstrates solid growth prospects, with a forward EBITDA growth rate of 50.6% (783% higher than the sector median), year-over-year operating cash flow growth of 520.8% (3,348.45% above the sector median), and an impressive levered free cash flow margin of 107% (603% above the sector median). However, its average forward price-to-earnings (P/E) ratio of 30x indicates that Twilio trades at a premium compared to its peers, nearly 20% higher than the sector median.
2. Celestica Inc
Market Capitalization $12B
Celestica has seen a remarkable 255% increase in its stock price over the past year, driven by its strategic pivot toward AI infrastructure manufacturing. The company has carved out a niche in producing networking switches for data centers, and its Connectivity & Cloud Solutions segment, which makes up 67% of total revenue, has grown 42% year-over-year as tech companies invest more in AI-powered data centers. Its Q3 '24 results highlighted a 22% increase in revenue to $2.5 billion and record adjusted EPS of $1.04.
CLS Valuation, Momentum, and Growth
Celestica stands out for its attractive valuation, even with impressive returns in 2024. With a forward price-to-earnings growth (PEG) ratio of 0.87, the stock appears undervalued compared to its peers. It boasts an ‘A+’ Momentum Grade, having received six upward EPS revisions and eight revenue revisions from analysts in the past 90 days. Its Growth Grade has improved significantly, rising from ‘C+’ to ‘B+’ due to forward EPS growth of 49% and year-over-year diluted EPS growth of 88%, both significantly outperforming the sector median.
3. DocuSign
Market Capitalization $18.3B
DocuSign, known for its electronic signature services, has embraced AI in innovative ways, particularly by adding new AI features to streamline contract agreement processes. These AI-driven tools have helped the company’s stock surge more than 21% following its impressive Q3 '24 earnings, and the growth trajectory is expected to continue in 2025 as DocuSign expands into new markets, both domestically and in Europe. As SA Analyst Noah’s Arc Capital Management notes, DocuSign's AI features have proven invaluable for businesses, simplifying the often complex task of reviewing and managing contracts.
DOCU Growth, Valuation, and Profitability
DocuSign has demonstrated exceptional growth, including an ‘A+’ EBIT growth rate of 239.21% (10,710% above the sector median) and year-over-year diluted EPS growth of 1,852.2% (24,971% higher than its peers). While its overall ‘C+’ Growth Score is somewhat tempered by a low forward return on equity growth forecast of -29.58%, the company’s valuation looks compelling. Its trailing and forward P/E GAAP ratios of 18.6 and 17.9 are 38.6% and 41.5% lower than the sector medians, suggesting that DocuSign's shares are undervalued. Furthermore, its ‘A+’-Rated PEG ratio of 0.01, a 99% difference from the sector median, points to a strong value proposition for investors.
4. FARO Technologies
Market Capitalization $478.2M
FARO Technologies, based in Lake Mary, Florida, specializes in 3D measurement technology and has leveraged AI to establish itself as a leader in "smart factories" and "intelligent automation." Its scanning technology has been instrumental in improving productivity and accelerating production timelines. The company has seen nearly 54% growth over the past six months, benefiting from the expanding global 3D scanning market, projected to grow to $11.85 billion by 2032 at a compound annual growth rate (CAGR) of 13.11%.
In Q3, FARO reported $0.21 of nonGAAP EPS, marking its sixth consecutive quarter of exceeding expectations. This success is part of the company’s strategic plan, which includes the launch of a new line of laser scanners.
FARO Growth and Valuation
FARO's growth metrics stand out, with forward EBIT growth of 112.48%, 1,410.71% higher than the sector median, and an astonishing year-over-year levered free cash flow growth of 24,214.19%, 164,037% above the sector median. The company's forward EBITDA growth of 42.76%, 639.9% higher than the sector median, indicates robust growth ahead.
FARO's stock is undervalued according to its metrics. It has an EV/sales ratio of 1.41, 59% lower than the sector median, and a price-to-book ratio of 1.9, 45% below the sector median, making it an attractive investment at its current valuation.
5. Proto Labs
Market Capitalization $897 M
Proto Labs, a Minnesota-based company, specializes in on-demand manufacturing solutions, enabling businesses to avoid the costs associated with stocking large quantities of products. Despite a recent dip of around 16% in share price, Proto Labs remains a promising investment due to its strong profitability and its impressive cash flow of $24.8 million in Q3 2024, the highest since its 2020 acquisition of 3D printing company 3D Hubs.
Proto Labs has also seen five upward revisions to its EPS and five to its revenue over the last 90 days, signaling stronger-than-expected growth prospects. The company is positioned to benefit from the strong sector tailwinds of the global print-on-demand market, which was valued at $6.18 billion in 2022 and is expected to grow at a CAGR of 25.8% through 2030.
PRLB Valuation
Proto Labs boasts an impressive long-term growth rate of 25%, 119% higher than the sector's 11.4%, and a year-over-year capital expenditure (capex) growth of 74.4%, significantly outpacing the sector's 4.3%. This suggests that Proto Labs is reinvesting a large portion of its cash back into its operations to fuel future growth.
The stock is fairly valued with a forward PEG ratio of 0.06, indicating that it is significantly undervalued compared to its peers, at a 49.3% discount from the sector. Its price-to-book ratio of 1.36 is also an attractive metric, 52.83% lower than the sector median. However, its ‘D’-rated forward and trailing P/E ratios of 39.9 and 48.8, respectively, reflect its recent price decline, leading to an overall Valuation Grade of ‘C’.
6. Freshworks
Market Capitalization $4.9 B
Freshworks, a cloud based SaaS company founded in India, is a strong candidate for a "buy the dip" opportunity. After a rough 2024, shares in Freshworks have begun to rebound, thanks to increasing demand for its AI-enabled software solutions. The company serves over 68,000 customers, including global brands like American Express, Shopify, and Airbus. Its Q3’24 financial results were filled with positive indicators:
- 22% YoY revenue growth to $186.6M
- 21% YoY increase in free cash flow
- Raised full year guidance
- Announced a $400M buyback plan
- Maintains a debtfree balance sheet with strong liquidity
Freshworks also announced a 13% reduction in headcount, which is expected to improve margins further, in addition to the impact of its share repurchase program. The company is poised to benefit from the booming AI SaaS market, which is projected to grow at a CAGR of over 30% by 2031.
FRSH Growth, Valuation, and Momentum
Freshworks boasts an impressive A-’ Growth Score, underpinned by its solid revenue growth and forward revenue expansion of 17.8%, a 221.8% difference from the sector median. The company also has a 3-5 year long-term CAGR of 27.5%, significantly outpacing the sector by 824.2%. Its year-over-year capital expenditure growth stands at 83.3%, signaling reinvestment in future growth.
In terms of valuation, Freshworks has a forward PEG of 1.51, suggesting that the stock is available at a slight discount to its peers. Similar to Proto Labs, its higher-than-average P/E ratios are likely due to its recent dip of around 9.3% over the past month. One of the standout features of Freshworks’ stock is its ‘A’ Revisions Score, which reflects 17 EPS upward revisions and 16 revenue upward revisions in the past three months.
As the AI frenzy continues to dominate Wall Street, some of the valuations of major AI driven companies may be edging into overinflated territory. However,so far my Quant System highlights six ‘Strong Buy’ stocks that still exhibit strong fundamentals. These companies have, on average, risen about 60% over the past year, showcasing strong bullish momentum and solid valuations. For investors looking to integrate AI into their portfolios without succumbing to the hype, these stocks present a promising opportunity
Which AI stock are you loading and why?

WeBull Corporation | BULLOver the past few days, specifically from August 6th to August 15th, NASDAQ:BULL has been in a sideways position. Then, on August 16th, NASDAQ:BULL confirmed a breakout from the sideways movement. Therefore, we can target a minimum price of $18 with the potential for up to $20.

Intel in Trouble or Ready for Redemption?There is growing potential for QUALCOMM Incorporated to acquire Intel.
I now believe that this development has advanced enough to warrant a fresh look at the stock
Qualcomm recently approached Intel about a takeover. According to WSJ , Qualcomm has expressed interest in acquiring Intel, which, if realized, would mark one of the most significant deals in recent history
Initially, this seemed like a long shot, with limited details emerging from the report. However, QCOM has continued to pursue the idea. Also QCOM has been in contact with Chinese antitrust regulators over the past month about this potential deal and is waiting until after the US presidential election to decide on making a formal offer. Since the election is just less than a month away, I believe this acquisition is becoming more of a possibility that investors should factor into their assessment of INTC. If a deal goes through, it’s likely that the acquisition will come at a premium to the current stock price, creating an opportunity for significant short term gains for investors
There is always a chance that no deal will occur. In that case, potential investors should evaluate whether the stock is worth holding as a long-term investment. My outlook here is not optimistic, and I’ll delve into INTC's competitive position, as indicated by its latest inventory data, in the next section
Given these two potential scenarios, I am upgrading my rating from "Sell" to "Hold." In summary, the possibility of QCOM acquiring INTC introduces a major upside catalyst that I hadn’t accounted for in my previous analysis. This potential acquisition helps offset some of the concerns about INTC as a standalone company.
Unlike many financial metrics that can be interpreted in different ways, inventory levels are more straightforward. He also explained that inventory trends can provide early indicators of business cycles. For cyclical industries, rising inventories can signal overproduction as demand wanes, while shrinking inventories can indicate strong demand
As shown in INTC’s most recent balance sheet, its inventory levels have generally been on the rise. For instance, in December 2014, inventory was valued at $ 4.273 billion, while the most recent figures show an increase to $ 11.244 billion. In some cases, rising inventory can signal business growth with increasing demand and production capacity, which was true for Intel in the early part of the last decade.
When inventory growth exceeds the pace of business growth, it becomes a red flag. In this scenario, rising inventory suggests weakened competitiveness and declining market position—an issue that Intel currently faces, in my opinion. The following chart helps illustrate this point, showing a comparison of days of inventory outstanding (DIO) for Intel and NVIDIA over the last five years, from 2020 to 2024. DIO is a measure of how many days it takes a company to sell its inventory
Given Intel's inventory buildup and declining competitive edge, I find its current valuation multiples hard to justify. Specifically, the chart highlights a comparison of price-to-earnings (P/E) ratios between Intel, NVIDIA, and AMD. Focusing on non-GAAP earnings estimates for fiscal years FY1 through FY3, Intel is currently trading with the highest P/E ratio for FY1 at 87.7 almost twice the multiple of NVIDIA and AMD, which are at 46.29 and 46.25, respectively
That said, the outlook changes somewhat when considering the years further ahead. For instance, in FY2, NVIDIA’s expected P/E ratio rises to the highest at 32.77, compared to Intel's 20.02 and AMD's 29.02. However, I want to emphasize the substantial uncertainty in Intel's earnings forecasts. As shown in the next chart, the consensus estimates for Intel's earnings per share (EPS) in FY 2024 range from a low of $0.15 to a high of $0.31 (a more than twofold variation) and from a low of $0.65 to a high of $2.1 (an almost fourfold variation). Given such uncertainty, I believe investors should be cautious about relying too heavily on forward P/E ratios too far into the future.
Both Intel and NVIDIA have experienced significant fluctuations in DIO over the years. Notably, both companies saw a spike in 2023 due to the COVID pandemic, which disrupted global supply chains. As the disruption faded, both firms saw a recovery (ie, a reduction in DIO). the difference in recovery is striking. Intel's DIO peaked at over 150 days in 2023 and has since decreased to 125 days a modest reduction but still above its historical average of 114 days. In contrast, NVIDIA's DIO surged to over 200 days but has rapidly dropped to 76 days, which is not only below its four-year average of 97.9 days but also near its lowest level in four years.
I expect Intel to face increasing competitive pressure as rivals like NVIDIA and AMD roll out their next-generation chips, particularly NVIDIA’s Blackwell chips. I recommend potential investors keep a close eye on inventory data, as it can signal changes in competitive dynamics for the reasons discussed here.
In addition to inventory issues and valuation risks, Intel faces a few other specific challenges. A significant portion of Intel’s current product lineup is concentrated in certain segments, such as PCs, which I believe are nearing market saturation plus a large share of Intel’s revenue comes from China. Given the ongoing trade tensions between the US and China, this heavy reliance on China poses a considerable geopolitical risk. These factors may limit Intel’s ability to adapt to technological advancements and shifting geopolitical conditions
The potential for a QUALCOMM acquisition has emerged as a new major upside catalyst. While my outlook on Intel’s business remains pessimistic based on the latest inventory data, the acquisition possibility partially offsets these negatives, leading me to upgrade my rating from Sell to Hold or if you are risk taker like Me, load the dip

Microsoft’s Big Moves This Quarter | From Activision to AI AgentMicrosoft’s Revenue Surge: The Power of AI, Gaming, and Strategic Investments
Microsoft has released its Q1 FY25 earnings for the quarter ending in September
The stock saw a 6% drop, indicating the results fell short of investors' high hopes. Trading at over 30 times projected earnings for next year, expectations for Microsoft were significant.
CEO Satya Nadella stated
“Our AI business is set to exceed an annual revenue run rate of $10 billion next quarter, making it the fastest business in our history to reach this milestone.”
This means that AI will soon account for about 4% of Microsoft's total revenue in under three years a remarkable feat for a global giant.
If you need a quick summary, here are three main points:
1. ☁️ Azure’s growth is slowing. As Microsoft’s key player in the AI competition, Azure grew 34%, down slightly from 35% in the prior quarter (after adjustments). This comes as Google Cloud raised the bar, with its growth accelerating from 29% to 35% during the same period.
2. 🤖 AI growth is limited by hardware supply, as capacity struggles to meet demand. Data center expansion is a long-term process, and Microsoft is investing heavily in infrastructure, aiming for a growth boost by 2025.
3. 👨👩👧👦 Consumer-focused products like Gaming and Devices are underperforming. Although not essential to Microsoft's core business, their poor performance has impacted overall results.
Here’s a breakdown of the insights from the quarter.
Overview of today’s insights:
- New segmentation.
- Microsoft’s Q1 FY25 overview.
- Key earnings call highlights.
- Future areas to monitor.
1. New Segmentation
Revised Business Segments
In August, Microsoft announced a reorganization of its business segments, effective this quarter. The purpose? To better align financial reporting with the current business structure and strategic management.
Summary of the main changes
- Microsoft 365 Commercial revenue consolidation: All M365 commercial revenue, including mobility and security services, now falls under the Productivity and Business Processes segment.
-Copilot Pro revenue shift: Revenue from the Copilot Pro tool was moved from Productivity and Business Processes to the More Personal Computing segment under Search and news advertising.
-Nuance Enterprise reallocation: Revenue from Nuance, previously part of Intelligent Cloud, is now included in Productivity and Business Processes.
-Windows and Devices reporting combination: Microsoft now reports Windows and Devices revenue together.
Impact of These Changes:
Core Segments Overview:
In summary:
- The Productivity and Business Processes segment has grown significantly.
- The Intelligent Cloud segment has decreased due to the reallocation of Nuance and other revenue.
Products and Services Overview:
- M365 Commercial now includes Nuance, shifted from the Server products category, along with integrated mobility and security services.
- Windows & Devices have been merged into a single, slower-growth category.
Additional Insights:
- Azure, Microsoft's cloud platform, is reported within 'Server products and cloud services.' Although its growth rate is shared by management, exact revenue figures remain undisclosed.
Azure’s past growth figures have been adjusted for consistency, with the last quarter’s constant currency growth recast from 30% to 35%, setting a higher benchmark. Tracking these metrics is challenging due to limited revenue disclosure, but this recast indicates Azure's raised growth expectations.
2. Microsoft’s Q1 FY25 Performance
Financial Summary:
-Revenue: Up 16% year-over-year, reaching $65.6 billion (exceeding estimates by $1 billion). Post-Activision Blizzard acquisition in October 2023, the growth was 13% excluding the merger.
New Product and Services Segmentation Results
- Server products & cloud services: $22.2 billion (+23% Y/Y).
- M365 Commercial: $20.4 billion (+13% Y/Y).
- Gaming: $5.6 billion (+43% Y/Y), influenced by Activision.
- Windows & Devices: $4.3 billion (flat Y/Y).
- LinkedIn: $4.3 billion (+10% Y/Y).
- Search & news advertising: $3.2 billion (+7% Y/Y).
- Enterprise & partner services: $1.9 billion (flat Y/Y).
- Dynamics: $1.8 billion (+14% Y/Y).
- M365 Consumer products: $1.7 billion (+5% Y/Y).
Core Business Segments Breakdown:
- Productivity and Business Processes: Increased 12% Y/Y to $28.3 billion, supported by M365 Commercial, especially Copilot adoption.
- Intelligent Cloud: Grew 20% Y/Y to $24.1 billion, with Azure AI driving growth.
- More Personal Computing: Grew 17% Y/Y to $13.2 billion, including a 15-point boost from Activision. Devices fell, but search and ad performance improved under new segmentation.
Key Observations:
- Microsoft Cloud revenue climbed 22% Y/Y to $39 billion, making up 59% of total revenue (+3 percentage points Y/Y).
- Azure continues to drive cloud services and server products' growth.
- Xbox growth has surged due to the Activision acquisition since Q2 FY24, expected to stabilize by Q2 FY25.
- Windows OEM and devices combined, showing a 2% decline in Q1 FY25.
- Office rebranded to Microsoft 365; updated naming will be used starting next quarter.
- Margins: Gross margin at 69% (down 2pp Y/Y, 1pp Q/Q); operating margin at 47% (down 1pp Y/Y, up 4pp Q/Q).
- EPS: Increased 10% to $3.30, beating by $0.19.
Cash Flow and Balance Sheet:
- Operating cash flow: $34 billion (52% margin, down 2pp Y/Y).
- Cash**: $78 billion; Long-term debt**: $43 billion.
Q2 FY25 Outlook:
- Productivity and Business Processes: Anticipated 10%-11% Y/Y growth, steady due to M365, Copilot inclusion, and expected LinkedIn growth of ~10%. Dynamics set to grow mid-to-high teens.
- Intelligent Cloud: Projected 18%-20% Y/Y growth, slightly slowing, with Azure growth expected between 28%-29%.
- More Personal Computing: Forecasted ~$14 billion revenue, declines in Windows, Devices, and Gaming anticipated, with some offset from Copilot Pro.
Main Takeaways:
- Azure's growth slowed to 34% Y/Y in constant currency, with AI services contributing 12pp, up from 11pp last quarter. This marks a dip from the recast 35% prior and included an accounting boost.
- Capacity limitations in AI persist; more infrastructure investments are planned, with reacceleration expected in H2 FY25.
- Commercial performance obligations grew 21% to $259 billion, up from 20% in Q4.
- Margins were pressured by AI infrastructure investments; Activision reduced the operating margin by 2 points.
- Capital expenditures increased by 50% to $15 billion, half dedicated to infrastructure, with further Capex growth expected.
- Shareholder returns included $9.0 billion through buybacks and dividends, matching Q4 repurchases.
Earnings Call Highlights:
Azure AI saw a doubling of usage over six months, positioning it as a foundation for services like Cosmos DB and SQL DB. Microsoft Fabric adoption grew 14% sequentially, signaling rapid uptake.
AI Expansion: GitHub Copilot enterprise use surged 55% Q/Q, with AI-powered capabilities used by nearly 600,000 organizations, a 4x increase Y/Y.
M365 Copilot has achieved a 70% adoption rate among Fortune 500 companies and continues to grow rapidly.
LinkedIn saw accelerated growth in markets like India and Brazil and a 6x quarterly increase in video views, aligning with broader social media trends.
Search and Gaming: Bing’s revenue growth surpassed the market, while Game Pass hit a new revenue record, propelled by Black Ops 6
Capital Expenditures: CFO Amy Hood highlighted that half of cloud and AI investments are for long-term infrastructure, positioning the company for sustained growth.
4. Future Outlook
Energy Needs: Microsoft, facing higher power demands, plans to revive a reactor at Three Mile Island with Constellation Energy by 2028 to power its AI data centers sustainably.
Autonomous AI Agents: Coming in November, these agents will perform tasks with minimal human input, enhancing efficiency. Copilot Studio will allow businesses to customize these agents, with 10 pre-built options to start.
Industry Impact: Salesforce has launched Agentforce, signaling increased competition. CEO Mark Benioff recently compared Microsoft’s Copilot to the nostalgic Clippy, stoking rivalry.
For further analysis stay tuned

PLTR moving higherPLTR expected to move higher.
The price is bouncing off the 20MA and respecting it.
Making new higher/highs and higher lows.
Earnings is due shortly, which could have a negative impact to the price.
However, the long term outlook for the company is still strong.
Anyone else have thoughts on this stock?

JUPITER WAGONS - UPTREND JUPITER WAGONS - BUY
Trade Reason :
Weekly says - Good uptrend (Higher Low) and Strong Support Level.
Market Trend Reversed - Wait for Little bit correction are Retest .
Entry - 507 Rs or Entry Now
Target - 688 Rs
Stoploss - 415 Rs
Happy Trading ...

GRMOVER - UPTREND BUY Stock Name - GRM Overseas
Trade Setup :
Weekly - Uptrend & Fibonacci Golden ration activated .
Day - Uptrend Continue
Suggestion :
Wait for Retest Or Retracement ..
Entry - 205 Rs
Stoploss - 176 Rs
Target - 264 Rs
Expected - 28 % Return ...
Happy Trading - Thank you ..

ADM 1D: 10-Month Channel Says Goodbye?Since July 18, 2024, ADM had been locked in a clean downward channel — well-behaved, well-respected. But in May 2025, the structure finally cracked: price broke out, crossed above the 50-day MA, and pulled back for a textbook retest right on the channel’s upper edge. So far, the breakout is holding. The next targets sit at 50.6 (0.618), 53.5 (0.5), and 56.5 (0.382). As long as price stays outside the channel, the bullish structure remains intact.
Connor’s RSI down below is quietly doing its job — already bounced from deep oversold, now curling up with momentum. It’s not flashy, but in this context it signals early strength before the crowd notices.
Fundamentally, ADM is still cleaning up after the early-2024 accounting scandal that nuked investor trust. But management moved fast: reinstated buybacks, tightened guidance, and Q1 2025 came in strong — $22.6B revenue, $0.88 EPS, both beating expectations. ADM remains a pillar of the U.S. ag sector, and in an era of global food anxiety, that means structural demand isn’t going anywhere.
Вот адаптированный перевод финального блока под **английский пост**, в том же живом и профессиональном стиле:
Enjoyed the idea? Like, share, and drop your thoughts in the comments.
It helps keep the content visible, free, and accessible to everyone.
Got your own charts or takes? Let’s discuss them below.

MCHP Breakout to 64 if we stay above 48Looks like a great break out trade for 4 bucks possibly more if your interested. MCHP looks like its driving up
Kris/Mindbloome Exchange
Trade Smarter Live Better

BBTC BUY NOW BBTC - BOMBAT BURMAH TRADING COMPANY
STRONG FUNDAMENTAL STOCK
See Technical View
Monthly - Higher Low
Day - Trend Reversed
Entry - 1829 Rs
StopLoss - 1586 Rs
Target - 2867 Rs
Expected Return - 56 %
Thank You .. Happy Trading

Berkshire Hathaway | No More Apple Pie & Bank Bread!No More Apple Pie and Bank Bread | Buffett’s Recipe for Market Caution
Berkshire Hathaway has recently disclosed its earnings amid fluctuating around a $1 trillion valuation. A notable update is its continued reduction of stakes in overvalued assets, including a 20% decrease in holdings of Apple and Bank of America, boosting its cash reserves to $325 billion
Although Warren Buffett himself isn't favoring share buybacks at present, Berkshire Hathaway stands as a compelling investment option
Why Berkshire Hathaway's $325 Billion Cash Pile Signals Market Caution
The company's net earnings remain subject to significant fluctuations due to rules requiring valuation changes of investment holdings. However, there was a slight decline in operating earnings, mainly driven by lower insurance underwriting income. Despite this, that segment is historically volatile, and year over year aka YoY, the company has maintained strong performance.
Yea2date aka YTD, operating earnings have risen over 10%, totaling just under $33 billion compared to just below $29 billion last year. This points to an annualized earnings estimate of approximately $44 billion, implying a price2earnings aka P/E ratio of about 22, without factoring in over $320 billion in cash and significant investment holdings.
Excluding cash and investments, the adjusted P/E ratio is closer to single digits. Share buybacks have paused, reflected in a ~1% decrease in the outstanding shares YoY, signaling Berkshire's assessment of current market valuations.
Segment Highlights
The various business units within Berkshire Hathaway showcase its robust asset base and earning capacity. Insurance underwriting income saw a sharp YoY drop, but other business areas performed strongly. Income from insurance investments remained solid, and BNSF, its railroad subsidiary, also showed strong results despite a double digit YoY decline.
Berkshire Hathaway Energy continues its growth, cementing its position in the utility sector with significant renewable energy ventures. For context, NextEra Energy (NEE), with a market capitalization of $160 billion, posted quarterly earnings around 10% higher.
Berkshire's other controlled and non-controlled businesses contribute over $13 billion annually, underpinning its diversification and consistent earnings performance. This strength across segments underscores its formidable financial health.
Market Context
Currently, market valuations are elevated by historical standards.
Excluding periods of earnings dips, market enthusiasm is exceptionally high, with the S&P 500 P/E ratio nearing 30x, approaching levels last seen in 1999. Buffett and Berkshire appear to view a 3% yield from such a P/E as unattractive, especially when bonds offer higher returns.
The 2008 Playbook
Berkshire's track record of effectively utilizing its cash reserves is notable. Excluding its insurance float, the company still holds $150 billion in cash.
During the 2008 financial crisis, Berkshire leveraged its liquidity for strategic investments in companies like General Electric, Swiss Re, Dow Chemical, and Bank of America, as well as finalizing the full acquisition of BNSF in 2010. This proactive use of capital proved advantageous.
The current strategic sale of assets suggests Berkshire is preparing for potential market downturns. Given high S&P 500 valuations, reallocating part of an S&P 500 position into Berkshire Hathaway could be wise, ensuring exposure to a cash-rich portfolio capable of seizing future opportunities. Meanwhile, Berkshire’s earnings are valued lower than the broader market, potentially minimizing major downturn risks.
Investment Risks
A key risk is that timing the market is inherently challenging, with the adage "time in the market beats timing the market" serving as a caution. If Berkshire's market outlook is incorrect, its $300+ billion in cash could underperform while broader markets remain strong, which would diminish its appeal as an investment.
Final Thoughts
Berkshire Hathaway has taken the bold step of liquidating some of its most significant and priciest holdings, opting to incur capital gains taxes to increase liquidity. This move has bolstered its cash position to $325 billion, $150 billion above its float level. Meanwhile, its strong operational businesses continue generating healthy cash flow.
Drawing on its successful strategies during the 2008 crisis, Berkshire appears to be positioning itself for another downturn amid current high market valuations. We advise investors to consider shifting part of their S&P 500 exposure into Berkshire Hathaway for enhanced diversification and potential benefits in a market correction, long story short Berkshire Hathaway remains a robust investment opportunity but wont make millionaire!
What do you think moonypto fam?
