ZEELAfter a long consolidation, ZEEL looks like it has completed some form of bottom formation and could bounce back. However this wld be negated if it closes below 110. Please check the information on the chart and if your risk/reward criteria is met, you could try it out.
Stockstobuy

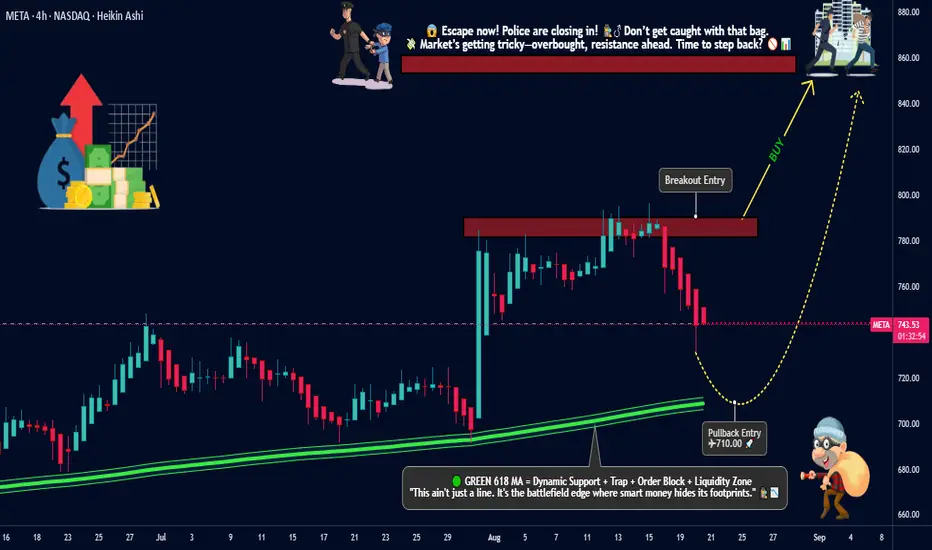
META Platforms Inc. Heist: Breakout Loot vs Pullback Entry🚨META Platforms Inc. Stock Heist Plan🚨
💎Asset: META Platforms Inc. (Swing Trade Robbery)
💎Plan: Bullish Break-In
📈 Breakout Entry: 790.00 (Vault Door Break)
📉 Pullback Entry: 710.00+ (Sweet Spot for the Thieves)
🔑 Any perfect pullback after 710.00, OG thieves may layer orders at chosen levels – stack the loot, DCA style!
🛑 Stop Loss (SL): Thief SL parked @ 675.00 (but remember OG’s—adjust based on your risk appetite & personal robbery strategy).
🎯 Target (Escape Point): 850.00 (Police barricade spotted! Don’t get greedy—take the cash and run before sirens go off 🚔💨).
🕵️♂️ Thief Trader Notes:
Use layering method (multiple limit orders) for maximum loot collection.
Don’t panic if guards (market makers) try to set traps; patience is the true thief’s weapon.
Adjust SL to protect your robbery stash.
Stay sharp—volatility = more doors to break in!
⚠️ Trading Alert for OG’s:
News & earnings reports are like security alarms—avoid entering new trades at that time.
Use a trailing SL to lock in profits once you’re in the getaway car 🚗💨.
💥 If you like this META Heist Plan, smash the Boost Button 💥 and join the robbery crew. Together we loot the markets, one breakout at a time! 🤑💰🏆
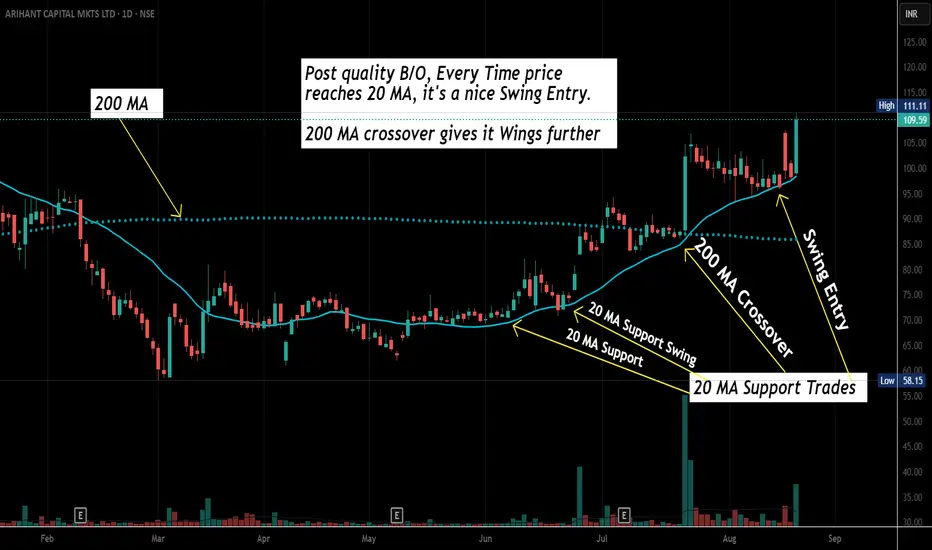
Swing Trading Basic- How to Select a Stock for SwingHow to identify a Swing Trading Set up.
Let's take an Example of "Arihant Capital Fin". During that Reversal, price start floating above 20 MA. That's an early sign- Real Time EOD Price is now trending above 20 Day's Average price. It means now price is above monthly Average (22 Trading Days /Month).
Additionally, Volume confirmation also suggest same trend direction (During June 2025). Moreover 20 MA stops decline, pauses & starts it's reversal Journey. Exactly from hereon, if Price starts giving VCP or 20 MA Supporting scenario, get ready for a Swing Trade in such Stocks. You'll see in the chart, every dip to 20 MA was bought nicely.
This is not a buying/ trading advise. Market Factor, Stock & Sector specifics, needs to be considered for trading. Every stock has it's own soul of price movement. This is a psychological journey than Scanning, indicators & Technical skills. You'll master it if you repeatedly practice min 20 charts a Day for at least 6 months!
Wish you Happy Trading & Happy Learning!
Why Most Traders Missed This Starbucks Swing Trade (SBUX)Most traders miss the forest for the trees. They spend their entire day glued to intraday charts, scalping for a few cents, and they completely ignore the bigger picture. But here’s the truth: the biggest moves, the cleanest swing trades, come from the higher timeframes — monthly and weekly charts. Today, I will break down why that matters, and we’ll use Starbucks stock, ticker SBUX, as a perfect example.
The Importance of Bigger Timeframes
When you zoom out to the monthly timeframe, you’re looking at where the real money plays — hedge funds, institutions, the smart money. These guys aren’t trading 5-minute charts. They’re building positions in massive supply and demand imbalances.
If you ignore those levels, you’re basically trading blind. It’s like trying to surf without paying attention to the tide. You might catch a wave or two, but eventually, the tide will wipe you out.”
Starbucks Monthly Demand at $79.68
Let’s look at Starbucks. Right now, we’ve got a strong monthly demand imbalance of around $79.68. Price dropped into that zone, and what happens next? Buyers step in, and bullish candlesticks start forming.
This isn’t magic. This is pure supply and demand. At that price, Starbucks became too cheap for the big players to ignore. They’re scooping it up, and as a result, smaller timeframes start printing bullish price action. The monthly demand fuels the fire.
There is room to reach the tested monthly supply at $110.

HIMS & LLY insiders transactionsBoth companies are facing legal issues, but the respond to stock price from the management of each company are different.
Disclaimer: This content is NOT a financial advise, it is for educational purpose only.

Intel in Trouble or Ready for Redemption?There is growing potential for QUALCOMM Incorporated to acquire Intel.
I now believe that this development has advanced enough to warrant a fresh look at the stock
Qualcomm recently approached Intel about a takeover. According to WSJ , Qualcomm has expressed interest in acquiring Intel, which, if realized, would mark one of the most significant deals in recent history
Initially, this seemed like a long shot, with limited details emerging from the report. However, QCOM has continued to pursue the idea. Also QCOM has been in contact with Chinese antitrust regulators over the past month about this potential deal and is waiting until after the US presidential election to decide on making a formal offer. Since the election is just less than a month away, I believe this acquisition is becoming more of a possibility that investors should factor into their assessment of INTC. If a deal goes through, it’s likely that the acquisition will come at a premium to the current stock price, creating an opportunity for significant short term gains for investors
There is always a chance that no deal will occur. In that case, potential investors should evaluate whether the stock is worth holding as a long-term investment. My outlook here is not optimistic, and I’ll delve into INTC's competitive position, as indicated by its latest inventory data, in the next section
Given these two potential scenarios, I am upgrading my rating from "Sell" to "Hold." In summary, the possibility of QCOM acquiring INTC introduces a major upside catalyst that I hadn’t accounted for in my previous analysis. This potential acquisition helps offset some of the concerns about INTC as a standalone company.
Unlike many financial metrics that can be interpreted in different ways, inventory levels are more straightforward. He also explained that inventory trends can provide early indicators of business cycles. For cyclical industries, rising inventories can signal overproduction as demand wanes, while shrinking inventories can indicate strong demand
As shown in INTC’s most recent balance sheet, its inventory levels have generally been on the rise. For instance, in December 2014, inventory was valued at $ 4.273 billion, while the most recent figures show an increase to $ 11.244 billion. In some cases, rising inventory can signal business growth with increasing demand and production capacity, which was true for Intel in the early part of the last decade.
When inventory growth exceeds the pace of business growth, it becomes a red flag. In this scenario, rising inventory suggests weakened competitiveness and declining market position—an issue that Intel currently faces, in my opinion. The following chart helps illustrate this point, showing a comparison of days of inventory outstanding (DIO) for Intel and NVIDIA over the last five years, from 2020 to 2024. DIO is a measure of how many days it takes a company to sell its inventory
Given Intel's inventory buildup and declining competitive edge, I find its current valuation multiples hard to justify. Specifically, the chart highlights a comparison of price-to-earnings (P/E) ratios between Intel, NVIDIA, and AMD. Focusing on non-GAAP earnings estimates for fiscal years FY1 through FY3, Intel is currently trading with the highest P/E ratio for FY1 at 87.7 almost twice the multiple of NVIDIA and AMD, which are at 46.29 and 46.25, respectively
That said, the outlook changes somewhat when considering the years further ahead. For instance, in FY2, NVIDIA’s expected P/E ratio rises to the highest at 32.77, compared to Intel's 20.02 and AMD's 29.02. However, I want to emphasize the substantial uncertainty in Intel's earnings forecasts. As shown in the next chart, the consensus estimates for Intel's earnings per share (EPS) in FY 2024 range from a low of $0.15 to a high of $0.31 (a more than twofold variation) and from a low of $0.65 to a high of $2.1 (an almost fourfold variation). Given such uncertainty, I believe investors should be cautious about relying too heavily on forward P/E ratios too far into the future.
Both Intel and NVIDIA have experienced significant fluctuations in DIO over the years. Notably, both companies saw a spike in 2023 due to the COVID pandemic, which disrupted global supply chains. As the disruption faded, both firms saw a recovery (ie, a reduction in DIO). the difference in recovery is striking. Intel's DIO peaked at over 150 days in 2023 and has since decreased to 125 days a modest reduction but still above its historical average of 114 days. In contrast, NVIDIA's DIO surged to over 200 days but has rapidly dropped to 76 days, which is not only below its four-year average of 97.9 days but also near its lowest level in four years.
I expect Intel to face increasing competitive pressure as rivals like NVIDIA and AMD roll out their next-generation chips, particularly NVIDIA’s Blackwell chips. I recommend potential investors keep a close eye on inventory data, as it can signal changes in competitive dynamics for the reasons discussed here.
In addition to inventory issues and valuation risks, Intel faces a few other specific challenges. A significant portion of Intel’s current product lineup is concentrated in certain segments, such as PCs, which I believe are nearing market saturation plus a large share of Intel’s revenue comes from China. Given the ongoing trade tensions between the US and China, this heavy reliance on China poses a considerable geopolitical risk. These factors may limit Intel’s ability to adapt to technological advancements and shifting geopolitical conditions
The potential for a QUALCOMM acquisition has emerged as a new major upside catalyst. While my outlook on Intel’s business remains pessimistic based on the latest inventory data, the acquisition possibility partially offsets these negatives, leading me to upgrade my rating from Sell to Hold or if you are risk taker like Me, load the dip

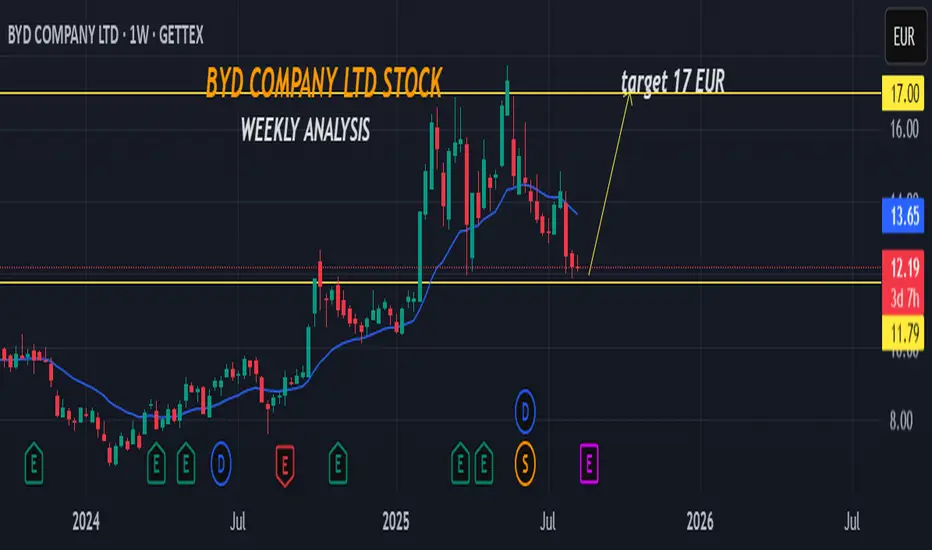
BYD COMPANY LTD STOCK.WEEKLY ANALYSISHello ladies and gentleman.The intrinsic value of one BY6A stock under the base case scenario is 22.15 EUR. Compared to the current market price of 12.1 EUR, BYD Co Ltd is undervalued by 45%.so the is a great probability long to 17 EUR.
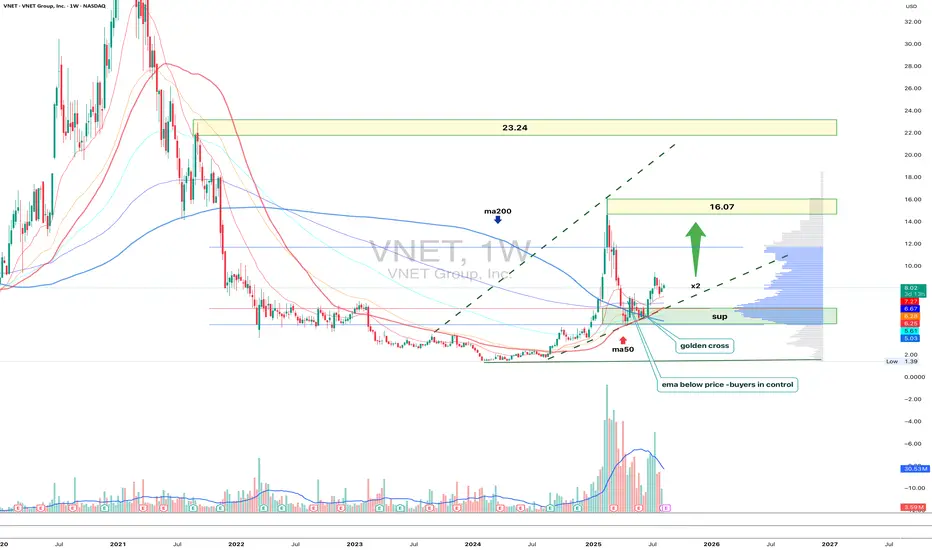
VNET 1W - second wave or second life?On the weekly VNET chart, the price has held above the 6.25–6.05 support zone, which previously triggered an impulsive rally. The current structure remains bullish: the MA50 is positioned above the MA200(golden cross) and ema below price(buyers control situation), and recent volume spikes indicate active buying interest. The next major resistance lies at 16.07 - where a key supply zone aligns with the previous local top. A breakout and consolidation above it would open the path toward the strategic target at 23.24, matching a Fibo extension and a historical distribution zone.
Fundamentally, VNET benefits from renewed investor interest in the Chinese tech sector and improved corporate earnings. Tactical plan: as long as 6.25–6.05 holds, long positions could target 16.07 first, with potential continuation toward 23.24.
A break below support cancels the bullish scenario. Sometimes the market offers a second chance and VNET may be one of those moments worth catching.
NBIS Nebius Group Among My Top 10 Picks for 2025 | Price TargetNebius Group N.V. (NBIS) presents a compelling bullish case for a potential doubling of its stock price by the end of 2025, driven by several fundamental factors that highlight its growth trajectory within the rapidly expanding AI infrastructure market.
NVIDIA Corporation (NVDA) has made a significant investment in Nebius Group N.V. (NBIS), contributing to a $700 million funding round aimed at expanding Nebius's AI infrastructure capabilities. This investment aligns with NVIDIA's strategic focus on enhancing its presence in the rapidly growing AI market.
Explosive Revenue Growth:
Nebius Group has demonstrated remarkable revenue growth, with Q3 2024 revenues reaching $43.3 million, representing a 1.7-fold increase compared to the previous quarter and a staggering 766% year-over-year increase. This surge is primarily driven by the company's core AI infrastructure business, which grew 2.7 times quarter-over-quarter and 6.5 times year-over-year. Analysts expect this momentum to continue, projecting annual revenues of approximately $731.96 million for 2025, reflecting a robust demand for AI-centric services and solutions.
Strategic Investments in AI Infrastructure:
The company is heavily investing in expanding its GPU cluster capabilities and data center capacity, with plans to allocate over $1 billion towards these initiatives. This strategic focus on enhancing AI infrastructure positions Nebius to capture significant market share as the global demand for AI technologies continues to rise. The annualized run-rate for its cloud revenue has already surpassed $120 million, indicating strong customer adoption and a growing client base that includes Fortune 500 companies.
Strong Market Position and Competitive Advantage:
Nebius Group is uniquely positioned within the AI infrastructure landscape, specializing in full-stack solutions that cater to developers and enterprises looking to leverage AI technologies. As businesses increasingly prioritize AI integration into their operations, Nebius's comprehensive offerings make it an attractive partner for organizations seeking to enhance their technological capabilities. The company’s ability to provide scalable solutions will be crucial as the demand for AI services expands.
Healthy Financials and Cash Reserves:
As of September 30, 2024, Nebius reported cash and cash equivalents totaling approximately $2.29 billion, providing a solid financial foundation to support its growth initiatives without excessive reliance on debt. This strong liquidity position allows Nebius to invest aggressively in technology and infrastructure while maintaining operational flexibility 14. Additionally, with gross margins projected to remain robust at around 55% in 2025, the company is well-positioned to improve profitability as revenues grow.

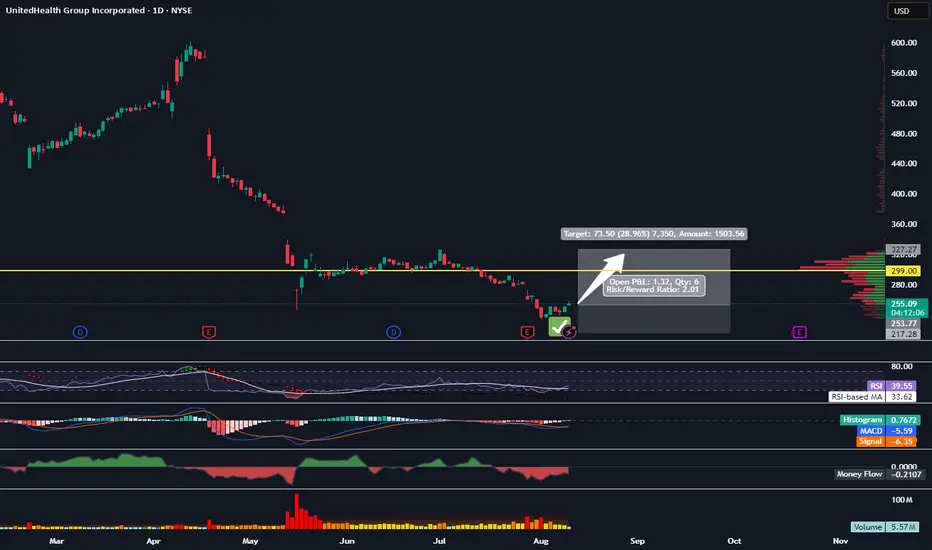
Entering UNH HereTrading Fam,
I'm not going to go into a long exposé about how great the technicals are here because, truthfully, they are not great. In fact, there is relatively little that supports any kind of entry here other than the fact that this stock is extremely oversold. Really, the only reason I even considered an entry here is that my indicator has given me a buy. If you have been following me for any length of time, you know that this thing is knocking it out of the park in stocks. But to keep it safe, I am entering a 1:2 long rrr, shooting for $327 with a $217 SL. Let's see if my little indicator can keep its amazing win streak going even without a lot of technicals to support it.
✌️Stew
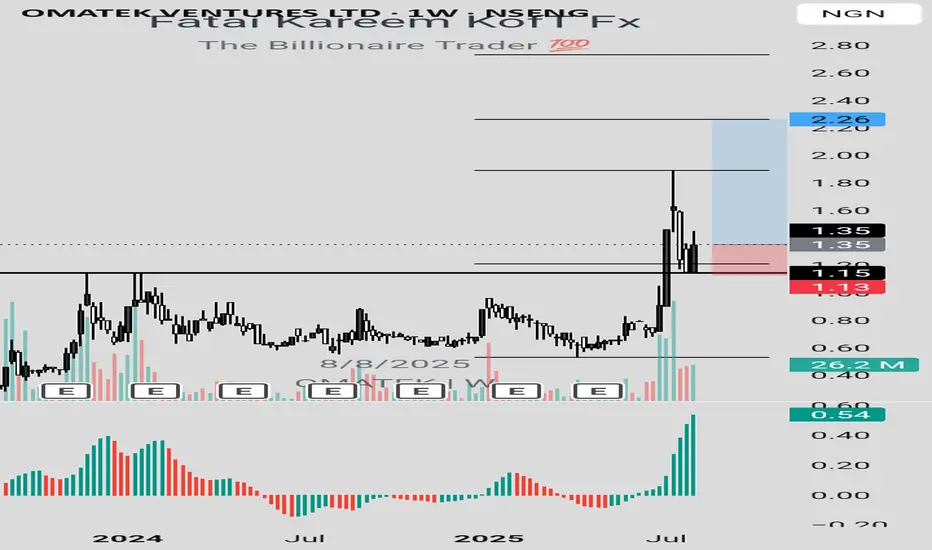
OMATEK LONG IDEAAfter getting to a resistance turned support within the discount level, bullish engulfing candlestick was formed on OMATEK stock. This is a signal that price is ready to go higher.
To take advantage of the long opportunity, you can buy at the current market price. The stop can be at N1.13 (-16.30%) while the targets are N1.89 (40%) and N2.26 (67.41%).
Confluences for the long idea:
1. Key level (resistance turned support)
2. Bullish engulfing candlestick
3. Uptrend
Disclaimer: This is not a financial advice. The outcome maybe different from the projection. Don't take the signal if you're not willing to accept the risk.
NSLTECH LONG IDEALast week, I gave a buy signal on NSLTECH stock, but price didn't get to the area where I expected the buy. However, a bullish engulfing candlestick was formed, showing that price is ready to buy at the current market price. You can buy at the current market price. The stop can be at N0.74 (-24.49%) while the targets are N1.33 (35.71%) and N1.51 (60.20%).
Confluences for the long idea:
1. Key level (Resistance turned Support level)
2. Fibonacci level (0.5)
3. Bullish engulfing candlestick
4. Uptrend
Disclaimer: This is not a financial advice. The outcome maybe different from the projection. Don't take the signal if you're not willing to accept the risk.

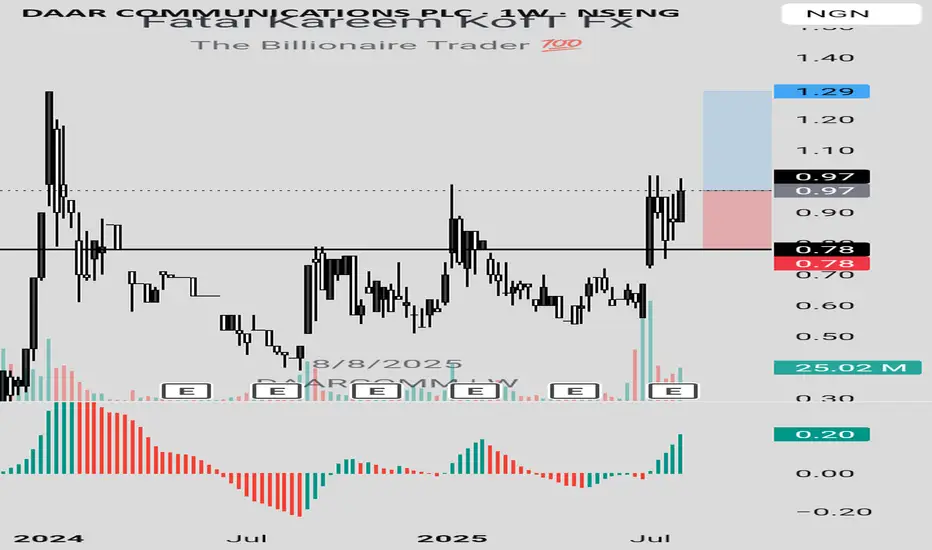
DAARCOMM LONG IDEA DAARCOMM stock, after breaking out of a trendline and retesting a support level, a bullish engulfing candlestick was formed. This is an indication that price is ready to go higher.
To take advantage of this long opportunity, you can buy at the current market price. The stop can be at N0.78 (-19.59%) while the target can be at N1.29 (32.99%).
Confluences for the long idea:
1. Trendline breakout
2. Support level
3. Bullish engulfing candlestick
Disclaimer: This is not a financial advice. The outcome maybe different from the projection. Don't take the signal if you're not willing to accept the risk.
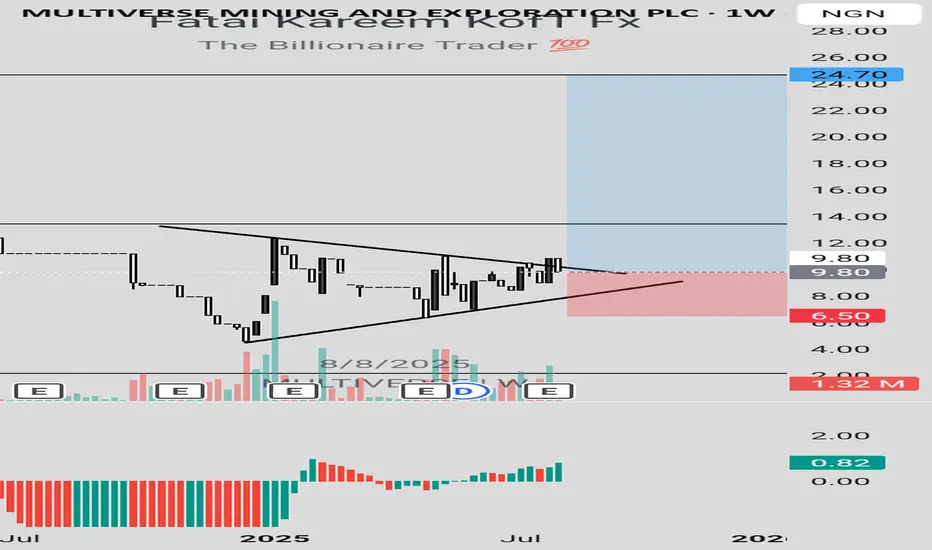
MULTIVERSE LONG IDEAMULTIVERSE just broke out of a trendline with a bullish engulfing candlestick. This happened within the discount level. Hence, this is an indication that price is ready to rally up targeting the high.
To take advantage of this long opportunity, you can buy at the current market price. The stop can be at N6.50 (-33.67%) while the targets are N12.30 (25.51%) and N24.70 (152.04%).
Confluences for the long idea:
1. Trendline breakout
2. Discount level
3. Uptrend
Disclaimer: This is not a financial advice. The outcome maybe different from the projection. Don't take the signal if you're not willing to accept the risk.
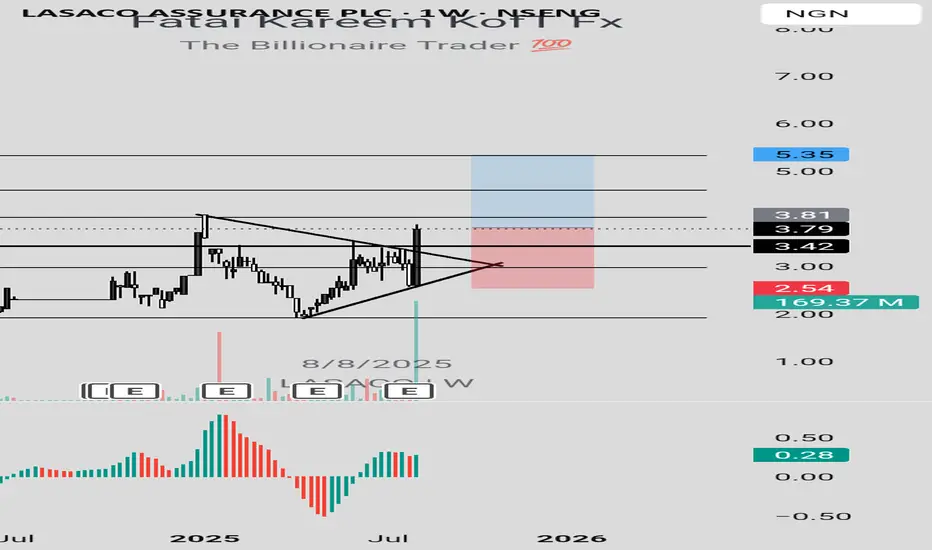
LASACO LONG IDEALASACO stock just broke out of a trendline with a strong bullish engulfing candlestick. In addition to the trendline breakout, the candle also broke a resistance level, respecting the uptrend.
To take advantage of this long opportunity, you can buy at the current market price or wait for price to drop to the resistance turned support level at N3.42. the stop can be at N2.54 (-33.33%) while the target can be at N5.35 (40.16%).
Confluences for the long idea:
1. Trendline breakout
2. Bullish engulfing candlestick
3. Strong volume momentum
4. Uptrend
Disclaimer: This is not a financial advice. The outcome maybe different from the projection. Don't take the signal if you're not willing to accept the risk.
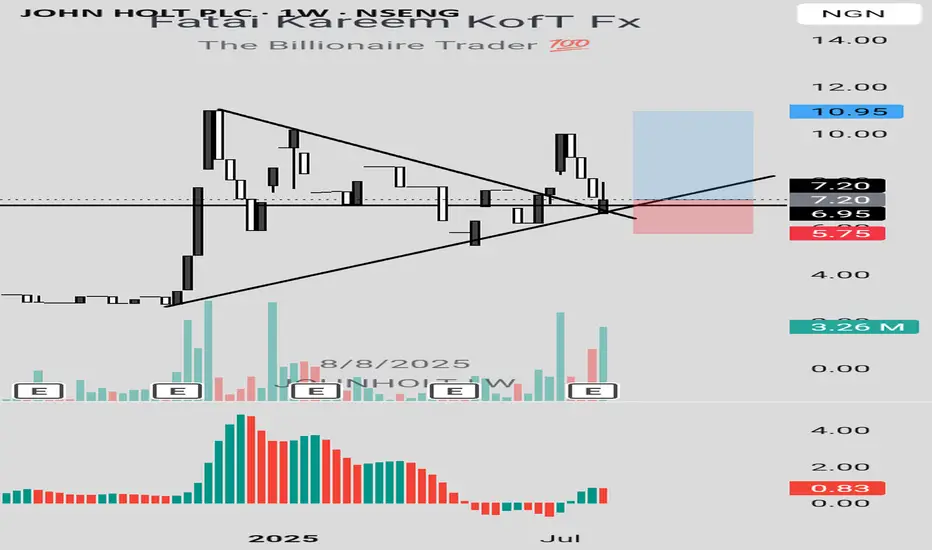
JOHN HOLT LONG IDEAJOHN HOLT stock retested a support level and trendline last week and closed above these key levels, showing the readiness of buyers to push price higher. This was confirmed with a strong volume momentum.
To take advantage of this long signal, you can buy at the current market price. The stop can be at N5.75 (-20.14%) while the targets are N10 (38.89%) and N10.95 (52.08%).
Confluences for the long idea:
1. Breakout and retest of a trendline
2. Uptrend
3. Strong volume momentum
4. Support level
Disclaimer: This is not a financial advice. The outcome maybe different from the projection. Don't take the signal if you're not willing to accept the risk.
DEAPCAP LONG IDEADEAPCAP stock, after breaking out of a trendline and retesting the trendline and support level, it formed a bullish engulfing candlestick, confirming that it's ready to continue the rally.
To advantage of this long signal, you can buy at the current market price. The stop can be at N1.10 (-19.12%) while the targets are N1.60 (17.65%), N1.94 (42.65%) and 2.36 (73.53%).
Confluences for the long idea:
1. Breakout and retest of a trendline
2. Bullish engulfing candlestick confirmation
3. Support level
Disclaimer: This is not a financial advice. The outcome maybe different from the projection. Don't take the signal if you're not willing to accept the risk.

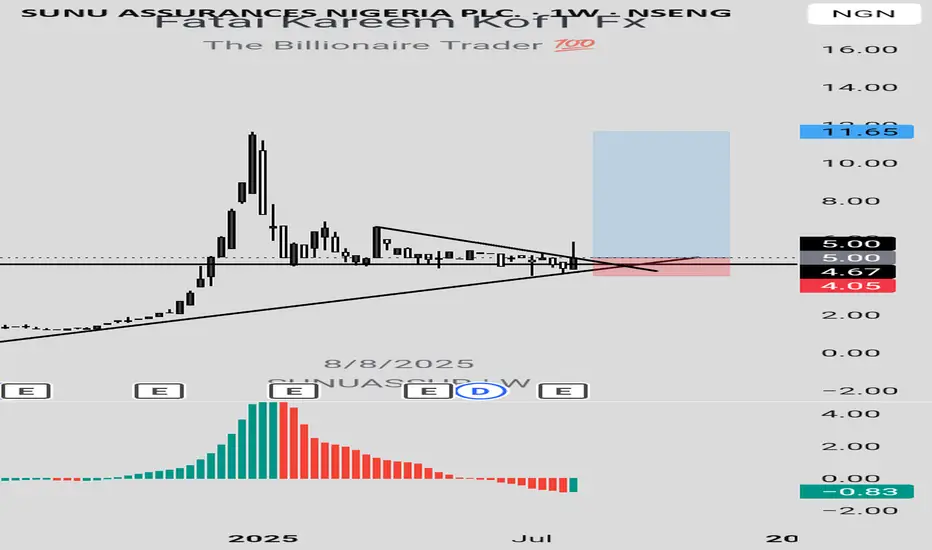
SUNUASSUR LONG IDEASUNUASSUR stock just broke out of a down trendline with a bullish engulfing candlestick confirmation. This happened at a support level in confluence with a trendline. In addition, awesome oscillator shows that the stock is in oversold region, having the potential to go higher.
To take advantage of this long signal, you can buy at the current market price. The stop can be at N4.05 (-19%) while the targets are N6.90 (38%) and N11.65 (133%).
Confluences for the long idea:
1. Bullish engulfing candlestick confirmation
2. Trendline breakout
3. Support level
4. The stock is oversold (Awesome oscillator)
Disclaimer: This is not a financial advice. The outcome maybe different from the projection. Don't take the signal if you're not willing to accept the risk.
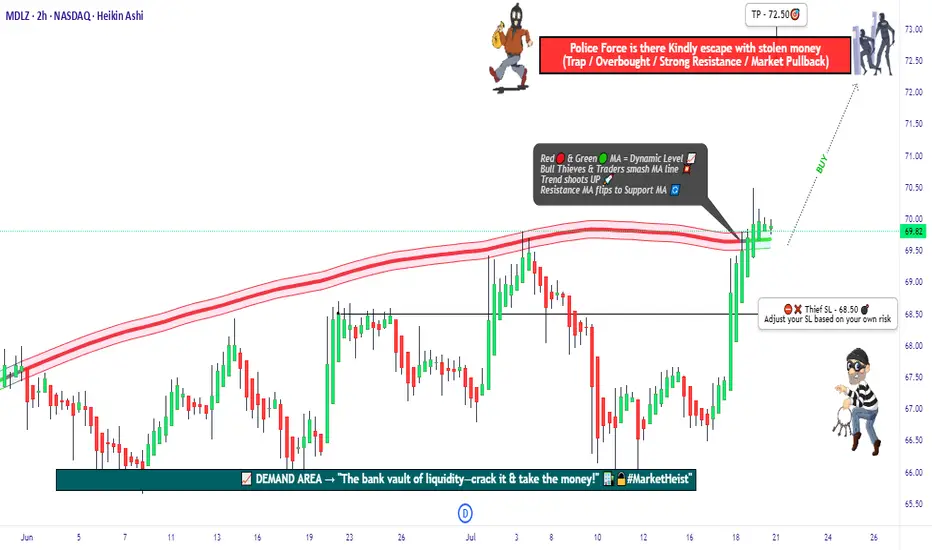
"MDLZ Heist LIVE! Quick Profit Grab Before Reversal!"🚨 MONDELEZ HEIST ALERT: Bullish Loot Zone! (Swing/Day Trade Plan) 🚨
Thief Trading Strategy | High-Risk, High-Reward Play
🌟 Greetings, Market Pirates! 🌟
Hola! Oi! Bonjour! Hallo! Marhaba!
To all Money Makers & Strategic Robbers 🤑💸—this is your blueprint to plunder "MONDELEZ INTERNATIONAL, INC" with precision.
🔎 THIEF TRADING ANALYSIS (Technical + Fundamental)
The Vault is Open! Bullish momentum detected, but caution—this is a high-risk police barricade zone (resistance level).
Overbought? Consolidation? Reversal? Yes. Bears lurk here, but we’re stealing profits before the trap snaps.
🎯 Target: 72.50 (or escape earlier if momentum fades).
🚨 Scalpers: Long-only! Use trailing stops to protect gains.
📈 ENTRY: How to Swipe the Loot
"Buy the Dip" Strategy: Optimal entries on pullbacks (15m/30m timeframe).
DCA/Layering Tactics: Spread limit orders for better risk control.
Aggressive Robbers: Enter now. Patient Thieves: Wait for retests.
🛑 STOP LOSS: Survival Rules
SL at 68.50 (nearest swing low wick on 2H chart).
Adjust based on risk/lot size—protect your capital!
⚡ CRITICAL ALERTS
📰 News Volatility: Avoid new trades during major releases. Lock profits with trailing stops!
📊 Fundamental Drivers: Check COT reports, macro trends, and sector sentiment Klick the 🔗.
⚠️ Reminder: This is NOT financial advice. DYOR and manage risk!
💥 BOOST THE HEIST!
Like 👍 + Boost 🔄 to fuel our next market robbery plan. Together, we trade smarter, steal bigger, and profit faster!
🚀 Stay tuned—more heists coming soon! 🤑🔥
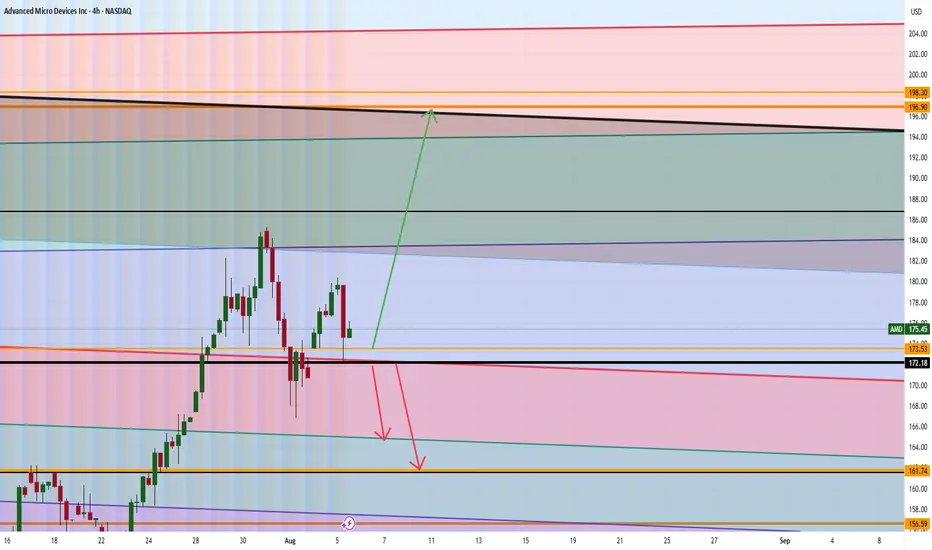
AMD Analysis Are WE GOING TO $199? Good morning trading fam
Currently we a strong bull run for AMD on the Monthly time frame.
Currently if we can hold above 172 then we will see a nice run up to 196-199 territory or higher.
If we break below the 172 we can a quick short down to the orange level we marked out.
Happy Trading
Trade Smarter Live Better
Kris
TANTALIZER LONG IDEATANTALIZER stock is looking promising. There was a bullish divergence on the awesome oscillator (daily timeframe), which was followed by a bullish change of character. This is a confirmation that the stock is ready to go higher. Price has recently dropped to the demand zone confluenced with trendline and support level, which is a good point to take a long position. After mitigating the demand zone, there was a rejection showing that buyers are willing to push price higher.
To take advantage of this long opportunity, one can buy at the current market price. The first target is N2.99 (24.58%) and the final target is N3.45 (43.75%). The stop can be at 2.10 (-12.50%).
Confluences for the long idea:
1. Bullish market structure
2. Trendline
3. Awesome oscillator divergence
4. Rejection candle
5. Support level
Disclaimer: This is not a financial advice. The outcome maybe different from the projection. Don't take the signal if you're not willing to accept the risk.

Microsoft’s Big Moves This Quarter | From Activision to AI AgentMicrosoft’s Revenue Surge: The Power of AI, Gaming, and Strategic Investments
Microsoft has released its Q1 FY25 earnings for the quarter ending in September
The stock saw a 6% drop, indicating the results fell short of investors' high hopes. Trading at over 30 times projected earnings for next year, expectations for Microsoft were significant.
CEO Satya Nadella stated
“Our AI business is set to exceed an annual revenue run rate of $10 billion next quarter, making it the fastest business in our history to reach this milestone.”
This means that AI will soon account for about 4% of Microsoft's total revenue in under three years a remarkable feat for a global giant.
If you need a quick summary, here are three main points:
1. ☁️ Azure’s growth is slowing. As Microsoft’s key player in the AI competition, Azure grew 34%, down slightly from 35% in the prior quarter (after adjustments). This comes as Google Cloud raised the bar, with its growth accelerating from 29% to 35% during the same period.
2. 🤖 AI growth is limited by hardware supply, as capacity struggles to meet demand. Data center expansion is a long-term process, and Microsoft is investing heavily in infrastructure, aiming for a growth boost by 2025.
3. 👨👩👧👦 Consumer-focused products like Gaming and Devices are underperforming. Although not essential to Microsoft's core business, their poor performance has impacted overall results.
Here’s a breakdown of the insights from the quarter.
Overview of today’s insights:
- New segmentation.
- Microsoft’s Q1 FY25 overview.
- Key earnings call highlights.
- Future areas to monitor.
1. New Segmentation
Revised Business Segments
In August, Microsoft announced a reorganization of its business segments, effective this quarter. The purpose? To better align financial reporting with the current business structure and strategic management.
Summary of the main changes
- Microsoft 365 Commercial revenue consolidation: All M365 commercial revenue, including mobility and security services, now falls under the Productivity and Business Processes segment.
-Copilot Pro revenue shift: Revenue from the Copilot Pro tool was moved from Productivity and Business Processes to the More Personal Computing segment under Search and news advertising.
-Nuance Enterprise reallocation: Revenue from Nuance, previously part of Intelligent Cloud, is now included in Productivity and Business Processes.
-Windows and Devices reporting combination: Microsoft now reports Windows and Devices revenue together.
Impact of These Changes:
Core Segments Overview:
In summary:
- The Productivity and Business Processes segment has grown significantly.
- The Intelligent Cloud segment has decreased due to the reallocation of Nuance and other revenue.
Products and Services Overview:
- M365 Commercial now includes Nuance, shifted from the Server products category, along with integrated mobility and security services.
- Windows & Devices have been merged into a single, slower-growth category.
Additional Insights:
- Azure, Microsoft's cloud platform, is reported within 'Server products and cloud services.' Although its growth rate is shared by management, exact revenue figures remain undisclosed.
Azure’s past growth figures have been adjusted for consistency, with the last quarter’s constant currency growth recast from 30% to 35%, setting a higher benchmark. Tracking these metrics is challenging due to limited revenue disclosure, but this recast indicates Azure's raised growth expectations.
2. Microsoft’s Q1 FY25 Performance
Financial Summary:
-Revenue: Up 16% year-over-year, reaching $65.6 billion (exceeding estimates by $1 billion). Post-Activision Blizzard acquisition in October 2023, the growth was 13% excluding the merger.
New Product and Services Segmentation Results
- Server products & cloud services: $22.2 billion (+23% Y/Y).
- M365 Commercial: $20.4 billion (+13% Y/Y).
- Gaming: $5.6 billion (+43% Y/Y), influenced by Activision.
- Windows & Devices: $4.3 billion (flat Y/Y).
- LinkedIn: $4.3 billion (+10% Y/Y).
- Search & news advertising: $3.2 billion (+7% Y/Y).
- Enterprise & partner services: $1.9 billion (flat Y/Y).
- Dynamics: $1.8 billion (+14% Y/Y).
- M365 Consumer products: $1.7 billion (+5% Y/Y).
Core Business Segments Breakdown:
- Productivity and Business Processes: Increased 12% Y/Y to $28.3 billion, supported by M365 Commercial, especially Copilot adoption.
- Intelligent Cloud: Grew 20% Y/Y to $24.1 billion, with Azure AI driving growth.
- More Personal Computing: Grew 17% Y/Y to $13.2 billion, including a 15-point boost from Activision. Devices fell, but search and ad performance improved under new segmentation.
Key Observations:
- Microsoft Cloud revenue climbed 22% Y/Y to $39 billion, making up 59% of total revenue (+3 percentage points Y/Y).
- Azure continues to drive cloud services and server products' growth.
- Xbox growth has surged due to the Activision acquisition since Q2 FY24, expected to stabilize by Q2 FY25.
- Windows OEM and devices combined, showing a 2% decline in Q1 FY25.
- Office rebranded to Microsoft 365; updated naming will be used starting next quarter.
- Margins: Gross margin at 69% (down 2pp Y/Y, 1pp Q/Q); operating margin at 47% (down 1pp Y/Y, up 4pp Q/Q).
- EPS: Increased 10% to $3.30, beating by $0.19.
Cash Flow and Balance Sheet:
- Operating cash flow: $34 billion (52% margin, down 2pp Y/Y).
- Cash**: $78 billion; Long-term debt**: $43 billion.
Q2 FY25 Outlook:
- Productivity and Business Processes: Anticipated 10%-11% Y/Y growth, steady due to M365, Copilot inclusion, and expected LinkedIn growth of ~10%. Dynamics set to grow mid-to-high teens.
- Intelligent Cloud: Projected 18%-20% Y/Y growth, slightly slowing, with Azure growth expected between 28%-29%.
- More Personal Computing: Forecasted ~$14 billion revenue, declines in Windows, Devices, and Gaming anticipated, with some offset from Copilot Pro.
Main Takeaways:
- Azure's growth slowed to 34% Y/Y in constant currency, with AI services contributing 12pp, up from 11pp last quarter. This marks a dip from the recast 35% prior and included an accounting boost.
- Capacity limitations in AI persist; more infrastructure investments are planned, with reacceleration expected in H2 FY25.
- Commercial performance obligations grew 21% to $259 billion, up from 20% in Q4.
- Margins were pressured by AI infrastructure investments; Activision reduced the operating margin by 2 points.
- Capital expenditures increased by 50% to $15 billion, half dedicated to infrastructure, with further Capex growth expected.
- Shareholder returns included $9.0 billion through buybacks and dividends, matching Q4 repurchases.
Earnings Call Highlights:
Azure AI saw a doubling of usage over six months, positioning it as a foundation for services like Cosmos DB and SQL DB. Microsoft Fabric adoption grew 14% sequentially, signaling rapid uptake.
AI Expansion: GitHub Copilot enterprise use surged 55% Q/Q, with AI-powered capabilities used by nearly 600,000 organizations, a 4x increase Y/Y.
M365 Copilot has achieved a 70% adoption rate among Fortune 500 companies and continues to grow rapidly.
LinkedIn saw accelerated growth in markets like India and Brazil and a 6x quarterly increase in video views, aligning with broader social media trends.
Search and Gaming: Bing’s revenue growth surpassed the market, while Game Pass hit a new revenue record, propelled by Black Ops 6
Capital Expenditures: CFO Amy Hood highlighted that half of cloud and AI investments are for long-term infrastructure, positioning the company for sustained growth.
4. Future Outlook
Energy Needs: Microsoft, facing higher power demands, plans to revive a reactor at Three Mile Island with Constellation Energy by 2028 to power its AI data centers sustainably.
Autonomous AI Agents: Coming in November, these agents will perform tasks with minimal human input, enhancing efficiency. Copilot Studio will allow businesses to customize these agents, with 10 pre-built options to start.
Industry Impact: Salesforce has launched Agentforce, signaling increased competition. CEO Mark Benioff recently compared Microsoft’s Copilot to the nostalgic Clippy, stoking rivalry.
For further analysis stay tuned

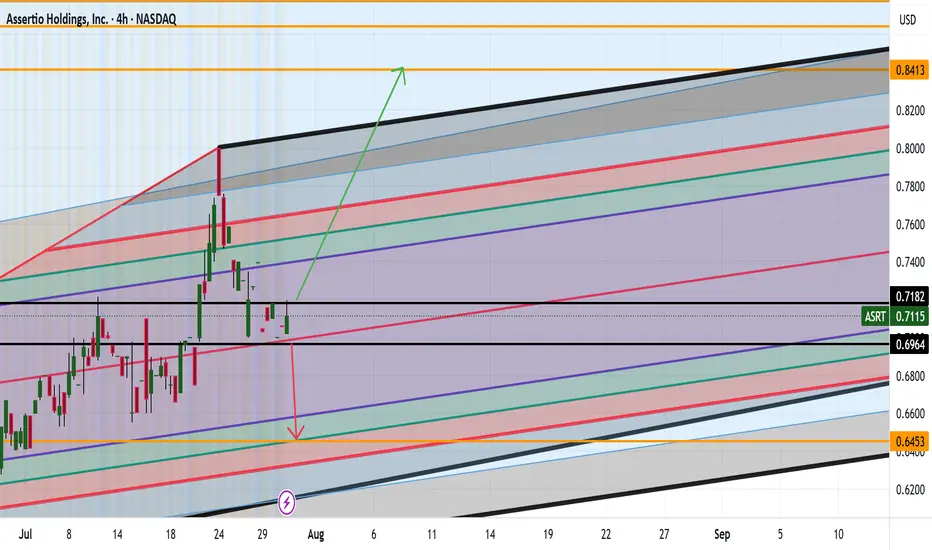
ASRT ARE WE HEADING TO .84CENTS AND HIGHER? Good afternoon Trading Family
So looking at ASRT we see two options here:
1) We break .71 cents high which then would give confirmation to a drive up to 84 cent range
2) We break below the .69 cent low which then would help us confirm a possible short down to .64 cents
Trade Smarter/ Live Better
Kris