ADM 1D: 10-Month Channel Says Goodbye?Since July 18, 2024, ADM had been locked in a clean downward channel — well-behaved, well-respected. But in May 2025, the structure finally cracked: price broke out, crossed above the 50-day MA, and pulled back for a textbook retest right on the channel’s upper edge. So far, the breakout is holding. The next targets sit at 50.6 (0.618), 53.5 (0.5), and 56.5 (0.382). As long as price stays outside the channel, the bullish structure remains intact.
Connor’s RSI down below is quietly doing its job — already bounced from deep oversold, now curling up with momentum. It’s not flashy, but in this context it signals early strength before the crowd notices.
Fundamentally, ADM is still cleaning up after the early-2024 accounting scandal that nuked investor trust. But management moved fast: reinstated buybacks, tightened guidance, and Q1 2025 came in strong — $22.6B revenue, $0.88 EPS, both beating expectations. ADM remains a pillar of the U.S. ag sector, and in an era of global food anxiety, that means structural demand isn’t going anywhere.
Вот адаптированный перевод финального блока под **английский пост**, в том же живом и профессиональном стиле:
Enjoyed the idea? Like, share, and drop your thoughts in the comments.
It helps keep the content visible, free, and accessible to everyone.
Got your own charts or takes? Let’s discuss them below.
Stockstobuy

APLD - SWING TRADE BUYING ZONESAPLD. The stock was in a perfect parallel channel accumulating zone for many days. Finally we saw a breakout 8.47$
The stock rallied almost a 100 percent after the breakout and is still in a good uptrend.
Major rejection was at 10.20 to 11.65 which is the weekly bearish order block. We have seen 4 to 5 sweeps inside this bearish order block previously and now there is no liquidity left inside the order block.
The stock has made a bullish retest on the previous bearish order block at 11.65 and now its acting as a bullish buying zone.
However, there are a lot of bullish Order blocks waiting to be filled in the uptrend.
In my opinion, best way to ride this stock is to wait and buy at the order blocks.
keep adding if it goes down to fill the other order blocks that are present at the breakout.
Good buying zones for a Swing trade are 10.40 , 10.00 and 8.50 which is the strongest and most reliable.
SO WAIT AND ENJOY!


Stocks & ETF : Breaking out and Ready for Massive Bull runBelow is the list of stocks and ETFs that are in the early stage of breakout with ultra volume level. Good time to buy.
NSE:SCHNEIDER
NSE:ASAHIINDIA
NSE:HINDZINC
NSE:ABREL
NSE:TATAINVEST
NSE:UJJIVANSFB
NSE:PNBHOUSING
NSE:BANDHANBNK
NSE:DLF
NSE:ICICIGI
NSE:IDFCFIRSTB
NSE:SHRIRAMFIN
NSE:AUTOBEES
NSE:INDUSINDBK
NSE:ABB
NSE:TATACHEM
NSE:GODREJPROP
NSE:SIGNATURE
NSE:JPPOWER
NSE:HFCL

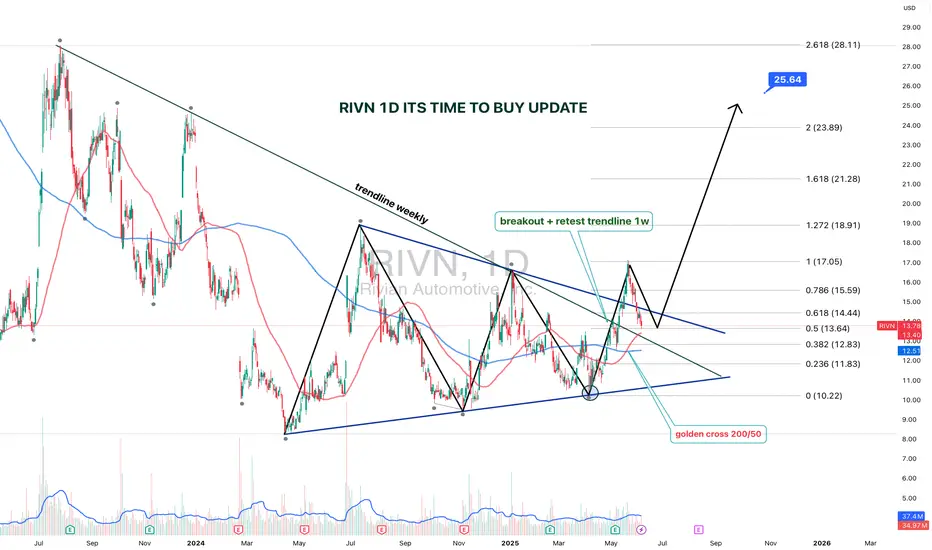
RIVN 1D — It’s Time to Buy: Setup UpdateThe setup on Rivian (RIVN) just got upgraded from “interesting” to “strategically significant.” We’re looking at a textbook symmetrical triangle that’s been developing since July 2023, with a clean breakout and retest on the weekly trendline.
The breakout was followed by a bullish retest, right at the intersection of the triangle base and the key trendline. Volume kicked in, price held — and that’s what smart money calls confirmation.
Now, the Golden Cross is live: the 50-day MA just crossed the 200-day MA from below. Price is confidently holding above both — momentum is shifting hard. Fibs from the bottom (10.22) to the last local top (17.05) project the first target at $17, and the extended Fibonacci confluence gives us $25.64 as a long-range goal (2.618 extension).
The weekly trendline — which acted as resistance for over a year — has flipped to support. Price action respects it, bulls are loading, and structure is clean.
This is not just a bounce. It’s a technical rotation from accumulation to expansion.
The time to talk about potential is over — price action has spoken.
NVIDIA 1D — When “Head & Shoulders” Aren’t Just for the GymOn the daily chart, NVDA has broken out of the descending channel and reclaimed the 50-day moving average (MA50), triggering a classic inverted head and shoulders formation. Price is now holding above the key $113–$114.50 zone, confirming a structural shift. As volume picks up, buyers are eyeing the next levels of resistance.
Near-term upside targets: – $119.80 (0.5 Fibonacci) – $127.62 (0.382) – $137.28 (0.236) — primary resistance zone – Extended target — $152.91 (1.0 Fibonacci projection)
Technical setup: — Breakout from channel + above MA50
— Inverted head and shoulders pattern completed
— $114.50–$118.00 now acts as buyer support
— EMA and MA convergence supports trend reversal
— Increasing volume on rallies supports bullish momentum
Fundamentals: NVIDIA remains the AI and semiconductor sector leader. Growing demand for high-performance GPUs in AI and data centers positions NVDA as a core tech play. Expectations of strong earnings and continued institutional accumulation support the bullish narrative.
The confirmed breakout and inverted H&S setup mark a clear structural reversal. As long as price stays above $114.50, the path toward $127–$137 remains the primary target zone, with $152.91 in sight if momentum continues.

U Unity Potential Buyout Soon?!If you missed my previous signal on U (Unity):
Now Unity Technologies (NYSE: U) just caught fire — surging 12.5% in a single day — on a massive uptick in volume that should have every sharp trader watching closely. With $39.1M in volume against a daily average of 9.4M shares, something is clearly brewing beneath the surface.
But this isn’t just about technicals — the options market is lighting up with unusual activity, and there’s fundamental buyout potential that’s getting harder to ignore.
🔍 Options Traders Are Making Bold Bets
Yesterday: Traders loaded up on January 16 $37 strike calls — deep out-of-the-money, high-risk, high-reward plays.
Today: A massive $3.5 million bet was placed on the $30 strike calls, also expiring January 16.
These aren’t casual bets. This is smart money positioning for a potential takeover or major catalyst, and the timeline is clear: January 2025.
📈 Why a Buyout Could Be Back on the Table
Let’s rewind. On August 9, 2022, AppLovin (APP) made an unsolicited offer to acquire Unity in an all-stock deal worth $17.5B, valuing Unity shares at $58.85 — an 18% premium at the time. Unity rejected the deal.
Fast forward to today:
AppLovin's market cap has exploded — now sitting at a jaw-dropping $127B, up 3,800% since late 2022.
Unity, meanwhile, is a shadow of its former self, trading far below its ATH of $201.12 (November 2021), with ongoing struggles in monetization and competition.
But this disparity creates a prime M&A setup:
AppLovin now has the firepower and strategic incentive to revisit the acquisition — with Unity’s depressed valuation, it’s arguably a bargain.
The AI + gaming narrative is red hot. Combining Unity’s engine with AppLovin’s ad and monetization capabilities could be the synergy Wall Street loves.
🎯 The Trade Setup
Unity just broke out with conviction on high volume — this could be the first leg of a larger move.
Options flow suggests bullish sentiment into early 2025.
A renewed takeover offer could easily push the stock back toward the $50–60 zone, if not higher.
🧠 Final Thoughts
Unity is no stranger to volatility, but when volume spikes, options explode, and a cash-rich suitor like AppLovin is thriving, traders should sit up and pay attention.
We may be watching the early stages of a buyout story 2.0 unfold — and Wall Street might be starting to price it in.
📌 Watch Unity (U) closely in the coming weeks. The market may be whispering — or shouting — "Takeover incoming."

NASCON LONG IDEA CONTINUATIONNASCON stock reached its all time high value of around 77 in January 2024. This happened after a bearish divergence signal from the awesome oscillator. Then, it dropped into the discount level. After which a bullish divergence signal was given, followed by a breakout. Since that breakout, price has been going up and rally for the all-time-high value. The first long opportunity could have been in November 2024 when the price was around 30. The next opportunity was when the price was around 44. Then the next opportunity was when price was around 54. Joining the rally now is not too late since the stock has a potential to hit 77.
Confluences for the long idea
1. Price was coming from the discount level.
2. Price broke out of a down trend line.
3. Price has been rally after a bullish divergence signal given by the awesome oscillator.
4. Bullish engulfing candlestick was formed recently after breaking a key level.
Disclaimer: this is not a financial advice. The outcome maybe different from the projection. If you can't accept the risk, don't take the signal.

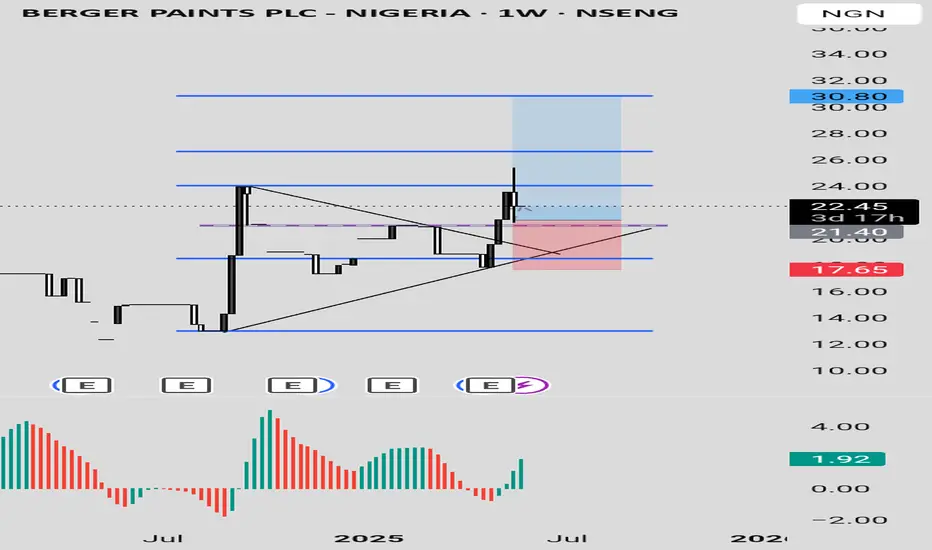
Berger Paints PLC Berger Paints PLC stock is showing a bullish signal for appreciating in value. The price dropped into a discount level and broke a down trend line with a strong bullish candle, closing above the trendline. This happened when the price was also in an oversold region as indicated by Awesome Oscillator.
Currently, there has been a pull back with a rejection, showing more confidence in the bullish move. The stock can be bought at the current price while targeting 24, 26.60 and 30.80 as the final target based on the Fibonacci level.
Confluences for the long signal:
1. Price is coming from a discount level
2. Price was in oversold level before and it is showing more bullish signal
3. Price had broken out of a down trend line with a strong bullish candle
4. There was a strong rejection from last week candle.
Disclaimer: this is not a financial advice. The outcome maybe different from the projection. Don't take the signal if you don't accept the risk.
RT BRISCOE PLC LONG IDEART BRISCOE PLC stock, after reaching its all time high, dropped to discount level. Currently, it has broken out of down trend line with a strong weekly bullish candle closing above a the down trend line and resistance level. The awesome oscillator is also in the oversold region with a bullish signal. An aggressive trader or investor can buy at the current price while a conservative trader or investor may wait for a drop to around 2.20 and 2.30 to place a buy. While you can also so spread your risk by buying at the current market price and add more positions when price drop towards the resistance turned support.
The entry is at the current market price or buy at 2.20 while the stop can be at 1.73 and the target can be around 2.90 and 4.30.
Confluences for the long signal:
1. Price is in discount level
2. Price broke out of a down trend line and resistance level with a strong bullish candle.
3. Awesome oscillator is in oversold region and showing bullish signal.
Disclaimer: this is not a financial advice. The outcome maybe different from the projection. If you can't accept the risk, don't take the signal.

SMCI LONG IDEASMCI broke out of a downtrend and support level with a strong weekly bullish candle. This is a signal that the stock is ready for appreciating in value. The first signal was in November 2024 when there was a divergence on awesome oscillator. This was followed by a breakout of down trend line in February 2025, which made price to move from around 36 to around 66.
Currently, price is showing a strong momentum to rally up again. With a pullback to the key level, the best time to buy the stock is at current price or between 38 and 40. An aggressive trader/investor could have when the previous weekly candle closed bullish, while a conservative trader/investor would have waited for the pullback to the key level which is what's happening at the moment.
The entry is around 38 and 40 while the stop could be 25 and the target can be 66 and 119.
Confluences for the signal:
1. Price broke out of a down trend line and closed with a strong weekly bullish candle.
2. Price also closed above a support level.
3. Price was coming from a strong support level.
4. Awesome oscillator is still below 0 and it's just resuming bullish region.
Disclaimer: this is not a financial advice. The outcome maybe different from the projection. If you can't accept the risk, don't take the signal.

GME LONG IDEA GME has been in a downtrend for a while. The first signal for long was in April 2024 when price was in an oversold region and there was a divergence on the awesome oscillator. This was followed by a breakout of downtrend. From around 16, price went up to 64.
The current price action shows that price is about to rally up again. A weekly bullish candle closing above 30 is a good signal for a long. Price has broken out of a downtrend and support level, closing above these key levels is a good signal to target the high. An aggressive trader or investor may buy at a current price. While a conservative trader may wait for price to close and buy the following week or wait for price to retrace to the support level before placing the buy. To spread risk, one can buy at the current price, add more positions when price retraces to the key level. This will save from missing out and also balance the risk.
Entry could be at current price or 30 while the target can be 48 or 65.
The confluences for the buy are as follows:
1. Downtrend breakout with a weekly bullish candle closing above it.
2. Price respecting uptrend
3. Awesome oscillator resuming bullish momentum
4. Price breaking out of support level.
Disclaimer: this is not a financial advice. The outcome maybe different from the projection. If you can't accept the risk, don't take the signal.

AMD LONG IDEAAMD stock has been in a downtrend for a while. This is also confirmed with the awesome oscillator being in oversold region. However, there's a breakout of the downtrend. This is also supported with price breaking and closing above a support level. An aggressive trader or investor can buy at the current market price. While a conservative trader or investor can wait for price to pull back to the support level before buying.
The entry will be 101.70 while the stop will be 76.05 and the final target will be 226.77.
Confluence for this signal are as follows:
1. Awesome oscillator in oversold region
2. Awesome oscillator divergence
3. Downtrend breakout
4. Weekly bullish candle closing above down trend line and support level.
5. Price respecting uptrend
Disclaimer: This is not a financial advice. The outcome maybe different from the projection. If you can't accept the risk, don't take the signal.

EVLV 1WEVLV — a rectangle pattern has formed, and the 100 MA has crossed above the 200 MA, signaling the start of a potential trend reversal. Targets: $8.29 and $12.94.
As of May 2025, the fundamental outlook for Evolv Technologies Holdings Inc. (ticker: EVLV) is as follows:
The company continues to show strong revenue growth and improving key financial metrics, despite remaining unprofitable. Revenue for 2024 reached $103.9 million, up 31% from 2023, while the net loss was halved to $54 million. EBITDA improved to -$21 million from -$51.8 million the year before. Annual recurring revenue (ARR) grew by 39% to $99.4 million. The company maintains a strong financial position with $51.9 million in cash and zero debt.
The stock is currently trading at $4.44, above its estimated intrinsic value of $2.76 according to AlphaSpread. Analysts remain optimistic, giving EVLV a “Strong Buy” rating and forecasting an average price target of $5.31, suggesting about 19.6% upside potential.
However, investors should keep in mind that the company is still unprofitable, and the current market valuation exceeds its fundamental value.

Coal India May Touch Green Line Soon....Coal india (COALINDIA) Is in Uptrend and uska next Target 427 tak ho sakta hai...
Be Ready with ur capital

NVO entering a great buying zoneNOVO has entered into the golden retracement for and good buying zone.
Looking to buy between 62.50 and 60.
Sell targets $90, 110 and 135.

Crossed over 6.05 SKLZSklz will be over 10$ next year mark my words!!!
Daily booming primed for a breakout of the oldest bearish trends dating back to the reverse split… been holding and buying for years got stuck in and now we are bullish with a good avg price waiting for half sell off north off 11.53$ riding the rest.
16.7m shares i own 3.1k

UPS United Parcel Service Stock. Top stock to buy in 2025UPS United Parcel Service Stock. Top stock to buy in 2025 after reaching the strong monthly demand level. It took 50 months to reach it and now it's trying to play out as expected. Long-term longs for this American stock.

MCHP Possible Correction? Is MCHP Correcting ?
Well based on hitting a four target in this bullish swing , I can sway makes sense here is the full scope are where we are heading before another move up
Kris/Mindbloome Exchange
Trade Smarter Live Better

Walt Disney Co | DISThe Walt Disney Company is reportedly exploring options to sell or find a joint venture partner for its India digital and TV business, reflecting the company's ongoing strategic evaluation of its operations in the region. The talks are still in the early stages, with no specific buyer or partner identified yet. The outcome and direction of the process remain uncertain. Internally, discussions have commenced within Disney's headquarters in the United States as executives deliberate on the most viable course of action. These deliberations signify the company's willingness to adapt and optimize its business operations to align with changing market dynamics. The Wall Street Journal reported on July 11 that Disney had engaged with at least one bank to explore potential avenues for assisting the growth of its India business while sharing the associated costs. This approach suggests a proactive stance by the company to explore partnerships or arrangements that can drive growth while minimizing financial burdens. While it is too early to ascertain the exact direction this exploration will take, the developments in Disney's India business warrant attention, as they may shape the future landscape of the company's presence in this all-important region.
The ongoing shift from traditional TV to streaming has placed Disney and its competitors in a costly and transformative phase. As part of this transition, Disney is actively cutting costs amid macroeconomic challenges that have impacted its advertising revenue and subscriber growth. CEO Bob Iger has been at the forefront of these changes, and his contract was recently extended through 2026 to allow him sufficient time to make transformative changes while strengthening the bench with future leaders of the company.
One of the key considerations for Disney is evaluating its portfolio of TV networks, including ABC and ESPN. Bob Iger has expressed a willingness to be expansive in assessing the traditional TV business, leaving open the possibility of selling certain networks while retaining others acknowledging that networks like ABC may not be core to Disney's new business model. ESPN, as a cable TV channel, is being approached differently. Disney is open to exploring strategic partnerships, such as joint ventures or offloading ownership stakes, to navigate the challenges faced by the sports network. CEO Iger, who had previously expressed pessimism about the future of traditional TV, has found the situation to be worse than anticipated since his return to Disney.
Although the linear networks segment, which accounts for Disney's TV properties such as ABC, National Geographic, FX, and FreeForm, has struggled to grow in the recent past, this segment is still an important part of the company's business, which is evident from the positive operating income reported by this segment in fiscal 2022. As below data reveals, the DTC business and content licensing made operating losses in FY 2022 which were offset by the operating income reported by linear networks. For this reason, investors will have to closely monitor a potential sale of TV assets to evaluate the impact of such a decision on Disney's profitability.
The broadcasting landscape is experiencing a significant shift, with uncertainties surrounding its future and the changing nature of consumer preferences. While linear television channels are not expected to disappear immediately, their consumption continues to decline as viewers increasingly favor OTT platforms. This transition represents a fundamental trend shaping the industry. In terms of business models, subscription video-on-demand (SVOD) services will continue to grow with targeted advertising.
As the ascent of streaming video continues, cable, satellite, and internet TV providers in the United States faced their most significant subscriber losses to date in the first quarter of 2023. Analyst estimates indicate a collective shedding of 2.3 million customers during this period. Consequently, the total penetration of pay-TV services in occupied U.S. households, including internet-based services like YouTube TV and Hulu, dropped to its lowest point since 1992, standing at 58.5%, according to Moffett's calculations.
In Q1, pay-TV services in the U.S. witnessed a nearly 7% decline in customers compared to the previous year, with cable TV operators experiencing a 9.9% decline, while satellite providers DirecTV and Dish Network registered subscriber losses of 13.4%. Virtual MVPDs, which are multichannel video programming distributors, also suffered significant losses, shedding 264,000 customers during the quarter. Comcast, the largest pay-TV provider in the country, lost 614,000 video customers in Q1, and Google's YouTube TV was the only tracked provider to experience subscriber growth, adding an estimated 300,000 subscribers during the period. These trends illustrate the challenges faced by the pay-TV industry, with factors like increasing sports-broadcast fees driving retail prices higher, leading to cord-cutting and subsequent price adjustments by distributors. By 2026, e-Marketer predicts that the number of non-pay TV households will surpass pay TV households by over 25 million.
In efforts to achieve profitability in the streaming business, Disney has implemented significant cost-cutting measures, including saving $5.5 billion through cost reductions and layoffs, and a focus on making Disney+ and Hulu more profitable. Disney aims to enhance Hulu integration, seeing it as a vital component of the company's transition from TV to a streaming-only model. Discussions are also underway for Disney to acquire Comcast Corporation's (CMCSA) stake in Hulu, as Disney currently holds 66% ownership. The company believes that the integration of Hulu and Disney+ will bolster the streaming business and contribute to its profitability. While the negotiations with Comcast over Hulu's valuation are ongoing, the combined offering of Disney+ and Hulu is expected to be available to consumers by the end of the calendar year. Although Disney's plans for ESPN+ and the fate of its other cable channels, such as the Disney Channel, remain uncertain, Bob Iger expects ESPN to eventually move to a streaming-only model, acknowledging the disruptive nature of the traditional TV business model.
The discussions surrounding Walt Disney's TV and streaming business in India come at a critical juncture for the company, as it grapples with intensified competition and significant challenges in the market. The emergence of Reliance Industries' JioCinema streaming platform has posed a considerable threat to Disney's dominance, especially after Reliance secured digital rights for the highly popular Indian Premier League cricket tournament. This strategic move by Reliance, which offered free access to the tournament earlier this year, caused a substantial decline in Disney+ Hotstar's subscribers, a popular streaming service under Disney's India business.
Additionally, Viacom18, which is backed by Reliance and Paramount Global (PARA), made a significant impact on Disney's market position in India. Through its partnership with Warner Bros, Viacom18 secured content rights to popular shows on HBO including Succession, previously aired on Disney's platform. This collaboration forms a formidable alliance challenging Disney's dominance in the Indian market. Reliance's freemium model poses the most significant threat to Disney's current position. By offering content for free on its streaming platform, JioCinema attracted a substantial number of subscribers through the broadcast of IPL. With its ample cash reserves, Reliance has the advantage of focusing on subscriber growth without immediately focusing on monetization strategies. The loss of streaming rights for the IPL, combined with a subsequent decline in paid subscribers, had a profound impact on Disney's reputation in India in the first quarter of this year, which could very well be the most challenging Q1 Disney has had in India for a long time.
A report on video consumption trends in India by Media Partners Asia sheds light on the dynamic landscape of the online video sector in India. For the 15 months that ended in March 2023, total consumption across the online video sector reached a staggering 6.1 trillion minutes. During this period, Disney+ Hotstar emerged as the dominant player in premium VOD, capturing 38% of viewing time. The report attributes Hotstar's success to its strong sports offerings and the depth of its Hindi and regional entertainment content.
During the survey period, Zee and Sony together held a 13% share of the Indian premium video sector viewing time. While the two companies are expected to merge pending regulatory approval, they are projected to operate independently for another year, benefiting from strong engagement across sports as well as regional, local, and international content. Prime Video and Netflix, Inc. (NFLX) collectively accounted for a 10% share of viewership in the premium VOD category. Prime Video also garnered a significant portion of viewership from regional Indian titles. The report emphasizes that local content dominates premium VOD viewership, particularly outside the sports category, while international content leads paid tiers. Catch-up TV is prevalent in the free tier across freemium streaming platforms.
Although Disney was the clear winner in 2022, this report highlights a significant shake-up in the market brought about by the transformation of JioCinema. JioCinema, which previously held a mere 2% share of the premium video market, experienced a major upswing in growth since April. This surge can be attributed to JioCinema's decision to offer free live streaming of the popular IPL cricket tournament, a property that was previously exclusive to Disney-owned media in India. Despite technical glitches impacting user experience, JioCinema witnessed a more than 20-fold increase in consumption in April 2023, enabling it to dominate the premium VOD category. The report raises questions about JioCinema's ability to sustain this growth and scale in the absence of IPL action after June 2023. That being said, this could be an early indication of growth challenges Disney-owned brands may face in India.
Star India, now known as Disney Star following the rebranding last year, is expected to experience a revenue drop of around 20% to less than $2 billion for the fiscal year ending September 2023. Additionally, EBITDA is projected to decline by approximately 50% compared to the previous year. Furthermore, Hotstar is estimated to lose 8 to 10 million subscribers in its fiscal third quarter as well.
Given the current scenario, finding an outright buyer for Disney's India business is expected to be challenging. When Disney acquired the entertainment assets of 21st Century Fox in 2019, the enterprise value of the Indian business was estimated at around $15-16 billion. This high valuation, coupled with the intense competition and declining subscriber base, presents a complex landscape for potential buyers or partners.
I believe Disney stock is attractively valued today given that the company's streaming business has a long runway for growth internationally while its brand assets will continue to drive revenue higher. As an investor, I am both concerned and curious about what the future holds for Disney's linear networks segment. Going by the recent remarks of CEO Iger, major changes are on their way. A strategic decision to divest non-core assets, in my opinion, will trigger a positive response from the market. That being said, a major divestment of TV assets could materially impact the company's profitability in the next 3-5 years until its streaming business scales enough to replace lost revenue from the linear networks segment. Investors will have to closely monitor new developments to identify a potential inflection point in Disney's story.

Intel Corporation | INTCIntel reported second quarter earnings on Thursday, showing a return to profitability after two straight quarters of losses and issuing a stronger-than-expected forecast. the stock rose 7% in extended trading.
Here’s how Intel did versus Refinitiv consensus expectations for the quarter ended July 1:
Earnings per share: 13 cents, adjusted, versus a loss of 3 cents expected by Refinitiv.
Revenue: $12.9 billion, versus $12.13 billion expected by Refinitiv.
For the third quarter, Intel expects earnings of 20 cents per share, adjusted, on revenue of $13.4 billion at the midpoint, versus analyst expectations of 16 cents per share on $13.23 billion in sales.
Intel posted net income of $1.5 billion, or 35 cents per share, versus a net loss of $454 million, or a loss of 11 cents per share, in the same quarter last year.
Revenue fell 15% to $12.9 billion from $15.3 billion a year ago, marking the sixth consecutive quarter of declining sales.
Intel CEO Pat Gelsinger said on a call with analysts the company still sees “persistent weakness” in all segments of its business through year-end, and that server chip sales won’t recover until the fourth quarter. He also said that cloud companies were focusing more on securing graphics processors for artificial intelligence instead of Intel’s central processors.
David Zinsner, Intel’s finance chief, said in a statement that part of the reason the report was stronger than expected was because of the progress the company has made toward slashing $3 billion in costs this year. Earlier this year, Intel slashed its dividend and announced plans to save $10 billion per year by 2025, including through layoffs.
“We have now exited nine lines of business since Gelsinger rejoined the company, with a combined annual savings of more than $1.7 billion,” said Zinsner.
Revenue in Intel’s Client Computing group, which includes the company’s laptop and desktop processor shipments, fell 12% to $6.8 billion. The overall PC market has been slumping for over a year. Intel’s server chip division, which is reported as Data Center and AI, saw sales decline 15% to $4 billion plus Intel’s Network and Edge division, which sells networking products for telecommunications, recorded a 38% decline in revenue to $1.4 billion.moreover Mobileye, a publicly traded Intel subsidiary focusing on self-driving cars, saw sales slip 1% on an annual basis to $454 million and Intel Foundry Services, the business that makes chips for other companies, reported $232 million in revenue.
Intel’s gross margin was nearly 40% on an adjusted basis, topping the company’s previous forecast of 37.5%. Investors want to see gross margins expand even as the company invests heavily in manufacturing capability.
In the first quarter, the company posted its largest loss ever as the PC and server markets slumped and demand declined for its central processors. Intel’s results on Thursday beat the forecast that management gave for the second quarter at the time.
Intel management has said the turnaround will take time and that the company is aiming to match TSMC’s chip-manufacturing prowess by 2026, which would enable it to bid to make the most advanced mobile processors for other companies, a strategy the company calls “five nodes in four years.” Intel said on Thursday that it remained on track to hit those goals.
Nvidia has had an amazing run, but any emerging technology, such as AI, which is bottlenecked by a single company will have issues in growth. Consulting firm McKinsey has pegged the AI market to be worth $1 trillion by 2030, but also that it was in an experimental and in early phases of commercial deployment.
While Nvidia will likely retain its leadership in GPU hardware as applied to AI for the foreseeable future, it is likely that other hardware solutions for AI systems will also be successful as AI matures. While technologist may quibble on specifics, all major AI hardware today are based on GPU architectures, and as such I will use the terms and concepts of AI hardware and GPU architecture somewhat interchangeably.
One likely candidate for AI related growth may be AMD (AMD), which has had GPU products since acquiring ATI in 2006.However, unlike Nvidia, which had a clear vision for of general-purpose GPU products (GPGPU), historically, AMD had largely kept its focus on the traditional gaming applications. AMD has developed an AI architecture called XDNA, and an AI accelerator called Alveo and announced its MI300, an integrated chip with GPU acceleration for high-performance computing and machine learning. How AMD can and may evolve in the AI may be subject of a different article.
Another contender for success in the AI applications using GPU is Intel, who is the focus of this article. Intel has maintained a consistent, if low key focus on GPU hardware focused on AI applications over the last decade. Intel’s integrated HD Graphics is built into most modern processor ICs; however, these are insufficient compared to dedicated GPUs for high-end inferencing or machine learning tasks.
It has 2 primary GPU architectures in production release:
In 2019 Intel Corporation acquired Habana Labs, an Israel-based developer of programmable deep learning accelerators for the data center for approximately $2 billion. Habana Labs’ Gaudi AI product line from its inception focused on AI deep learning processor technologies, rather than as GPU that has been extended to AI applications. As a result, Gaudi microarchitecture was designed from the start for the acceleration of training and inferencing. In 2022 Intel announced Gaudi2 and Greco processors for AI deep learning applications, implemented in 7-nanometer (TSMC) technology and manufactured on Habana’s high-efficiency architecture. Habana Labs benchmarked Gaudi2’s training throughput performance for the ResNet-50 computer vision model and the BERT natural language processing model delivering twice the training throughput over the Nvidia high end A100-80GB GPU. So, Gaudi appears to give Intel a competitive chip for AI applications.
Concurrent with the Habana Labs’ Gaudi development, Intel has internally developed the Xe GPU family, as dedicated graphics card to address high-end inferencing or machine learning tasks as well as more traditional high-end gaming. Iris® Xe GPU family consists of a series of microarchitectures, ranging from integrated/low power (Xe-LP) to enthusiast/high performance gaming (Xe-HPG), data center/AI (Xe-HP) and high-performance computing (Xe-HPC). The architecture has been commercialized in Intel® Data Center GPU Flex Series (formerly codenamed Arctic Sound) and Intel® Arc GPU cards. There is some question on Xe GPU future and evolution. Intel has shown less commitment to the traditional GPU space compared to Gaudi. Nonetheless, it does demonstrate Intel ability to design and field complex GPU products as its business requires.
Intel has many other AI projects underway. The Sapphire Rapids chips implements AI specific acceleration blocks including technology called AMX (Advanced Matrix Extensions), which provides acceleration inside the CPU for efficient matrix multiplications used in on-chip inferencing and machine learning processing by speeding up data movement and compression. Intel has supporting technologies such as Optane, which while cancelled as a production line, is available for their needs of a high-performance non-volatile memory, one of the intrinsic components in any AI product.
Based on the above, Intel appears to have competitive hardware solutions, however if we look at Nvidia success in AI, it is a result of a much a software and systems focus as it is the GPGPU hardware itself. Can Intel compete on that front. Ignoring for the moment that Intel has a huge software engineer (approx. 15,000) resource, it also has- access to one of the leading success stories in perhaps the most competitive AI application – self driving cars.
Mobileye, who was acquired by Intel in 2017, has been an early adopter and leader, with over 20 years of experience in automotive automated driving and vision systems. As such, Mobileye has a deep resource of AI domain information that should be relevant to many applications. Mobileye has announced that it is working closely with Habana, as related divisions within Intel. While Intel is in the process of re-spinning out Mobileye as public company, Mobileye Global Inc. (MBLY), at present Intel still owns over 95% of shares, keeping it effectively an Intel division.
In looking at Intel, we have a company with the history, resources, and technology to compete with Nvidia and infrastructure. They have made significant investment and commitment to the emerging AI market, in times when they have exited other profitable businesses. It should also be understood that AI related product are a small percentage of overall Intel revenues (INTC revenue are more than twice NVDA, even if NVDA has 6x its market cap), and continues to keep its primary business focus on its processor and foundry business.
Hopefully for shareholders, Intel continues to push their AI technology and business efforts. Their current position is that this is strategic, but Intel is in a very fluid time and priorities may change based on business, finances, and of course the general interest and enthusiasm for AI. It is always worth noting that AI as a technical concept is mature, and appears to be cyclical, with interest in the technical community rising and falling in hype and interest once every decade or so. I remember working on AI applications, at the time labeled as expert systems in the 1980s. If we are currently at a high hype point, this may be temporary, based on near term success and disappointment in what AI does achieve. Of course, as always, “this time is different” and the building blocks of effective AI systems currently exist, where for previous iterations, it was more speculative.

#SRF Trading Zone & predictions 5 may 2025 1st ragistance 3033
2nd ragistanc 3123
1st support 2780
2nd suport 2618
OI Deta Base trade Negetive
RSi Base Negetive
Praise Action base negetive Retresment move fib level 0.5 to 0.618
mor all detail in chart pls chek it chart

Bitcoin (BITX) getting ready for a parabolic move? Here is a chart of probably my favorite swing trade for the year.
I am keeping it simple with this chart though. I am a firm believer in simple when it comes to trading. I think the previous descension and breakout is playing out very similarly to the current one. Both had a double top rejecting from their respective trendlines following the initial breaks of structure. BITX is currently making its second tap of the the trendline. If it plays out like the previous structure did that would suggest w could see one more low in store.
I don't believe this to be the case but if it is this run could be postponed until the end summer/beginning of fall. I think it is more important to point out the relative strength in Bitcoin as of late, the weakness in the US dollar, as well as global liquidity having broke out months ago.
I think the most likely scenario is a pullback from this point which will be followed by a higher low printing. I will say I also expect this pullback to be steeper than the one from the previous descension. Bitcoin and Indices are a lot more overextended than they were last time around and the structure in indices is a lot weaker than before.
All this being said I am expecting a breakout to occur over the next several weeks just based off probabilities. It all depends on if BTC and indices and hold their respective demand/support levels. Bitcoin needs to hold 85k in order for a summer breakout to occur. For the S&P equivalent level this could be somewhere around 5200-5300.
If these assets are not able to hold these levels my confidence will shift pretty dramatically. I would still expect a major rally to take place around the Q4 timeframe but I would be expecting a lot less upside. Price would likely have to chop around for a while before deciding if it wants to continue to the upside. I am basing this off market structure/Dow theory. It is important to take all possibilities into account and ultimately let the charts do the talking.
