USAR (NASDAQ)– Weekly Chart | Speculative Bounce AttemptUSAR is attempting to hold the most recent support area after a sharp correction from the October highs. The current weekly candle is showing early signs of stabilization, which opens the door for a speculative rebound setup.
I’m watching the following structure:
🔹 Entry Zone: Current price levels
🔹 Target: ~$49
🔹 Stop-Loss: Breakdown below ~$11 support
This gives a strong reward-to-risk ratio if the buyers manage to defend this weekly zone and trigger a continuation leg.
📌 Key Observations
Price retesting prior weekly support after a clean impulse–correction pattern
Sellers losing momentum as candles compress
A break and close above recent weekly highs could confirm reversal strength
⚠️ High Risk
This idea is high risk. USAR has shown high volatility, and the trend remains vulnerable until support proves itself.
Anyone considering this setup should size properly and be prepared for full stop-loss probability.
Stockstrading

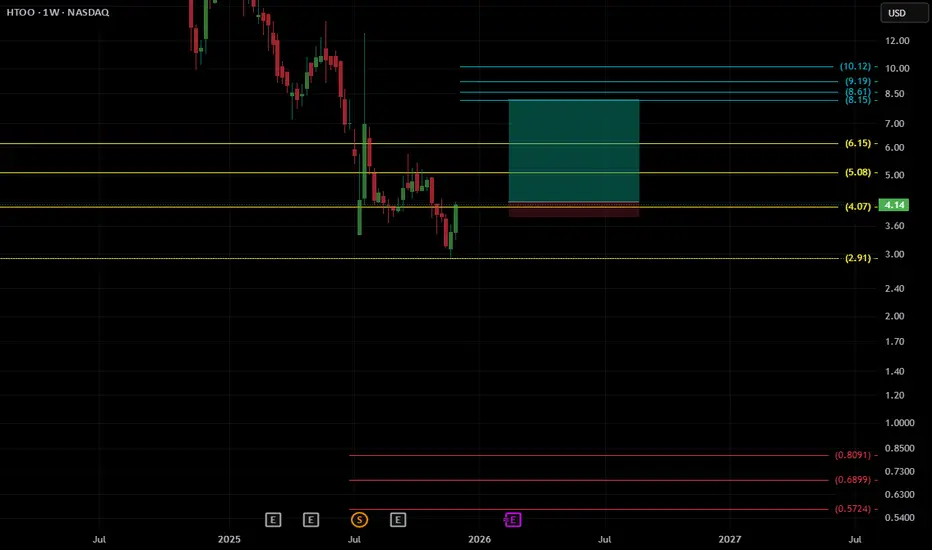
$HTOO: The Dip-Diving, Liquidity-Hunting, Emotion-Testing SetupAlright traders, gather around, because I’ve spotted something that looks like a chart…
but behaves like a roller coaster built by someone who’s never passed a safety inspection.
HTOO has officially entered that sacred zone where price either:
A) respects the levels like a well-trained student,
or
B) breaks through everything like it just got dumped and wants everyone else to suffer.
Entry : CMP
TP : 8,17
SL : 3.83
We’ve got liquidity, we’ve got weak lows, we’ve got upside targets that look like they were placed there by an optimistic toddler…
and yes — a risk-to-reward ratio that makes me feel things. Confusing things. 😵💫
Will this trade moon?
Will it tank?
Will it go sideways until my grandchildren graduate college?
Probably.
But hey — trading is 50% analysis, 50% psychology, and 100% hoping the market maker had a good breakfast.
⚠️ Financial Disclaimer:
This is not financial advice. I’m not responsible for gains, losses, emotional damage, broken keyboards, or sudden career changes.
Always do your own research, use proper risk management, and never trade based solely on posts that contain jokes.
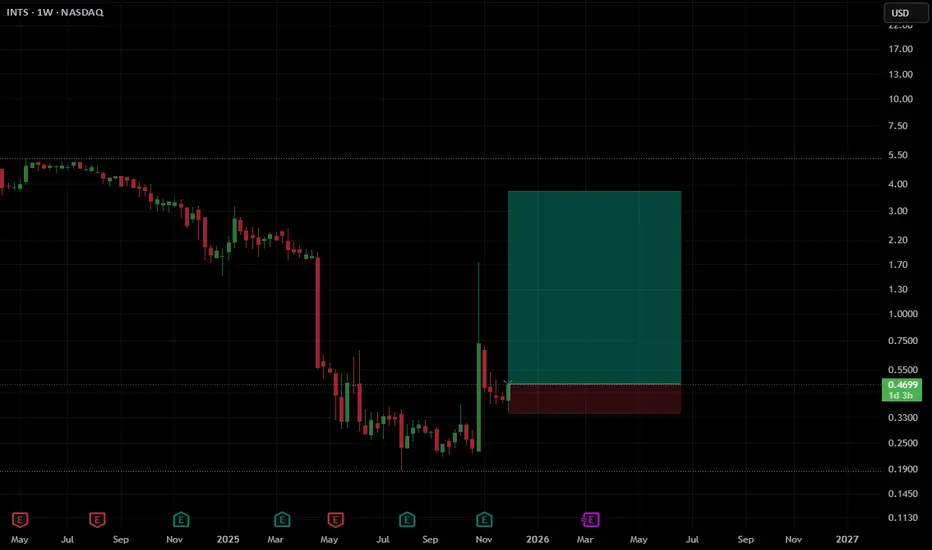
$INTS – Weekly Setup | High-Risk / High-Reward Swing PlayINTS remains heavily depressed after a long downtrend, but the recent weekly structure is starting to show signs of stabilization and potential accumulation.
This setup presents a very aggressive risk–reward, with substantial upside potential if price can hold above the recent support area.
📌 Entry
≈ 0.47 USD
📉 Stop-Loss
≈ 0.3445 USD
Below the most recent pivot — structure would be invalid if this level breaks.
🎯 Take-Profit (Main Target)
≈ 3.76 USD
Targeting prior imbalance + old liquidity zone around 3–4 USD.
📊 Risk / Reward
RR ≈ 1 : 6.8
Potential upside of over 680% if the target is reached.
📎 Technical Breakdown
Massive weekly selloff followed by compression and a strong impulse candle.
Potential CHoCH emerging.
Large liquidity pool above still untouched.
Highly speculative microcap setup; extremely volatile.
⚠️ Note
High-risk play. Valid only while price holds above 0.34 USD.
$GUTS (NASDAQ) — Weekly Reversal in ProgressAfter several months of consolidation followed by a sharp summer sell-off, GUTS is finally showing strong signs of recovery.
Last week’s candle closed decisively above the $1.60 – $1.70 supply zone, triggering a potential trend-reversal structure.
📌 Swing Trade Plan
📍 Entry: $1.85 – $1.90
🛑 Stop-loss: $1.58 (below the last bullish weekly candle)
🎯 Take-profit: $2.35 – $2.40
📊 Risk/Reward: ~1:2 ✔️
🔍 Technical Rationale
✔️ Strong breakout above resistance
✔️ Clear higher highs & higher lows structure forming
✔️ Positive reaction after earnings — bad news likely priced in
✔️ Rising volume confirming momentum and demand
⚠️ Invalidation Level
📌 A weekly close below $1.70 kills the bullish momentum and cancels the setup.
📢 Scenario Management
🔺 Plan will be updated in case of a breakout above $2.00
🔻 Or loss of $1.70, which would signal structural weakness
💬 This is just my personal market outlook — not financial advice.
If you enjoy this kind of analysis, drop a 👍 and follow for more weekly setups!
#Stocks #NASDAQ #SwingTrade #TechnicalAnalysis #PriceAction #Investing #StockMarket #ChartAnalysis #BreakoutTrading #MomentumTrading #ReversalPattern #VolumeAnalysis #MarketSetups #TradeIdeas

$USAR (NASDAQ) – Weekly Outlook | High Risk, High Reward SetupUSAR is showing an interesting structure after a heavy pullback from recent highs. Price is stabilizing above a key support zone and showing early signs of buyers stepping back in.
I’m positioning for a potential mid-term reversal with a very asymmetric RR:
🔹 Entry Zone: Current levels
🔹 Target: 180 USD area
🔹 Stop-Loss: Below recent weekly support (approx. 8 USD)
This setup is based on the idea that the stock might be completing a corrective phase and could start a new impulse leg if accumulation continues.
📌 Why it caught my attention
Large sell-off followed by deceleration in bearish volume
Weekly structure entering a potential higher-low zone
Great reward-to-risk ratio for trend continuation if price confirms support
⚠️ High Risk Disclaimer
This is a high-risk speculative setup. Volatility is elevated and price can break down if support fails.
Anyone trading this idea should:
Use strict risk management
Size positions carefully
Accept the possibility of full stop-loss being hit.

Sold Half PYPL. Raised Stops.Trading Fam,
Recently, you may remember, my new indicator triggered a BUY alert on quite a few stocks. Paypal was one of them. I entered this trade at around $69 dollars with a moderate target of $79 for a 1:2 rrr. We've nearly reached that target today. So, I've sold half, taken profit, raised my stops, and I'll let the rest ride. You know where to track the remainder of my trades.
Congrats to those who followed me. We've now won the last 13 of 13 trades for an avg. profit of 37%. As I continue to grow in experience with my indicator, we will only get better.
✌️Stew

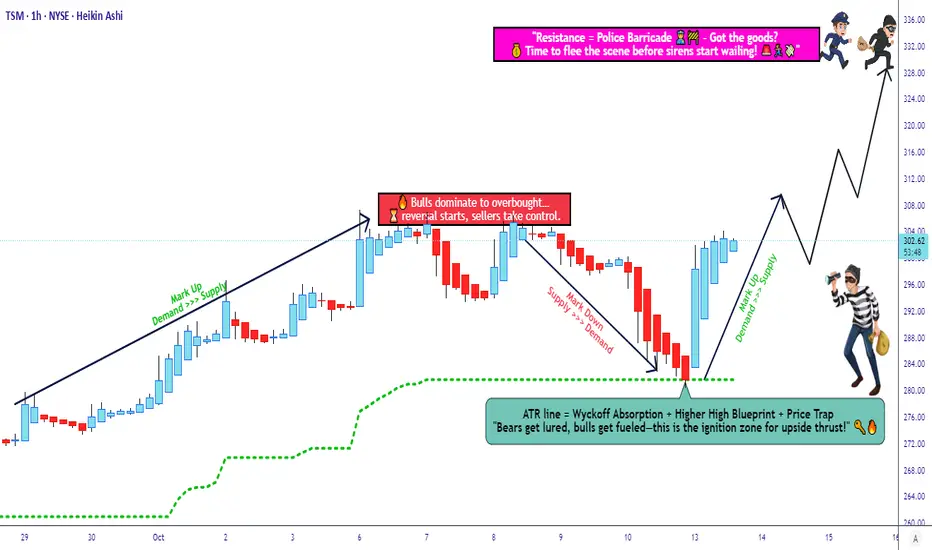
TSM Trade Setup — Strategic Entries and Risk Control🏦 TSM — “The Chip Heist: Thief Layers Up for the Big Loot” 💎
🎯 Market Setup:
TSM (Taiwan Semiconductor Mfg. Co., Ltd) is showing a bullish setup after a potential retest at the ATR line. The ATR retest will confirm buyer strength before momentum kicks in.
💰 Thief’s Master Plan (Layer Entry Tactics)
We scale in like a disciplined thief stacking gold bars:
Buy Limit 1 → 288
Buy Limit 2 → 292
Buy Limit 3 → 296
Buy Limit 4 → 300
(You can add more layers depending on your plan and risk appetite.)
🕵️♂️ Each layer reduces average entry cost and catches dips before the next move.
🧨 Stop-Loss Protocol:
Thief’s SL → 280
⚠️ This is my personal stop. Set your own stop according to your risk tolerance.
💎 Profit Extraction Zone (Target):
Target → 330 (Police Barricade / resistance zone + potential overbought trap)
Lock profits before the “trap” — that’s where pros exit quietly. 🚔💨
🧠 Key Cross-Market Links (For Confirmation)
Watch correlated tickers for better trade context:
NASDAQ:ASML → European semiconductor momentum
NASDAQ:NVDA → US chip leader, sentiment gauge
$SOX.X → Philadelphia Semiconductor Index, sector strength
NASDAQ:TSLA → Proxy for chip demand (AI + EV)
If NVDA and SOX are strong, TSM retest is likely to succeed. If they stall, be cautious.
📊 Trade Summary (Normal Format)
Confirmation: Retest at ATR line (momentum check)
Entry Plan: Layer buys at 288 / 292 / 296 / 300
Stop: 280 (adjust as needed)
Target: 330 resistance zone
Risk/Reward: Approx. 1:2.5+ depending on execution
💬 Side Note (For Thief OGs Only)
Not financial advice. We rob liquidity, not peace of mind. 😎
Trade it your way, manage risk, and protect your capital — that’s the real treasure.
✨ “If you find value in my analysis, a 👍 and 🚀 boost is much appreciated — it helps me share more setups with the community!”
⚠️ Disclaimer: This is a Thief-style trading strategy shared just for fun. Trade responsibly and DYOR before entry.
#TSM #Semiconductors #SwingTrading #DayTrading #TradingStrategy #StockMarket #BullishSetup #TradingView #ThiefTrader #LiquidityHunt #ATRstrategy #SmartMoneyConcepts #LayerEntry
S&P 500 Index Near Key Resistance – Correction Ahead?Recently, the S&P 500 ( SP:SPX ) has seen some sharp moves with high momentum due to the tariff tensions between the US and China over the past couple of weeks. These moves have also impacted other correlated markets like cryptocurrency .
In the past day, news came out that Trump is planning to meet the Chinese president on October 31st . With markets opening, the S&P 500 started to rise and is currently moving near a Resistance zone($6,734_$6,690) and close to its Resistance lines .
From an Elliott Wave perspective, it seems that the S&P 500 is completing a microwave 5 of the main wave C , and the corrective structure looks like an Regular Flat(ABC/3-3-5) .
I expect that in the coming hours, the S&P 500 index could drop at least to around $6,641(First Target) .
Second Target: $6,611
Stop Loss(SL): $6,735
Note: The $6,641 level is quite important in the context of the recent rally and could act as both support and resistance for the S&P 500.
A possible decline or fall in the S&P 500 index could also cause Bitcoin to decline (due to Bitcoin's high correlation with the S&P 500 index in recent weeks).
Please respect each other's ideas and express them politely if you agree or disagree.
S&P 500 Index Analyze (SPX500USD), 1-hour time frame.
Be sure to follow the updated ideas.
Do not forget to put a Stop loss for your positions (For every position you want to open).
Please follow your strategy and updates; this is just my Idea, and I will gladly see your ideas in this post.
Please do not forget the ✅' like '✅ button 🙏😊 & Share it with your friends; thanks, and Trade safe.

McDonald's stock monthly demand imbalance playing outMcDonald’s (MCD): Monthly Demand Level Still in Control
McDonald’s stock is currently respecting a monthly demand level at $294, which remains firmly in control. That’s a key point — the monthly timeframe is a much larger and more powerful structure than anything happening in the weekly or daily charts.
What I’m seeing now is a new bullish price action pattern forming in the smaller timeframes (weekly and daily), meaning buyers are stepping back in from that institutional zone. That gives me confirmation that demand is in control and that McDonald’s remains one of the strongest bullish stocks in the consumer sector.
A monthly demand level in control means that big money — institutions and funds — are accumulating. Retail traders might think it’s “too expensive” at $290+, but professional traders know that the presence of a monthly imbalance means there’s still room for price expansion to the upside.
This is where patience pays. The art of waiting for the price to return to that imbalance and observing how it reacts separates a disciplined trader from an impulsive one driven by greed or fear.

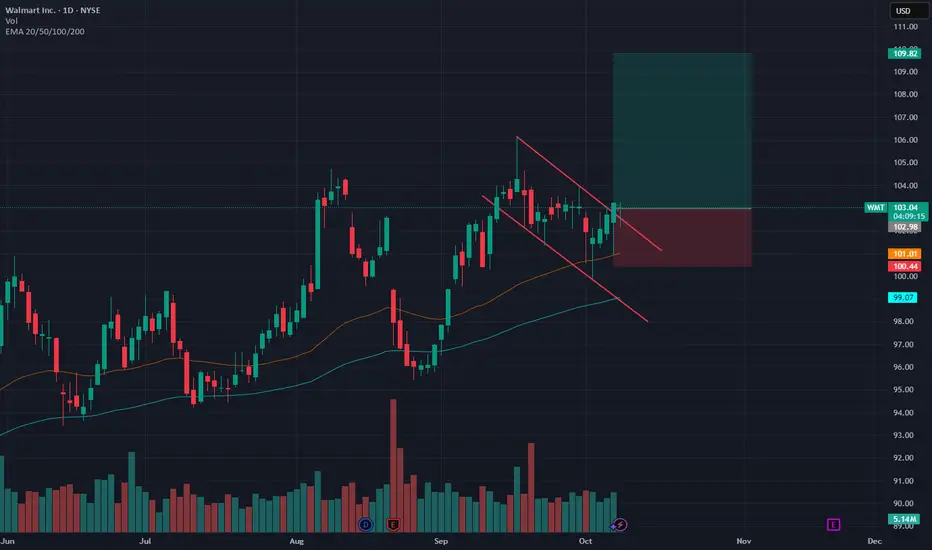
PERFECT WALMART LONGNYSE:WMT has shown strength recently, and is now showing signs of an imminent breakout from its consolidation. The previous HTF break of structure at 104.76 is telling of upside potential. Couple this with its bullish consolidation within a downward channel over the last 3-4 weeks, where price has recently strongly rejected a HTF 0.5fib retracement and the daily 50ema.
Above you can see the major Bollinger band constriction on the daily chart, indicating a very large move in price is getting ready to take place. With the confluence of all these technicals I am willing to say the move will be up. I am targeting a 1.618 fib extension which aligns exactly with a price of 110.
The 4hr timeframe above shows rejection of 50ema and an inside pin, all bullish.
Coupled with the 1hr timeframe below showing a break of structure to the upside with a clean rejection of both 50 and 100 ema. We can enter long on the LTF.
STOCKS Trading at 52 WEEK LOW - WatchlistHello Stonks Watchers 👀📈
Stocks that are hot on my watchlist right now for a possible buy , or a buy soon include:
1️⃣ Merck & Co. (MRK)
NYSE:MRK
Sector: Health Care
Last price: $81.51. 52-week low: $73.31.
% above 52-week low: 11.19%
Analysts are split: several bulls point to Keytruda pipeline upside and dividend support, but the consensus tilts toward “hold” as near-term risks (patent/biosimilar pressure) remain.
2️⃣ Costco Wholesale (COST)
NASDAQ:COST
Sector: Consumer Staples.
Last price: $943.26. 52-week low: $867.16.
% above 52-week low: 8.78%
Wall Street generally views Costco positively (membership model, resilient comps), with a consensus around “moderate buy” though some caution exists because the stock already trades at a premium.
3️⃣Saudi Aramco (2222.SR)
TADAWUL:2222
Sector: Energy
Last price: 24.95 (SAR). 52-week low: 23.13.
% above 52-week low: 7.87%
Market sentiment for Aramco is favorable for income investors because of its high, reliable dividend; investors watch oil fundamentals and geopolitics as the main swing factors.
4️⃣ONEOK, Inc. (OKE)
NYSE:OKE
Sector: Energy (midstream)
Last price: $71.55. 52-week low: $70.63.
% above 52-week low: 1.30%
Analysts and income-focused commentators highlight a strong dividend yield and attractive price targets, calling it a buy for yield/DFCF recovery in many writeups.
5️⃣The Trade Desk (TTD)
NASDAQ:TTD
Sector: Communication Services / Ad Tech
Last price: $52.03. 52-week low: $42.96
% above 52-week low: 21.11%
Long-term bulls point to programmatic ad recovery and profitable scaling, but consensus services show many firms at “hold” — sentiment is mixed while investors await sustained ad-spend improvement
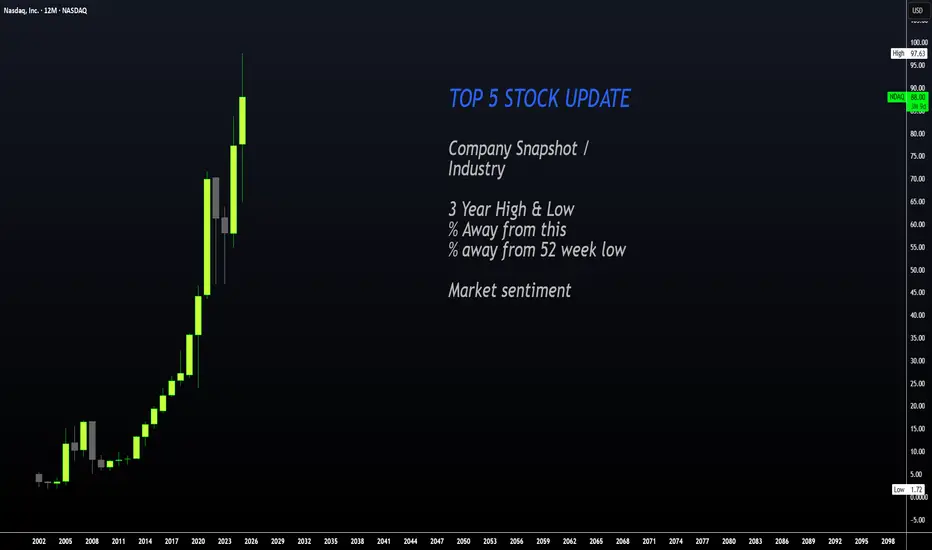
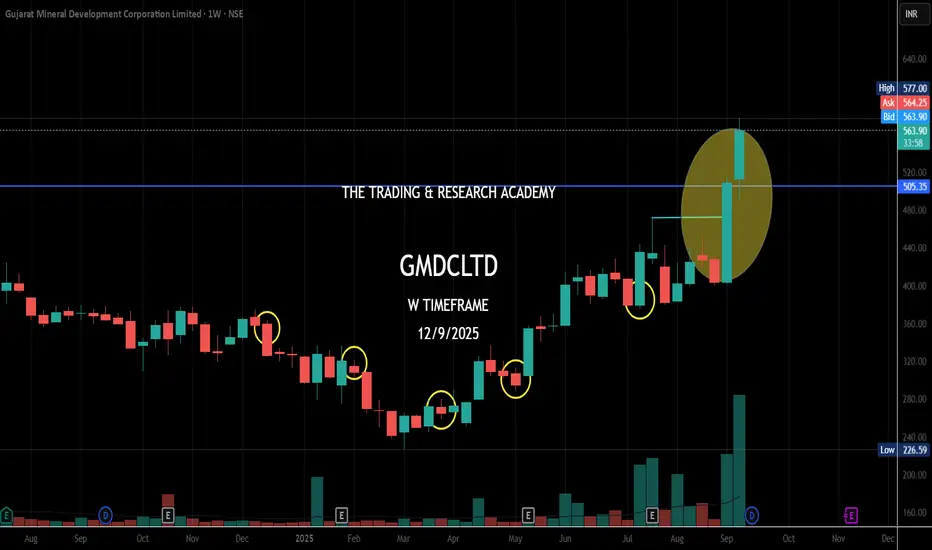
Chart Speaks- GMDCI have been sharing for a long time now about News v/s Chart analysis. I am a strong believer that any development about the company is visible on chart, be it positive or negative. This time its GMDC.
Read the News -
CENTRE PREPARING INCENTIVES TO ENCOURAGE DOMESTIC PRODUCTION OF RARE EARTH MAGNETS: KUMARASWAMY: MONEYCONTROL
Company was in the news since early this month on rare earth materials. Price action already hinting it since March, April, July & Aug 2025.
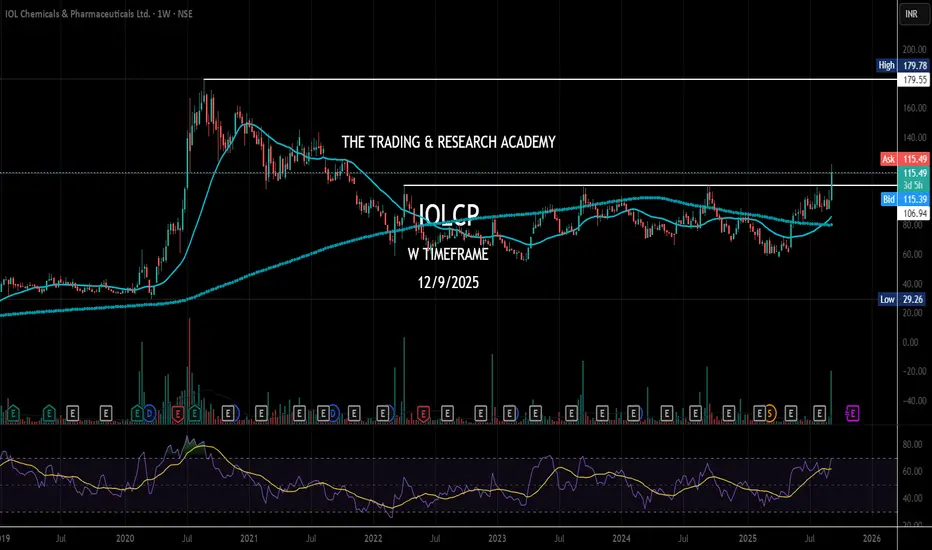
Stage Breakout - IOLCPStage Breakout - IOLCP
This counter had hit my SL in 2023 & 2024 B/o attempts. I am hopeful it would not disappoint me this time. B/o with volume seems it's getting ready.
Stage Breakout with interesting pattern. Let's see whether it reaches & crosses 180 level.
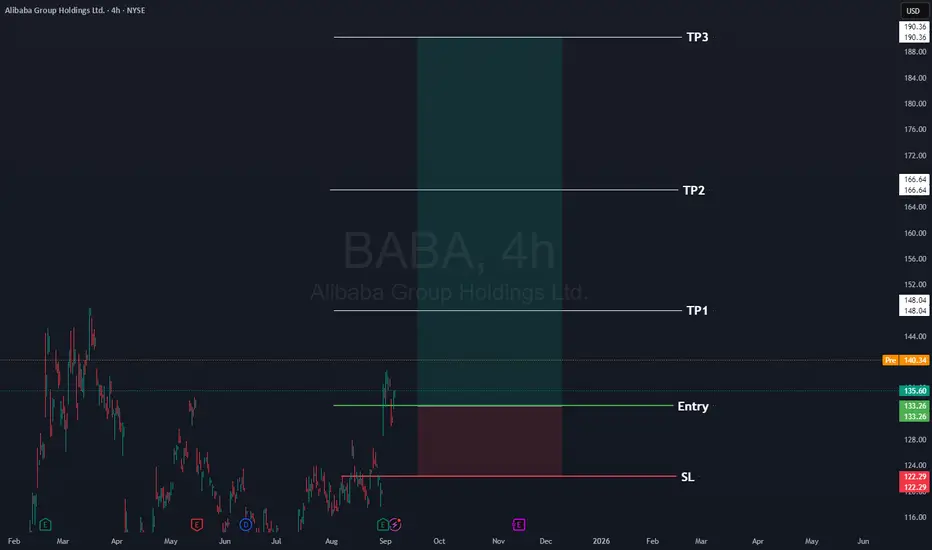
Alibaba Long $BABAHere's a free stock signal for you. Occasionally we like to give a free signal. This was posted to our subscribers
Stock: Alibaba
Stock Code NYSE:BABA
📈Entry: 133.26
⚠️SL: 122.29
✔️TP1: 148.04
✔️TP2: 166.64
✔️TP3: 190.36
Hope you earn lots of money
Sarah
CEO ETAforex
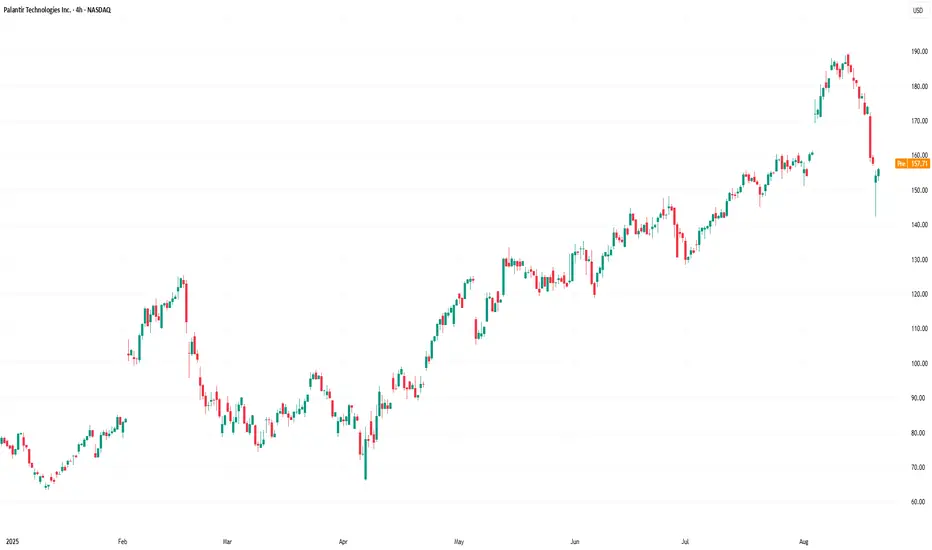
Palantir Technologies (PLTR) Shares Plunge Below $150Palantir Technologies (PLTR) Shares Plunge Below $150
Shares of Palantir Technologies (PLTR), a company specialising in big data analytics software, delivered an unpleasant surprise to investors:
→ just last week, the stock was trading at its all-time high of around $190;
→ yesterday, the price collapsed below $150. At yesterday’s intraday low, PLTR stock had dropped almost 25% from its record peak.
Why Did Palantir Technologies (PLTR) Stock Fall?
Bearish sentiment may have been driven by:
→ capital rotation from risk assets into so-called defensive stocks ahead of the Federal Reserve Chair’s speech at the Jackson Hole Symposium (as we reported yesterday);
→ growing speculation that a “bubble” is forming in the technology sector, which could burst.
According to Investor’s Business Daily, Andrew Left, founder of Citron Research, bet on downside in PLTR, arguing that the stock is severely overvalued following its phenomenal 340% rally in 2024.
Technical Analysis of Palantir Technologies (PLTR) Stock
In our previous analysis of PLTR’s price action, we:
→ identified an ascending channel (shown in blue);
→ suggested that the upcoming earnings release would push the stock towards the upper boundary of this blue channel.
Indeed, the strong earnings report on 5 August acted as a catalyst for the surge (breaking through resistance at $160, as indicated by the arrow) towards the channel’s upper boundary. However, the optimism stemming from these fundamentals was swiftly and completely erased – a highly significant bearish signal.
That said, the bulls still have valid reasons to remain hopeful, as the price:
→ staged a false bearish breakout below the key $145 level, which had previously acted as resistance (and has now flipped into support);
→ closed yesterday’s volatile session above its opening price (forming a dragonfly doji on the daily chart);
→ thus, the blue channel remains valid, with demand showing signs of aggression.
We can assume that the market has undergone a stress test and, after the volatility spike, the price has returned to the prevailing ascending channel, maintaining the uptrend. If so, the bulls will need to prove their resolve by overcoming key resistance levels at $160 and $170 (these mark not only the gap boundaries but also psychological barriers). If successful, PLTR’s price could advance towards the channel’s median line.
This article represents the opinion of the Companies operating under the FXOpen brand only. It is not to be construed as an offer, solicitation, or recommendation with respect to products and services provided by the Companies operating under the FXOpen brand, nor is it to be considered financial advice.
How Ride the AI Wave in 2025 | Top AI Stocks The AI boom is still making waves on Wall Street
Over the past 15 months, investors have injected more than $ 5 billion into tech sector funds. This surge was fueled by three consecutive interest rate cuts by the Federal Reserve in 2024, coupled with Donald Trump's presidential victory, which led investors to pour over $140 billion into the stock market, hoping tax reforms would boost corporate profits. A significant portion of this activity has been driven by the growing interest in artificial intelligence, with AI driven companies leading a remarkable 25% rally in the S&P 500 this year. Nvidia (NVDA), a key player in the AI sector, has soared 149% in the past year, while major tech firms like Microsoft (MSFT) and its collaboration with OpenAI, and Google’s (GOOG) Gemini project, have also contributed to the rise in stock prices.
The AI market is expected to expand from approximately $540 billion last year to over $1.8 trillion by 2030, with a projected compound annual growth rate (CAGR) of 20% through 2032. In the final weeks of his presidency, Joe Biden's administration introduced new regulations to block the export of US-made semiconductors to adversarial nations, including Russia and China. This move is part of the ongoing AI arms race, with the US aiming to maintain its lead in manufacturing the chips essential for powering AI technology.
AI Stocks: The Only ‘Bubble’ You Want to Be In
North America held the largest share of the global AI market in 2023, accounting for nearly 37%. Europe, Asia Pacific (APAC), and Latin America followed with shares of 25.5%, 24%, and 13.6%, respectively.
Whoever controls AI holds the power and the same is true in the corporate world. AI related stocks, such as Palantir Technologies (PLTR) and Nvidia, delivered triple digit returns and led the market in 2024. Growing investor interest has also made it easier to trade AI focused exchange-traded funds (ETFs), which offer exposure to broader industry themes rather than individual companies. However, performance can vary.
For instance, the Defiance Quantum ETF (QTUM) and the Invesco Semiconductors ETF (PSI) have shown comparable results since 2020, consistently outperforming the broader market.
Meanwhile, the iShares Future AI & Tech ETF (ARTY) has underperformed compared to the S&P 500. So, how can you identify the top AI stocks when certain ETFs are lagging? This is where the Quant Rating System comes in. Quant Ratings combine proprietary computer processing technology with "quantamental" analysis, allowing you to filter out the noise and focus on AI stocks with strong fundamentals that are expected to grow earnings at an above average rate.
Leading AI Companies Worldwide
Major tech giants like Amazon (AMZN), Google, Apple (AAPL), Meta (META), Microsoft (MSFT), and IBM (IBM) have invested billions into AI research to secure a dominant position in this highly profitable space. Whether it's backing high-potential startups like MSFT’s $11 billion stake in OpenAI, or supplying crucial AI hardware such as Nvidia's (NVDA) graphic processing units (GPUs), these companies are striving to stay ahead of competitors.
While generative AI tools like ChatGPT are undeniably shaping the global economy, the potential for significant returns from AI stocks is more nuanced. For instance, Palantir Technologies (PLTR) has dropped over 20% from its all-time high in December, receiving a "hold" rating from Seeking Alpha's Quant system and analysts across Wall Street as of January 9, 2025. Even Nvidia, despite a strong performance in 2024, has seen its stock show signs of stagnation. Other AI stocks are showing signs of potential overvaluation. For example, SoundHound AI (SOUN) recently dropped more than 16%, with analysts highlighting concerns over its unsustainable valuation given its weak fundamentals.
2025 Top AI Stocks
The hype in Silicon Valley can make it challenging to distinguish between AI stocks with long-term potential and those that are overhyped
Our data driven Quant system uses advanced computer processing and proprietary algorithms to analyze thousands of stocks in real time across a range of metrics like value, growth, profitability, EPS revisions, and momentum. To find the top performing AI stocks, I analyzed securities from three leading AI focused ETFs Global X Robotics & Artificial Intelligence ETF (BOTZ), Robo Global Robotics and Automation Index ETF (ROBO), and Global X Artificial Intelligence & Technology ETF (AIQ). From this analysis, I selected six top-performing stocks—three largecap and three small-to-medium-cap (SMID)—which represent the diverse opportunities in the AI space. These stocks, both from tech companies providing AI solutions and non-tech firms utilizing AI to enhance productivity, boast an average levered free cash flow margin of about 18.6% and have returned an average of 60% more than the past 12 months.
1. Twilio Inc
Market Capitalization $16.6B
Twilio, a cloud communications company, has returned nearly 51% over the past year and ranks second in the Top Internet Services and Infrastructure sector, just behind Kingsoft Cloud Holdings. The company’s growth has been driven by stronger revenues, reduced losses, increased cash flow, and the completion of a high-profile ETF investor Cathie Wood’s stake sale. Twilio’s strong Q3’24 earnings suggest it’s well-positioned to capitalize on the growing AI trend well into 2025, with its stock more than doubling since May.
Like many cloud computing companies, Twilio, based in San Francisco, gained prominence during the COVID-19 pandemic but initially struggled with high expenses and slow revenue growth. However, the surge in demand for generative AI, particularly through Twilio's CustomerAI platform which leverages large language models (LLMs) and natural language processing (NLP) to analyze customer data has played a key role in its remarkable recovery.
TWLO Revisions, Momentum, and Valuation
Over the past 90 days, Twilio has seen a remarkable 23 upward revisions to its earnings per share (EPS) and 27 revisions to its revenue projections from analysts, signaling a strong financial rebound. This turnaround is reflected in its ‘A’ Momentum Score, with six-month and nine-month price performances of 93.5% and 81.3%, respectively—both figures vastly outperforming the sector medians by over 1000%. As a result, Twilio has nearly doubled the performance of the S&P 500 in recent months.
Twilio also demonstrates solid growth prospects, with a forward EBITDA growth rate of 50.6% (783% higher than the sector median), year-over-year operating cash flow growth of 520.8% (3,348.45% above the sector median), and an impressive levered free cash flow margin of 107% (603% above the sector median). However, its average forward price-to-earnings (P/E) ratio of 30x indicates that Twilio trades at a premium compared to its peers, nearly 20% higher than the sector median.
2. Celestica Inc
Market Capitalization $12B
Celestica has seen a remarkable 255% increase in its stock price over the past year, driven by its strategic pivot toward AI infrastructure manufacturing. The company has carved out a niche in producing networking switches for data centers, and its Connectivity & Cloud Solutions segment, which makes up 67% of total revenue, has grown 42% year-over-year as tech companies invest more in AI-powered data centers. Its Q3 '24 results highlighted a 22% increase in revenue to $2.5 billion and record adjusted EPS of $1.04.
CLS Valuation, Momentum, and Growth
Celestica stands out for its attractive valuation, even with impressive returns in 2024. With a forward price-to-earnings growth (PEG) ratio of 0.87, the stock appears undervalued compared to its peers. It boasts an ‘A+’ Momentum Grade, having received six upward EPS revisions and eight revenue revisions from analysts in the past 90 days. Its Growth Grade has improved significantly, rising from ‘C+’ to ‘B+’ due to forward EPS growth of 49% and year-over-year diluted EPS growth of 88%, both significantly outperforming the sector median.
3. DocuSign
Market Capitalization $18.3B
DocuSign, known for its electronic signature services, has embraced AI in innovative ways, particularly by adding new AI features to streamline contract agreement processes. These AI-driven tools have helped the company’s stock surge more than 21% following its impressive Q3 '24 earnings, and the growth trajectory is expected to continue in 2025 as DocuSign expands into new markets, both domestically and in Europe. As SA Analyst Noah’s Arc Capital Management notes, DocuSign's AI features have proven invaluable for businesses, simplifying the often complex task of reviewing and managing contracts.
DOCU Growth, Valuation, and Profitability
DocuSign has demonstrated exceptional growth, including an ‘A+’ EBIT growth rate of 239.21% (10,710% above the sector median) and year-over-year diluted EPS growth of 1,852.2% (24,971% higher than its peers). While its overall ‘C+’ Growth Score is somewhat tempered by a low forward return on equity growth forecast of -29.58%, the company’s valuation looks compelling. Its trailing and forward P/E GAAP ratios of 18.6 and 17.9 are 38.6% and 41.5% lower than the sector medians, suggesting that DocuSign's shares are undervalued. Furthermore, its ‘A+’-Rated PEG ratio of 0.01, a 99% difference from the sector median, points to a strong value proposition for investors.
4. FARO Technologies
Market Capitalization $478.2M
FARO Technologies, based in Lake Mary, Florida, specializes in 3D measurement technology and has leveraged AI to establish itself as a leader in "smart factories" and "intelligent automation." Its scanning technology has been instrumental in improving productivity and accelerating production timelines. The company has seen nearly 54% growth over the past six months, benefiting from the expanding global 3D scanning market, projected to grow to $11.85 billion by 2032 at a compound annual growth rate (CAGR) of 13.11%.
In Q3, FARO reported $0.21 of nonGAAP EPS, marking its sixth consecutive quarter of exceeding expectations. This success is part of the company’s strategic plan, which includes the launch of a new line of laser scanners.
FARO Growth and Valuation
FARO's growth metrics stand out, with forward EBIT growth of 112.48%, 1,410.71% higher than the sector median, and an astonishing year-over-year levered free cash flow growth of 24,214.19%, 164,037% above the sector median. The company's forward EBITDA growth of 42.76%, 639.9% higher than the sector median, indicates robust growth ahead.
FARO's stock is undervalued according to its metrics. It has an EV/sales ratio of 1.41, 59% lower than the sector median, and a price-to-book ratio of 1.9, 45% below the sector median, making it an attractive investment at its current valuation.
5. Proto Labs
Market Capitalization $897 M
Proto Labs, a Minnesota-based company, specializes in on-demand manufacturing solutions, enabling businesses to avoid the costs associated with stocking large quantities of products. Despite a recent dip of around 16% in share price, Proto Labs remains a promising investment due to its strong profitability and its impressive cash flow of $24.8 million in Q3 2024, the highest since its 2020 acquisition of 3D printing company 3D Hubs.
Proto Labs has also seen five upward revisions to its EPS and five to its revenue over the last 90 days, signaling stronger-than-expected growth prospects. The company is positioned to benefit from the strong sector tailwinds of the global print-on-demand market, which was valued at $6.18 billion in 2022 and is expected to grow at a CAGR of 25.8% through 2030.
PRLB Valuation
Proto Labs boasts an impressive long-term growth rate of 25%, 119% higher than the sector's 11.4%, and a year-over-year capital expenditure (capex) growth of 74.4%, significantly outpacing the sector's 4.3%. This suggests that Proto Labs is reinvesting a large portion of its cash back into its operations to fuel future growth.
The stock is fairly valued with a forward PEG ratio of 0.06, indicating that it is significantly undervalued compared to its peers, at a 49.3% discount from the sector. Its price-to-book ratio of 1.36 is also an attractive metric, 52.83% lower than the sector median. However, its ‘D’-rated forward and trailing P/E ratios of 39.9 and 48.8, respectively, reflect its recent price decline, leading to an overall Valuation Grade of ‘C’.
6. Freshworks
Market Capitalization $4.9 B
Freshworks, a cloud based SaaS company founded in India, is a strong candidate for a "buy the dip" opportunity. After a rough 2024, shares in Freshworks have begun to rebound, thanks to increasing demand for its AI-enabled software solutions. The company serves over 68,000 customers, including global brands like American Express, Shopify, and Airbus. Its Q3’24 financial results were filled with positive indicators:
- 22% YoY revenue growth to $186.6M
- 21% YoY increase in free cash flow
- Raised full year guidance
- Announced a $400M buyback plan
- Maintains a debtfree balance sheet with strong liquidity
Freshworks also announced a 13% reduction in headcount, which is expected to improve margins further, in addition to the impact of its share repurchase program. The company is poised to benefit from the booming AI SaaS market, which is projected to grow at a CAGR of over 30% by 2031.
FRSH Growth, Valuation, and Momentum
Freshworks boasts an impressive A-’ Growth Score, underpinned by its solid revenue growth and forward revenue expansion of 17.8%, a 221.8% difference from the sector median. The company also has a 3-5 year long-term CAGR of 27.5%, significantly outpacing the sector by 824.2%. Its year-over-year capital expenditure growth stands at 83.3%, signaling reinvestment in future growth.
In terms of valuation, Freshworks has a forward PEG of 1.51, suggesting that the stock is available at a slight discount to its peers. Similar to Proto Labs, its higher-than-average P/E ratios are likely due to its recent dip of around 9.3% over the past month. One of the standout features of Freshworks’ stock is its ‘A’ Revisions Score, which reflects 17 EPS upward revisions and 16 revenue upward revisions in the past three months.
As the AI frenzy continues to dominate Wall Street, some of the valuations of major AI driven companies may be edging into overinflated territory. However,so far my Quant System highlights six ‘Strong Buy’ stocks that still exhibit strong fundamentals. These companies have, on average, risen about 60% over the past year, showcasing strong bullish momentum and solid valuations. For investors looking to integrate AI into their portfolios without succumbing to the hype, these stocks present a promising opportunity
Which AI stock are you loading and why?

Why Most Traders Missed This Starbucks Swing Trade (SBUX)Most traders miss the forest for the trees. They spend their entire day glued to intraday charts, scalping for a few cents, and they completely ignore the bigger picture. But here’s the truth: the biggest moves, the cleanest swing trades, come from the higher timeframes — monthly and weekly charts. Today, I will break down why that matters, and we’ll use Starbucks stock, ticker SBUX, as a perfect example.
The Importance of Bigger Timeframes
When you zoom out to the monthly timeframe, you’re looking at where the real money plays — hedge funds, institutions, the smart money. These guys aren’t trading 5-minute charts. They’re building positions in massive supply and demand imbalances.
If you ignore those levels, you’re basically trading blind. It’s like trying to surf without paying attention to the tide. You might catch a wave or two, but eventually, the tide will wipe you out.”
Starbucks Monthly Demand at $79.68
Let’s look at Starbucks. Right now, we’ve got a strong monthly demand imbalance of around $79.68. Price dropped into that zone, and what happens next? Buyers step in, and bullish candlesticks start forming.
This isn’t magic. This is pure supply and demand. At that price, Starbucks became too cheap for the big players to ignore. They’re scooping it up, and as a result, smaller timeframes start printing bullish price action. The monthly demand fuels the fire.
There is room to reach the tested monthly supply at $110.

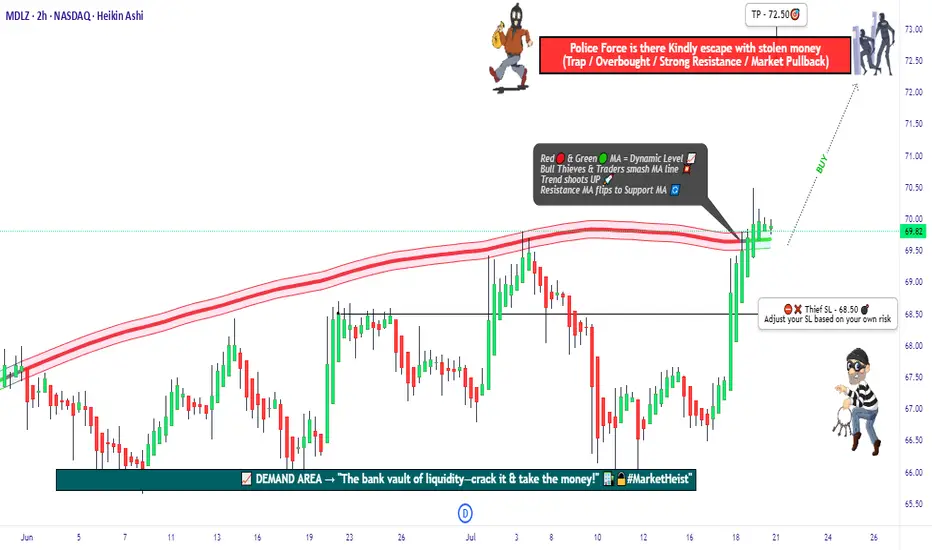
"MDLZ Heist LIVE! Quick Profit Grab Before Reversal!"🚨 MONDELEZ HEIST ALERT: Bullish Loot Zone! (Swing/Day Trade Plan) 🚨
Thief Trading Strategy | High-Risk, High-Reward Play
🌟 Greetings, Market Pirates! 🌟
Hola! Oi! Bonjour! Hallo! Marhaba!
To all Money Makers & Strategic Robbers 🤑💸—this is your blueprint to plunder "MONDELEZ INTERNATIONAL, INC" with precision.
🔎 THIEF TRADING ANALYSIS (Technical + Fundamental)
The Vault is Open! Bullish momentum detected, but caution—this is a high-risk police barricade zone (resistance level).
Overbought? Consolidation? Reversal? Yes. Bears lurk here, but we’re stealing profits before the trap snaps.
🎯 Target: 72.50 (or escape earlier if momentum fades).
🚨 Scalpers: Long-only! Use trailing stops to protect gains.
📈 ENTRY: How to Swipe the Loot
"Buy the Dip" Strategy: Optimal entries on pullbacks (15m/30m timeframe).
DCA/Layering Tactics: Spread limit orders for better risk control.
Aggressive Robbers: Enter now. Patient Thieves: Wait for retests.
🛑 STOP LOSS: Survival Rules
SL at 68.50 (nearest swing low wick on 2H chart).
Adjust based on risk/lot size—protect your capital!
⚡ CRITICAL ALERTS
📰 News Volatility: Avoid new trades during major releases. Lock profits with trailing stops!
📊 Fundamental Drivers: Check COT reports, macro trends, and sector sentiment Klick the 🔗.
⚠️ Reminder: This is NOT financial advice. DYOR and manage risk!
💥 BOOST THE HEIST!
Like 👍 + Boost 🔄 to fuel our next market robbery plan. Together, we trade smarter, steal bigger, and profit faster!
🚀 Stay tuned—more heists coming soon! 🤑🔥
Is it right time and choice to buy UNH Stock - {15/07/2025}Educational Analysis says that UNH Stock (USA) may give trend Trading opportunities from this range, according to my technical analysis.
Broker - NA
So, my analysis is based on a top-down approach from weekly to trend range to internal trend range.
So my analysis comprises of two structures: 1) Break of structure on weekly range and 2) Trading Range to fill the remaining fair value gap
Let's see what this Stock brings to the table for us in the future.
Please check the comment section to see how this turned out.
DISCLAIMER:-
This is not an entry signal. THIS IS FOR EDUCATIONAL PURPOSES ONLY.
I HAVE NO CONCERNS WITH YOUR PROFIT OR LOSS,
Happy Trading.

AAPL can we hit 260?
Appears we are making a correction down to the levels of 208 then if that does not hold 205 with a possible drive up to the 260.
Question is are we going drive deeper with the correction ?
Be Careful folks this is a wild one
Trade Smarter Live Better
Kris/Mindbloome Exchange

NVIDIA(NVDA) Jackpot – Thief Trading Blueprint for Fast Profits!🚀 NVDA Stock Heist: The Ultimate AI Gold Rush (Scalping/Day Trade Plan)
🌟 Hey there, Market Pirates! 🏴☠️💰
Thieves, Traders, and Money Makers—gather around! Based on the 🔥Thief Trading Style🔥, here’s our master blueprint to loot NVIDIA’s AI-fueled rally. Follow the strategy on the chart—long entry is LIVE! Our escape? Near the high-risk Resistance Zone. Overbought? Consolidation? Reversal trap? Bears are lurking, but we’re stealing profits first! 🎯💸
🎯 Entry (The Vault is Open!)
"Swipe the AI gold at any price—the heist is ON!"
Pro Tip: Use buy limits within 15-30min near swing lows/highs for pullback entries.
🛑 Stop Loss (Thief’s Escape Route)
SL at recent swing low (4H timeframe)—adjust based on your risk & lot size.
Scalpers/Day Traders: Tighten SL if stacking multiple orders.
🏆 Target 🎯: 165.00 (The AI Jackpot!)
📈 Why NVDA?
Bullish momentum from AI dominance, earnings hype, and institutional FOMO.
Tech sector strength + chip demand = THIEF’S PARADISE.
📰 Fundamental Heist Intel
Need macro trends, sentiment, and intermarket analysis? 🔗 Check our bioo for the full robbery toolkit.
⚠️ Trading Alert: News & Position Control
Avoid new trades during earnings/news—volatility kills heists!
Trailing SLs = Locked profits. Don’t get greedy!
💥 Boost This Heist!
👊 Hit "Like" & "Boost" to fuel our next raid. Every click = More stolen profits! 🚀💰
🤑 Stay tuned—more heists coming! NVIDIA today… what’s next? 🤫🐱👤

AMGN : Long with Good RR We are above the 200-period moving average on the 1-hour chart.
And the trend line has been broken.
There is a good risk - reward ratio. Approximately : 2.48
Small position sizes can be tried.
Entry : 287.38 (Now)
Stop - Loss : 276.28
Take Profit Level : 315.0
Regards.

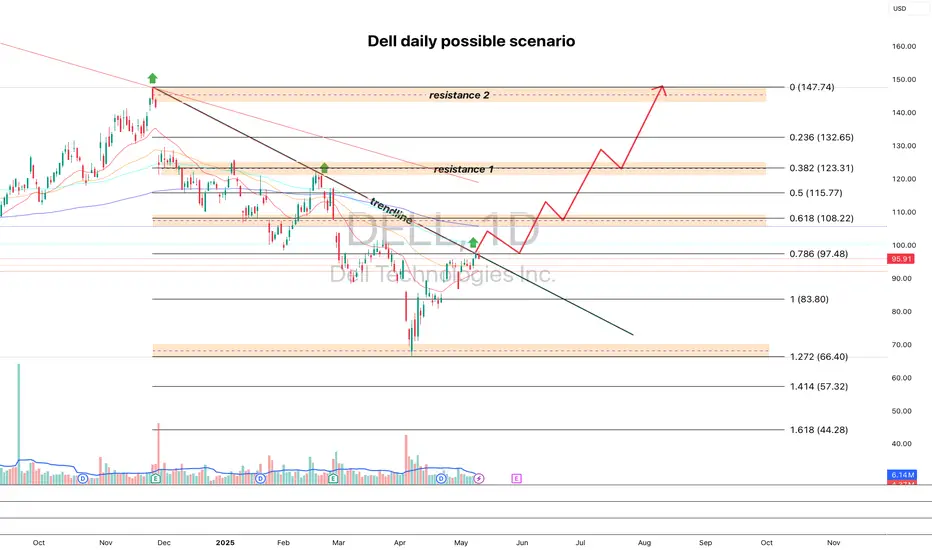
DELL looks good for pump dailyI'm watching DELL for a breakout of the trendline and a cross above the 100 MA — targeting a move toward 108.22, followed by a retest of the breakout and further upside targets at 123.31 and 147.74.
Fundamentally, the company looks strong, and the next earnings report is expected on May 29.
If you like the analysis, hit that rocket 🚀