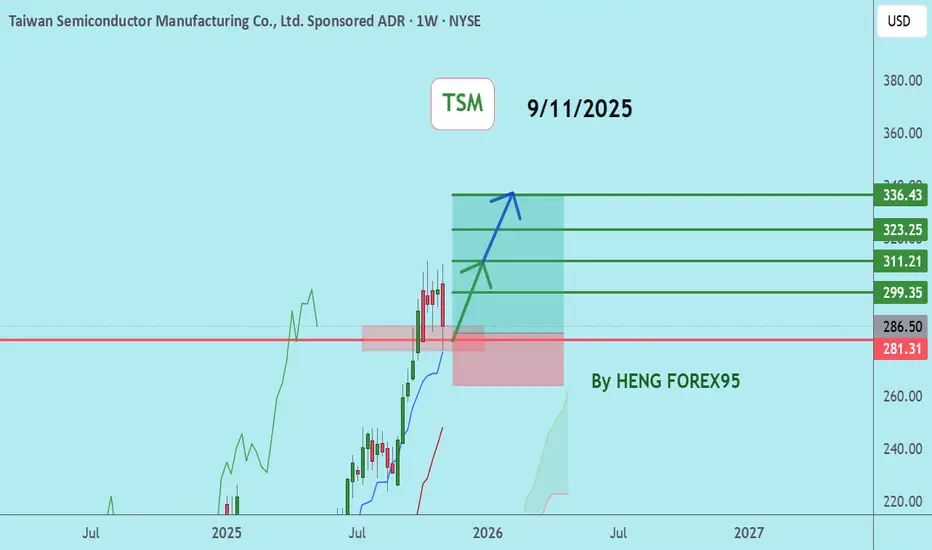
TSMTaiwan Semiconductor Manufacturing Company Limited (TSM) pioneered the pure-play foundry business model and has consistently emerged as a global leader in specialty semiconductor foundries.
The overall trend remains bullish, but the price is currently undergoing a short-term correction. The price is currently in the key support zone of 283-274. If the price can hold above 274, a rebound is likely.
🔥Trading futures, forex, CFDs and stocks carries a risk of loss.
Please consider carefully whether such trading is suitable for you.
This content is not financial advice. Always conduct your own financial due diligence.
>>GooD Luck 😊
❤️ Like and subscribe to never miss a new idea!
Stocktrading
S&P 500 Breakdown Alert — Rising Wedge Reversal in Play!Today I want to share an S&P 500 index( SP:SPX ) analysis, as this index plays a major role in guiding correlated markets—especially crypto, and particularly Bitcoin( BINANCE:BTCUSDT ).
The S&P 500 index entered the Potential Reversal Zone(PRZ) and resistance zone($6,902_$6,875), where it began to fall.
The S&P 500 index also failed to form new Higher Highs(HH) and Higher Lows(HL), which signals weakening bullish momentum over the past 7 trading sessions.
From a classical technical-analysis perspective, it appears that the S&P 500 index has broken below the lower line of its rising wedge pattern, which is considered a bearish reversal pattern. The index is currently in the process of completing a pullback/retest of the broken structure.
My expectation is that the S&P 500 index may decline at least toward $6,823, and if important support lines break, we could see a deeper correction toward the measured move (target) of the rising-wedge pattern.
What’s your outlook on the S&P 500 index and the U.S. stock market?
First Target: $6,823
Second Target: $6,803
Stop Los(SL): $6,889(Worst)
------------------------------------------------
We should also keep in mind that several important US economic indicators will be released this week, which could significantly impact market direction. So be extra cautious with your positions, especially during data releases:
JOLTS Job Openings➡️09 December
Federal Funds Rate➡️10 December
FOMC Statement➡️10 December
FOMC Press Conference➡️10 December
Unemployment Claims➡️11 December
------------------------------------------------
💡 Please respect each other's opinions and express agreement or disagreement politely.
📌S&P 500 Index Analyze (SPX500USD), 1-hour time frame.
🛑 Always set a Stop Loss(SL) for every position you open.
✅ This is just my idea; I’d love to see your thoughts too!
🔥 If you find it helpful, please BOOST this post and share it with your friends.

SLDE: buyers step in earlySlide Insurance (SLDE) remains attractive due to steady revenue growth in the digital-insurance segment, rising customer volume, and expansion of partnership channels. Recent reports show improving margins, and the stock has already recovered from the sharp summer drop. The sector itself is defensive, which keeps capital flowing even during periods of volatility.
Technically, the price continues to hold the ascending channel, repeatedly confirming demand around 15-15.3. A breakout of the local trendline with confirmation formed the basis for a new upward structure. EMA 20/50 act as dynamic support, and the pullback into the 0.618 Fibonacci level matches the accumulation zone. A breakout above 16.8-17.0 would confirm the next bullish leg toward the first target at 19.8. The second target sits near 22.3 where major supply is located.
Trading plan: long entries remain valid while price holds above the 15-16 support area and reclaims 16.8. Wave structure supports the beginning of a new bullish impulse. As long as the channel remains intact, buyers keep the advantage.

$CEP – High RiskCEP is showing early signs of a potential medium-term reversal after an extended downtrend. Price has created a reaction around a key area of interest, and if momentum continues, we may be at the beginning of a meaningful bullish leg.
🔍 Setup Overview
I’m looking at a long swing position based on the 4H structure, liquidity behavior, and confluence with the current order-flow shift.
Entry Zone
Current structure is forming a higher low after a liquidity sweep.
Entry CMP.
Targets (TP Levels)
TP1: ~ $34
TP2: ~ $42
TP3: ~ $75
Stop Loss
Tight SL below recent low (~$12.76), keeping the risk contained while aiming for a high R:R setup.
⚖️ Risk-to-Reward
The setup shows a potential ~1:35R:R if price reaches TP3, making this a speculative but high-potential swing idea.
📌 Notes
CEP is still in a broader bearish context, so this idea depends on confirmation of continued bullish structure.
Patience is key; I’ll be monitoring volume and reaction at each TP zone.

$WBD - Trying to capitalyze on the bidding warNetflix and Paramount Skydance are going crazy about NASDAQ:WBD . Let´s try to get something out of here. VERY RISKY !! Potential downside is real.
Entry : CMP
SL : $23.25
TP : $85.55

$BNKK: The “Please Don’t Rug Me” Setup of the MonthAlright traders, buckle up — BNKK is officially in that zone where hope and risk shake hands and say “let’s see what happens.”
Here’s the breakdown before we jump into the comedy:
📌 Entry: ~0.2172
🎯 Take Profit (TP): ~0.3392
🛑 Stop Loss (SL): ~0.1617
Yes… a glorious +56% upside with a stop that reminds me exactly why my cortisol levels stay elevated.
We’ve got all the ingredients of a premium TradingView masterpiece:
📉 Liquidity zones begging to be raided
📈 A trend that may or may not be trying to resurrect itself
🧠 And of course, enough lines to make a geometry teacher proud
Will BNKK bless this setup and send us straight to TP?
Or will it politely escort us to SL like a bouncer removing us from the club?
Only the market maker knows… and he’s laughing.
Regardless — the structure looks clean, the narrative is spicy, and the hopium is premium quality.
Good luck, traders. And if this goes to SL, we simply say:
“It was part of the backtest.” 😎
⚠️ Financial Disclaimer:
Not financial advice. I’m not your financial advisor, therapist, barista, or risk manager.
Trading involves risk — including losing money, sanity, and sometimes respect from your family.
Always DYOR and never trade based solely on memes or internet comedy.

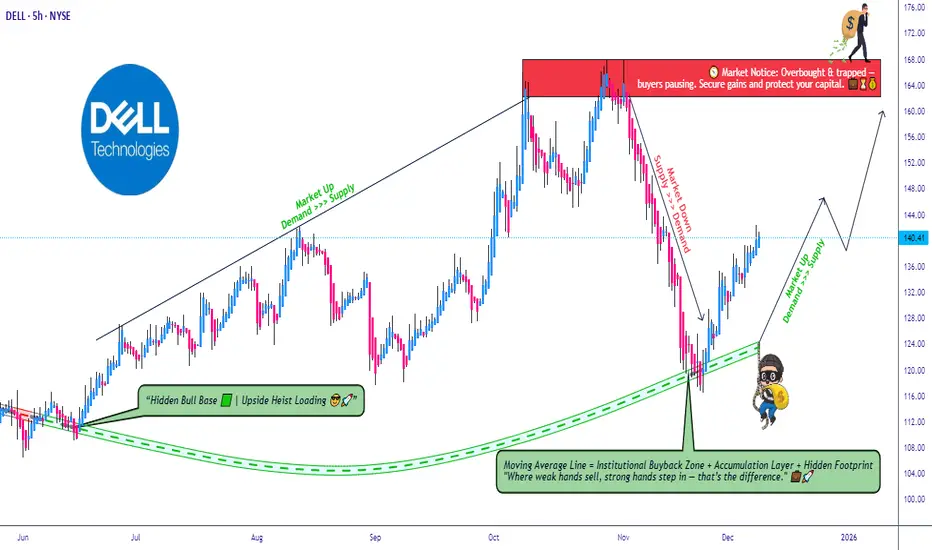
DELL Price Action ⁞ Bullish TMA Structure Offering Clean Entries🎯 DELL Technologies: The "Gentleman Thief" Swing Trade Setup 💼🔓
📊 Market Overview
💰 DELL Technologies Inc. (NYSE: DELL)
Current Price: $138.91
📈52-Week Range: $66.25 - $168.08
Market Cap: $93.10B
Analyst Rating: Strong Buy (18 analysts recommend buying)
Average Price Target: $163.30
🎭 The "Gentleman Thief" Trade Plan
Welcome to the most sophisticated heist in tech stocks! 🎩💼 We're going after DELL with the precision of a master strategist and the charm of a smooth operator. This isn't just a trade—it's an art form.
📐 Technical Setup: Triangular Moving Average Pullback ✅
The bulls have confirmed their presence! 🐂 DELL is showing a classic triangular moving average pullback pattern, which historically signals strong upward momentum continuation. We're looking at a textbook setup where price consolidation meets buyer accumulation.
Key Technical Indicators:
✅ Bullish trend confirmation
✅ TMA crossover bullish
✅ Volume accumulation zone active
✅ Support level respected at $135-$138 zone
💼 The "Layering Strategy" Entry Method
This is where we separate the amateurs from the professionals! 🎯 Instead of going all-in at one price (rookie mistake!), we're deploying a multi-layer limit order strategy—think of it as spreading your net wide to catch the best fish.
🎯 Entry Zones (Pick Your Poison):
🥷 Option 1: The Aggressive Thief Approach
Layer 1: $120.00 (Deep value zone - if we get lucky) 💎
Layer 2: $125.00 (Sweet accumulation level) 🍬
Layer 3: $130.00 (Support retest zone) 🛡️
Layer 4: $135.00 (Current structure support) 📊
🎩 Option 2: The Current Price Entry
Jump in at any price between $138-$141 if you believe the momentum is too strong to wait! Sometimes the train leaves the station and you gotta hop on! 🚂
Pro Tip: Scale into your position! Don't blow your entire load at once. Add 25% of your position at each layer, or customize based on your risk appetite and account size.
🛑 Stop Loss: The Emergency Exit
Thief Stop Loss @ $115.00 🚨
⚠️ IMPORTANT DISCLAIMER: Listen up, Thief OG's! 👂 This is MY stop loss based on MY risk tolerance. You're the captain of your own ship! 🚢 Set your stop loss based on YOUR own risk management rules. Maybe you're more conservative (SL @ $125), or maybe you're riding or dying (SL @ $110). Your money, your rules! Just don't be reckless—protect your capital like it's the crown jewels! 👑
Risk Management Math:
Entry Range: $120-$135
Stop Loss: $115
Max Risk per Layer: $5-$20/share depending on entry
Always risk only 1-2% of your total capital per trade!
🎯 Take Profit Target: The Grand Escape
Police Station Alert @ $165.00 🚔🚨
Alright, here's the deal—the "police force" (resistance level) is waiting for us at $165! This is where:
🔴 Strong resistance zone meets overbought conditions
📊 Historical rejection level (check the chart!)
💰 Profit-taking zone where smart money exits
⚠️ Trap territory where FOMO buyers get caught
Exit Strategy Options:
The Clean Exit: Sell 100% at $165 and walk away clean 🎩
The Scaling Exit: Take 50% off at $155, 30% at $165, let 20% ride with trailing stop
The Greedy Approach: Move stop to breakeven at $155, let it run to $170+ (risky!)
⚠️ ANOTHER DISCLAIMER: This is MY target, not a crystal ball prediction! 🔮 You might want to take profits earlier ($150, $155, $160) or hold longer. The market doesn't care about our plans—it does what it wants! Be flexible, be smart, and take money when you MAKE money! 💵
📊 Related Pairs to Watch (Correlation Analysis)
Smart traders don't trade in a vacuum! 🧠 Here are the key tickers that move with or against DELL:
💻 Direct Competitors & Sector Plays:
NYSE:HPE (Hewlett Packard Enterprise) - Direct infrastructure competitor, 85% correlation 🔄
NYSE:HPQ (HP Inc.) - PC market competitor, 70% correlation
NASDAQ:SMCI (Super Micro Computer) - AI server play, 80% correlation 🤖
NASDAQ:NTAP (NetApp) - Storage solutions, 75% correlation
🔥 AI Infrastructure Ecosystem:
NASDAQ:NVDA (NVIDIA) - GPU supplier, 65% correlation—when NVDA pumps, DELL follows! 🚀
NASDAQ:AVGO (Broadcom) - Networking chips, 60% correlation
NASDAQ:CSCO (Cisco Systems) - Networking infrastructure, 70% correlation
📈 Market Sentiment Indicators:
NASDAQ:QQQ (Nasdaq ETF) - Tech sector health, 75% correlation
AMEX:XLK (Technology Sector SPDR) - Broader tech sentiment, 80% correlation
NASDAQ:SOXX (Semiconductor ETF) - Chip sector strength indicator
Key Insight: If NASDAQ:NVDA is rallying on AI demand and NASDAQ:QQQ is showing strength, DELL typically follows with a 1-2 day lag. Use these for confirmation! ✅
🧠 Why This Trade Makes Sense (Fundamental Backup)
Don't just trade the chart—understand the story! 📖
🤖 AI Infrastructure Boom: DELL's AI server backlog hit a record $18.4 billion Morningstar, signaling massive enterprise demand
💰 Strong Financials: Revenue growth of 11% year-over-year, with non-GAAP diluted EPS up 17% Morningstar
🎯 Analyst Confidence: Average 12-month price target of $163.30, with high estimate at $200 Investing.com
📊 Technical Confluence: Support levels holding + bullish moving averages + increasing volume
🏢 Recent Catalyst: Michael Dell's recent high-profile donation demonstrates leadership confidence
⚙️ Trade Execution Checklist ✅
Before you hit that buy button, make sure:
You've sized your position correctly (max 5-10% of portfolio)
You've set your layered limit orders
You've placed your stop loss order
You've marked your take-profit levels
You've checked NASDAQ:NVDA and NASDAQ:QQQ for confirmation
You're emotionally prepared to stick to your plan
You've accepted that this is a SWING TRADE (hold time: 2-8 weeks) ⏰
🎬 The Bottom Line
This DELL trade is a high-probability setup combining:
✅ Strong technical pattern (TMA pullback)
✅ Solid fundamentals (AI server demand)
✅ Favorable risk/reward (1:2+ ratio)
✅ Multiple entry opportunities (layering strategy)
✅ Clear exit plan (no guessing games!)
Remember: The market is a patient wealth transfer from the impatient to the patient. We're playing chess while others play checkers! ♟️
🎭 Final Word from Your Favorite Trading Thief
Look, I'm not your financial advisor, I'm not FINRA-approved, and I'm definitely not responsible for your trades! 🤷♂️ This is the "Thief Style Trading Strategy"—a tongue-in-cheek approach to swing trading that emphasizes layered entries and disciplined exits. It's educational, it's entertaining, but it's NOT personalized financial advice!
Trade smart, not hard. Protect your capital, respect the market, and always have an exit plan! 🎯
✨ If you find value in my analysis, a 👍 and 🚀 boost is much appreciated — it helps me share more setups with the community!
⚖️ Legal Disclaimer & Risk Warning
🚨 READ THIS CAREFULLY:
This analysis is for educational and entertainment purposes only. The "Thief Style Trading Strategy" is a playful nickname for a legitimate technical trading approach, NOT an endorsement of illegal activity!
Risk Disclosure:
📉 Stock trading involves substantial risk of loss
💸 Past performance does not guarantee future results
🎲 You can lose more than your initial investment
🧠 This is NOT personalized financial advice
👨⚖️ Consult a licensed financial advisor before making investment decisions
📊 All price targets and technical analysis are subjective opinions
⚠️ I am not a registered financial advisor or broker-dealer
By reading this analysis, you acknowledge that:
You are solely responsible for your trading decisions
You understand the risks involved in stock trading
You will not hold the author liable for any losses
You will do your own due diligence before investing
Trade responsibly. Never invest money you can't afford to lose. Always use proper position sizing and risk management!
#DELL #DellTechnologies #NYSE #SwingTrading #TechnicalAnalysis #StockMarket #TradingSetup #AIStocks #TechStocks #BullishSetup #MovingAverages #LayeringStrategy #RiskManagement #TradingEducation #StockTrading #MarketAnalysis #InfrastructurePlays #ChipStocks #TechSector #ThiefStyle #TradingCommunity #StockTips #DayTrading #InvestSmart #FinancialFreedom
🎩 Happy Trading, Thief OG's! May your stops be tight and your profits be massive! 💰🚀
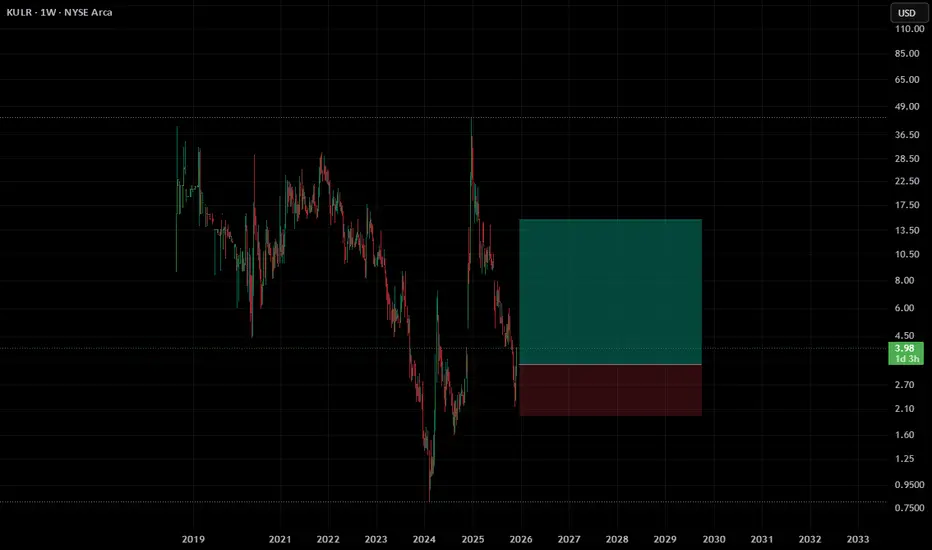
$KULR – Weekly Setup | High-Risk Swing Reversal PlayKULR has been in a prolonged multi-year downtrend, but price is now reacting from a historical demand zone that previously generated strong upward moves. The current weekly structure suggests a potential reversal attempt with a clear invalidation point.
This setup offers a large asymmetric opportunity if buyers manage to defend the recent lows.
📌 Entry
≈ CMP (it can make a retracement to 3.33, but, who knows)
📉 Stop-Loss
≈ 1.97 USD
Below the most recent structural low — break of this level invalidates the setup.
🎯 Take-Profit (Main Target)
≈ 15.09 USD
Targeting prior liquidity and inefficiencies from the 2021–2022 range.
📊 Risk / Reward
RR ≈ 1 : 3.5
Potential upside above 350% if the target is reached.
📎 Technical Breakdown
Price reacting from deep weekly demand.
Previous liquidity sweep near the lows.
Large imbalance above still unmitigated.
Multi-year downtrend makes the setup highly speculative.
⚠️ Note
This is a high-risk long play — setup is valid only while price holds the 1.97 USD low.
$ONDS (NASDAQ) Long SetupONDS is currently trading at an attractive accumulation level, with price compressing above higher-timeframe support and showing early signs of a bullish reversal. The asymmetric upside vs. downside risk makes this a high-RR swing entry.
📌 Entry: Buy now (market)
📌 DCA levels:
• $6.60
• $6.00
🛑 Stop-loss: $4.86 (invalidates structure + HTF support break)
🎯 Take-profit target: $20.00
💡 Plan Summary
Build position now + DCA on dips
Keep risk controlled with hard SL at $4.86
Targeting a macro breakout leg toward $20 if momentum confirms
📌 Why this setup is attractive
Strong higher-timeframe support bounce zone
Accumulation structure forming after extended decline
Favorable risk-to-reward ratio with 3×–4× potential upside
⚠️ Bias flips bearish only if price closes below $4.86 with expanding sell pressure. Until then, dips = opportunity.
#ONDS #Long #DCA #SwingTrade #HighRR 🚀

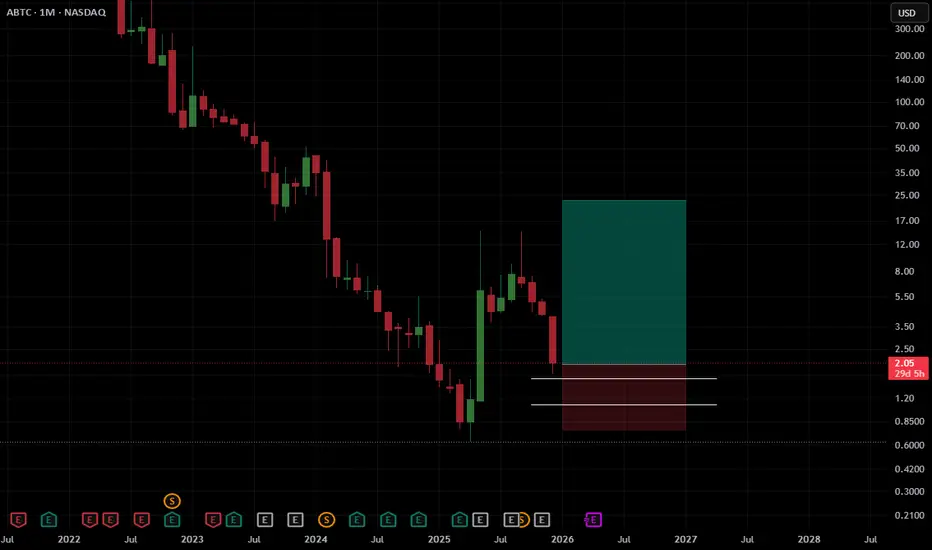
$ABTC (NASDAQ) Long Setup ABTC continues bleeding exactly as expected and has now tapped the lower white trendline for the 4th time within the macro down-channel. Every previous touch has generated multi-week rallies, even during bear phases.
With the monthly candle printing around $2.02 and extreme fear across crypto mining names, this area represents textbook generational accumulation territory.
💰 DCA Strategy — Buy every white-line kiss
• Tier 1 (Now): $1.95 – $2.15
• Tier 2: $1.45 – $1.65
• Tier 3: $0.95 – $1.15
📌 Stop-loss (optional): below $0.80 → would signal a definitive channel breakdown (considered unlikely for this 2026 cycle)
🧾 Take-profit / Scale-out Plan
• Scale 30% at $4.50 – $5.00
• Scale 30% at $8.00 – $10.00
• Let the remainder free-ride toward $20+
⏫ Risk-Reward: asymmetric upside — 10× to 50×+ potential by 2026–2027
❌ What invalidates the long-term thesis?
Only a monthly close below $0.80 with rising sell volume would break the channel and force reconsideration.
Until then, every white-line touch = automatic DCA add.
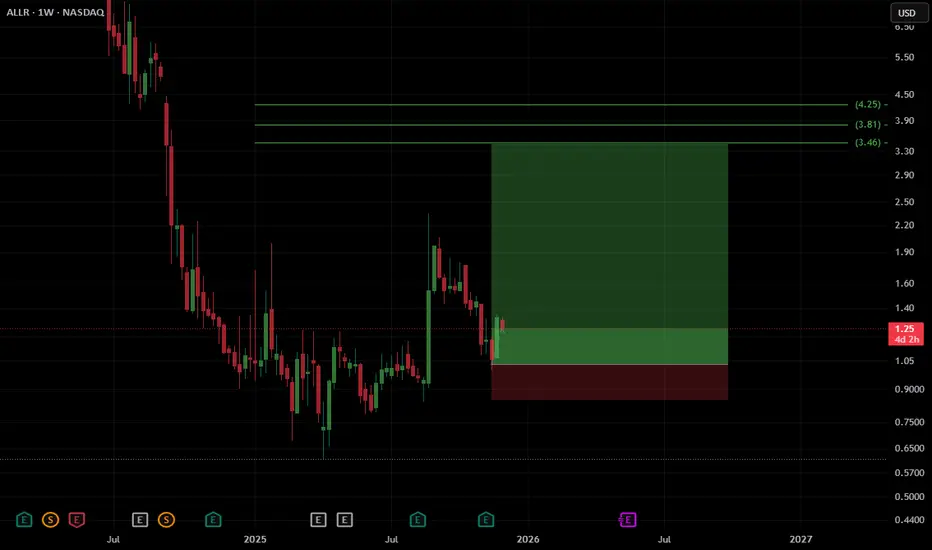
$ALLR (NASDAQ) Long Setup - Weekly ChartALLR is showing signs of a potential bullish reversal after an extended consolidation phase. Price has bounced strongly from a key weekly demand zone and is now holding above a significant support level, suggesting renewed buyers interest.
📍 Entry Zone: $1.03 – $1.26
🛑 Stop-Loss: $0.85 – $0.90 (below the recent swing low and structural support)
🎯 Targets:
• TP1 – $3.46
• TP2 – $3.81
• TP3 – $4.25
💰 Risk-to-Reward: Approx. 1 : 3.3
📈 Potential Upside: +233% if price reaches the full target zone
NFA
TCS – Momentum Shifting Upwards?1. Key Zones
Demand Zone: ₹2,850 – ₹3,000
Supply Zone: ₹3,600 – ₹3,720
2. Structure
Price has bounced strongly from the major weekly demand zone.
The descending trendline is broken, indicating a potential shift in momentum.
Price is now retesting the breakout zone for support.
3. Possible Move
If buyers hold above the ₹3,000–₹3,100 region:
→ Upside targets: ₹3,450 → ₹3,600 → ₹3,720
If price loses the ₹2,850–₹3,000 demand zone, weakness can resume.
4. Summary
TCS is showing early signs of a trend reversal after breaking the falling trendline.
Holding above the retest zone may lead to a push toward the upper supply area.
⚠️ Disclaimer
This analysis is for educational purposes only and not financial advice. Always do your own research and manage risk.

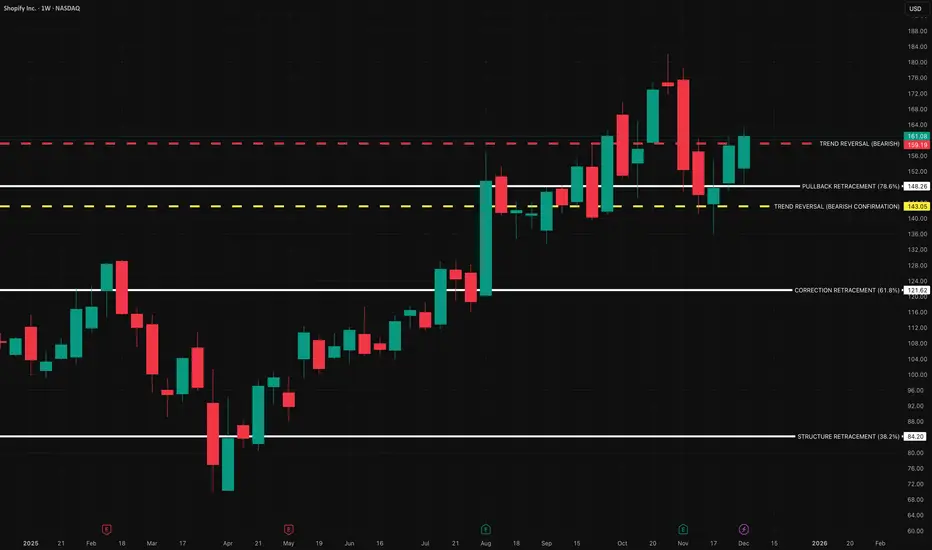
$SHOP | COVERAGE INITIATED — Personal Position Update [W49]COVERAGE INITIATED — Bullish Classification (Trend Shift Identified)
SHOP — WEEK 49 TREND REPORT | 12/05/2025
Ticker: NASDAQ:SHOP
Timeframe: W
This is a reactive structural classification of SHOP based on the weekly chart as of this timestamp. Price conditions are evaluated as they stand — nothing here is predictive or forward-assumptive.
⸻
Author’s Note — Personal Position Update
I initiated my own position on [ NASDAQ:SHOP ] during Week [ 49 ], entering at $ [ 161.08 ].
This decision follows my personal criteria: I only participate when my system identifies a verified structural trend shift supported by both a confirmed weekly flag and a qualifying candle state. This note reflects my activity only and is not a suggestion for anyone else.
As of this update, my position is currently up ~ [ 0% ] from my entry.
My structural exit level is $ [ 159.19 ] on a weekly-close basis. This level will continue to adjust upward automatically as the structure strengthens. If price closes below that threshold, my system classifies the trend as structurally compromised, and that is where I personally exit.
This update exists solely to document my own participation and the structural levels I monitor. It is not predictive and does not imply any future outcome.
⸻
Structural Integrity
1) Current Trend Condition [ Numbers to Watch ]
• Current Price @ $
• Trend Duration @ +0 Weeks
( Bullish )
• Trend Reversal Level ( Bearish ) @ $
• Trend Reversal Level ( Bearish Confirmation ) @ $
• Pullback Retracement @ $
• Correction Support @ $
⸻
2) Structure Health
• Retracement Phase:
Uptrend (operating above 78.6%)
• Position Status:
Healthy (price above both structural layers)
⸻
3) Temperature :
Neutral Phase
⸻
4) Momentum :
Bullish
⸻
Structural Alignment
UPWARD STRUCTURAL ALIGNMENT
This mark reflects a point where market behavior supported the continuation of the existing upward direction. It does not imply forecasting or targets — it simply notes where strength became observable within the current trend. Its meaning holds only while price continues to respect the broader structural levels that define the trend.
⸻
Methodology Overview
This classification framework evaluates directional conditions using internal trend-interpretation logic that references price behavior relative to its structural layers. These relationships are used to identify when price movement aligns with the framework’s criteria for directional phases, transition points, or regime shifts. Visual elements or structural labels reflect these internal interpretations, rather than explicit trading signals or preset indicator crossovers. This framework is observational only and does not imply future outcomes.
OKLO Bullish Momentum – Nuclear x AI Narrative Ignites SurgeNYSE:OKLO is up +24% this week, gaining strong momentum after Nvidia CEO Jensen Huang stated that the future of AI will be powered by “small nuclear reactors.” This powerful narrative crossover between AI and nuclear energy has lit a fire under small-cap nuclear names, with OKLO emerging as a standout. The volume spike and price action signal strong speculative interest.
Trade Setup:
🔹 Entry Zone: $105 – $109
🔹 Take Profit Targets: $125 / $140
🔹 Stop Loss: $99
🔹 Risk/Reward: Favorable if breakout holds with momentum and volume confirmation

Travere Therapeutics (TVTX) — Expanding Rare Kidney LeadershipCompany Overview
Travere Therapeutics NASDAQ:TVTX focuses on rare kidney & metabolic diseases, led by FILSPARI (IgAN) and Thiola (cystinuria)—a durable, high-margin franchise in a $10B+ nephrology market.
Key Catalysts
FILSPARI Growth: Q3’25 revenue $56M (+40% YoY) with accelerating prescriber adoption and expanding market penetration.
FSGS sNDA (2025): Positive Phase 3 data underpins label expansion; success could roughly double FILSPARI’s TAM.
Guidance Raised: FY revenue outlook $210–$225M, reinforcing operating momentum and margin leverage from a focused rare-disease model.
Why It Matters
✅ Category leadership in high-unmet-need nephrology
✅ Pipeline-driven upside via FSGS
✅ Attractive rare-disease economics (pricing, durability, margins)
Investment Outlook
Bullish above: $30–$31
Target: $60–$62 — supported by FILSPARI growth, potential FSGS approval, and sustained guidance momentum.

AMZN (Amazon) LONG SET UPLONG TRADE
Entry 1 $228.00
Stop loss $224.00
Take profit 1- $232.00
(Close 33%)
Take profit 2- $236.00
(Close 66%)
Take profit 3-$240.00

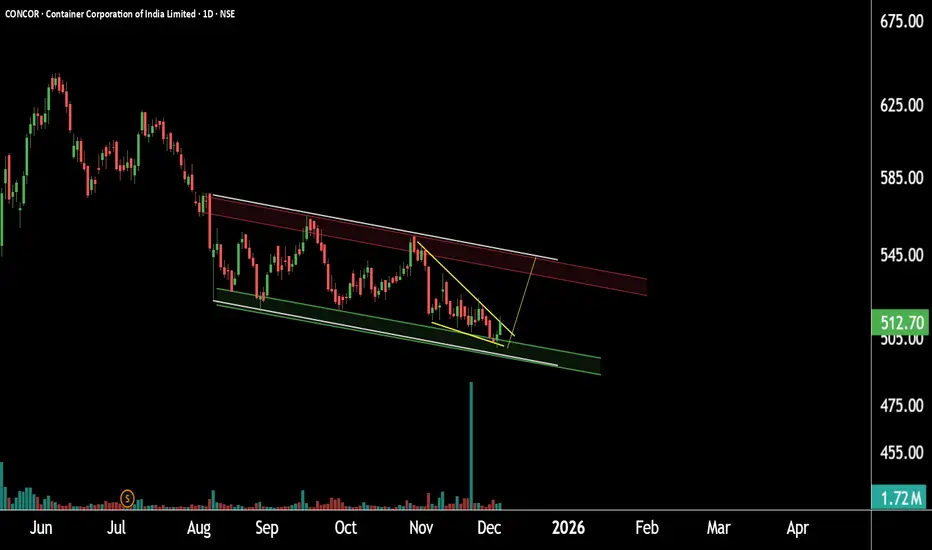
Concor Ready for Support Reversal ?This is the daily timeframe chart of Concor.
The stock is trading within a falling channel pattern, with a strong support zone around 490–510.
On the shorter timeframe, the structure is forming a falling wedge near the 500–510 area. If this support zone holds,
the stock may witness a potential upside toward 540.
Thank you.
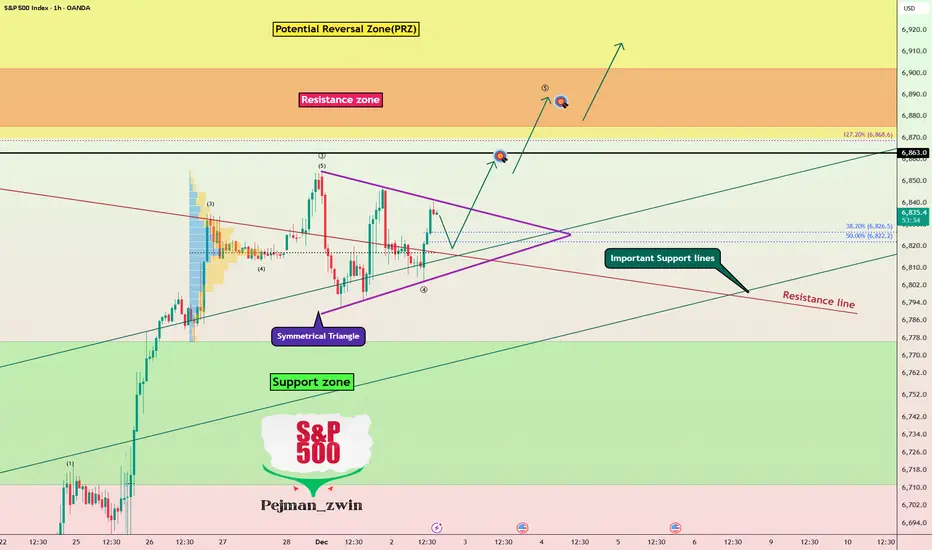
S&P 500 index Bull Run Continues — Symmetrical Triangle BreakoutThe S&P 500 index( SP:SPX ) has shown solid bullish momentum over the last 7 trading days, gaining more than +5% during this period.
The S&P 500 has once again moved back above Important Support lines, and it now appears to be breaking through a resistance line as well.
From a classical technical analysis perspective, the S&P 500 seems to be moving inside a symmetrical triangle pattern.
From an Elliott Wave standpoint, the S&P 500 looks to be completing Wave 4. A confirmed breakout above the upper line of the symmetrical triangle could validate the end of Wave 4.
I expect the S&P 500 to continue its upward movement and extend toward the Potential Reversal Zone(PRZ) and the Resistance zone ($6,902_$6,875).
What’s your view on the S&P 500 index and the broader U.S. stock market?
First Target: $6,859
Second Target: $6,887
Stop Los(SL): $6,774(Worst)
💡 Please respect each other's opinions and express agreement or disagreement politely.
📌S&P 500 Index Analyze (SPX500USD), 1-hour time frame.
🛑 Always set a Stop Loss(SL) for every position you open.
✅ This is just my idea; I’d love to see your thoughts too!
🔥 If you find it helpful, please BOOST this post and share it with your friends.
AMZN long-term TAAmazon is consolidating, the indicators do not support recent short-term runs which resulted in pullbacks but the trend is neither bearish, more neutral-bullish and also it supports SMA50 along the way, yes there were news about new AI chip from Amazon to rival Nvidia and so on and it has a chance to rally yet following the AI hype trend ride, but the volumes didn't react that much either, we just have to give it a little bit more time to finish the consolidation and project the approximate outcome.

SLV long-term TASilver is going parabolic as well as gold, sure there are many who wonder when is the correction, and yet it's bullish on weekly time frame yes, but there's a negative divergence in the process on daily that started after the recent distribution, which means mid-term will correct eventually and you can't ignore the gap between the price and SMA50 on weekly which is getting huge, so you have to be prepared for the correction in the near future. In general, even after the correction it has plenty of cash flow on weekly trend yet and it will take time to absorb and distribute all the supply and likely the uptrend will continue through 2026.

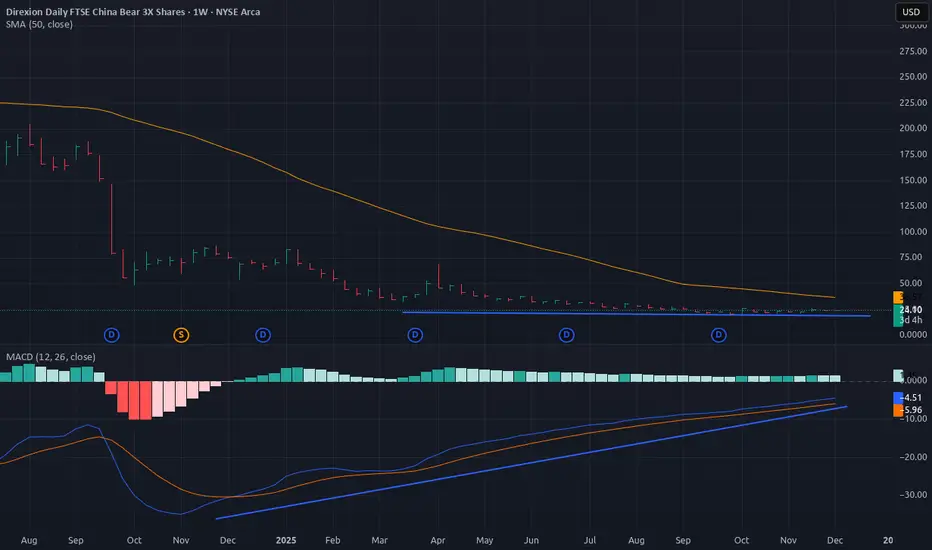
YANG long-term TABeware of China Bear long run, this ETF has been steadily improving its cash flow since September, even from the beginning of the year if you use MACD, you can notice that on many indicators including MACD, you can clearly see that something is cooking, yes the volumes are still in bearish territory but they are really close to breakout. Keep an eye on YANG.
S&P 500 (ES1!): Bullish! Look For Valid Buys!Welcome back to the Weekly Forex Forecast or the week of Dec. 1-5th.
In this video, we will analyze the following FX market: S&P 500 (ES1!)
The S&P500 rallied last week, closing strong! Look for follow through going into this week.
Go with the overall bullish trend until there is a bearish market structure break.
Enjoy!
May profits be upon you.
Leave any questions or comments in the comment section.
I appreciate any feedback from my viewers!
Like and/or subscribe if you want more accurate analysis.
Thank you so much.
Disclaimer:
I do not provide personal investment advice and I am not a qualified licensed investment advisor.
All information found here, including any ideas, opinions, views, predictions, forecasts, commentaries, suggestions, expressed or implied herein, are for informational, entertainment or educational purposes only and should not be construed as personal investment advice. While the information provided is believed to be accurate, it may include errors or inaccuracies.
I will not and cannot be held liable for any actions you take as a result of anything you read here.
Conduct your own due diligence, or consult a licensed financial advisor or broker before making any and all investment decisions. Any investments, trades, speculations, or decisions made on the basis of any information found on this channel, expressed or implied herein, are committed at your own risk, financial or otherwise.

MRVL long-term TAMarvell looks somewhat different than the other semis, weekly accumulation just started to enter the positive territory and there's currently a trampoline on mid-term, which means technically the price should go higher. Watch the blue line for support level to hold.
