TSLA Losing Momentum – Uptrend Breakdown RiskLooking at the current picture, both news flow and technical signals show that Tesla is entering a challenging phase. A series of recent negative developments — from large funds selling off, to declining sales in China, and Elon Musk potentially taking a loss on his latest share purchases — have clearly shaken market confidence. As a result, TSLA has been under continuous selling pressure, and its price action has weakened significantly compared to the previous bullish period.
On the chart, the resistance area around $447 continues to act as a “steel ceiling”: every touch has been firmly rejected. The recent strong bearish candle pushed TSLA back into the Ichimoku cloud, breaking the short-term upward structure. More importantly, the price is now at risk of losing the uptrend line that has held since April, indicating that medium-term bullish momentum is fading.
If TSLA fails to reclaim the $430–$447 zone in the next recovery attempts, a drop toward $329 becomes a very realistic scenario — this level has been a major support in the past and aligns with the lower boundary of the primary trend channel.
Stocktrading

SPX500 Breakdown Warning: Major Supports— Bigger Crash Ahead?The S&P 500 index ( SP:SPX ) has become increasingly significant recently, and it has a notable impact on cryptocurrency markets, especially Bitcoin ( BINANCE:BTCUSDT ). Therefore, analyzing the S&P 500 not only benefits its own market but also enhances our understanding of related markets.
Fundamental Analysis:
Volume confirms distribution, while the ongoing U.S. government shutdown delays critical data (CPI, PPI), fueling uncertainty and risk-off sentiment. Fed’s hawkish pause on rate cuts and tech sector rotation (TSLA -6%( NASDAQ:TSLA ), NVDA -3.5%( NASDAQ:NVDA )) reinforce bearish momentum. Also, YTD performance now -3.2% in November — on pace for the worst monthly drop since 2008 (-7.5%
Technical Analysis:
From a technical perspective, the S&P 500 index is breaking the Support zone($6,773_$6,710) and moving near the Support lines and 50_SMA(Daily) . Given recent data, there’s a possibility that these supports may break.
Additionally, according to Elliott Wave Theory , we can expect more corrective waves ahead.
I expect the SPX500 index to decline to $6,633 after the support cluster is broken in the first step.
First Target: $6,633
Second Target: $6,583
Stop Los(SL): $6,815
Please respect each other's ideas and express them politely if you agree or disagree.
S&P 500 Index Analyze (SPX500USD), 4-hour time frame.
Be sure to follow the updated ideas.
Do not forget to put a Stop loss for your positions (For every position you want to open).
Please follow your strategy and updates; this is just my Idea, and I will gladly see your ideas in this post.
Please do not forget the ✅' like '✅ button 🙏😊 & Share it with your friends; thanks, and Trade safe.

MSTR – Approaching Major Support as Downtrend ContinuesMicroStrategy remains in a clear higher-timeframe downtrend, and if Bitcoin continues to weaken, NASDAQ:MSTR could slide further toward the next major support level — now sitting roughly 63% below its all-time high. This zone may act as a potential reversal area, especially if market sentiment stabilizes.
Trade Setup:
• Entry Zone: $170 – $180
• Take Profit Targets:
🥇 $280
🥈 $360
• Stop Loss: $122

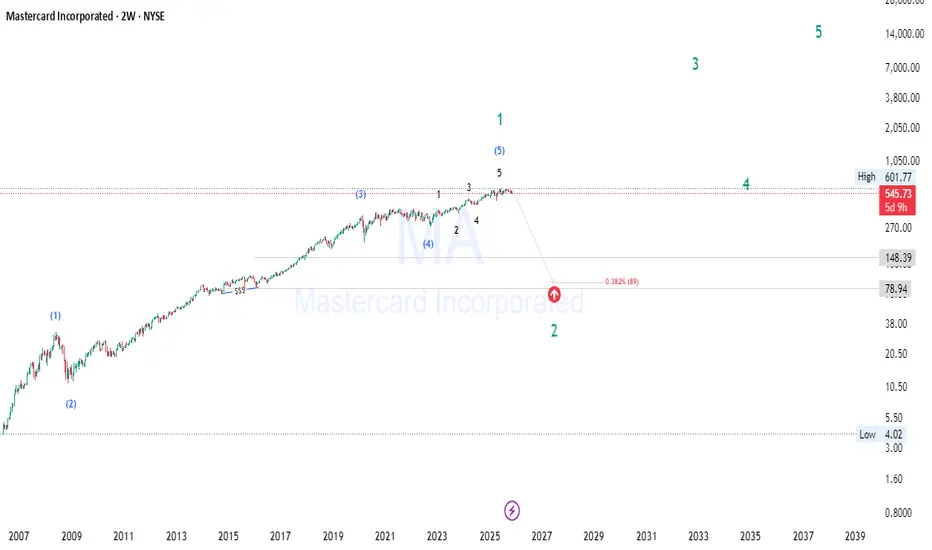
Mastercard (MA) Hits Key Cycle Top — Correction Incoming!🧠 Mastercard (MA) — In-Depth Multi-Framework Market Analysis
Mastercard’s long bull run has matured into a classic Wave 5 exhaustion.
Multiple frameworks agree: a deep corrective phase is likely ahead.
Understanding market structure, smart money moves, and Fibonacci levels can help you navigate this reset .
🌀 Wave Theory & Elliott Wave Context
Mastercard’s chart shows a clear completed 5-wave impulsive structure spanning roughly 15+ years, typical of a major secular bull cycle. The small sub-waves within Wave 5 suggest final exhaustion:
Wave 5 ending near key Fibonacci extensions signals an exhaustion climax.
After such extended waves, expect a significant corrective ABC pattern or even a complex correction resetting much of the prior gains.
The correction here is likely a large Wave 2 on the higher degree, meaning the retracement could be deep and prolonged, typically lasting multiple years.
📉 Market Structure Breakdown & Key Price Action Signals
Price has failed to push to new highs with conviction, showing lower highs and a breakdown of previous support levels.
This breakdown in market structure suggests the shift from an accumulation or markup phase to distribution and markdown.
Multiple wick rejections and volume spikes near highs imply liquidity sweeps and stop hunts by institutions, signaling transfer of risk.
Price action shows signs of fatigue — smaller candles, overlapping bars, and diminished momentum — classic exhaustion signals.
🧠 Smart Money Concepts (SMC)
Institutional players often engineer liquidity grabs above key levels (stop hunts) to shake out retail participants.
The immediate reversal following those liquidity grabs is a hallmark of distribution , where "smart money" sells into retail enthusiasm.
The absence of strong demand at these levels reinforces the notion of a shift from bullish to bearish control.
📊 Fibonacci Retracement & Extension Levels
Wave 5 terminated near the 2.618 Fibonacci extension , an extreme but well-documented exhaustion zone for extended impulses.
The retracement target aligns with the 0.382 Fibonacci retracement (~$89–95) , the first major support for Wave 2 corrections.
More conservative estimates place support near 0.5–0.618 retracement , which historically mark deep correction zones in longer cycles.
These levels also coincide with significant prior consolidation zones, increasing their validity as support.
💼 Fundamental Context & Market Cycles
Mastercard’s underlying fundamentals remain solid, with strong revenue growth and market dominance.
However, market cycles are driven by liquidity and psychology — no fundamentally strong company is immune to price corrections during macro resets.
This correction could coincide with broader economic or sector rotation phases, impacting valuation multiples and capital flows.
🔮 Strategic Outlook & Trading Implications
Expect a multi-year correction phase , potentially volatile, with several retracements and consolidations along the way.
Patience is key: major Wave 2 corrections often shake out weak holders and reset risk/reward dynamics for the next bull phase (Wave 3).
Traders should look for confluence zones combining Fibonacci support, prior market structure, and volume profile for entries.
Watch for price action confirmation of a base formation before resuming a bullish stance.
💡 Key Takeaways for Traders
Long-term cycle completion means caution: avoid chasing new highs here.
Use Fibonacci and wave structure to anticipate price targets and exits.
Monitor volume and liquidity sweeps to identify distribution phases.
Be prepared for deep, sometimes painful corrections even in high-quality stocks.
Focus on risk management and position sizing during volatile cycle resets.
Stay ahead of the market — follow for advanced wave counts, Fibonacci setups, and smart money insights.
Comment 👇 your ticker to get a personalized deep-dive analysis next! 🚀
Disclaimer:
This analysis is for educational purposes only and does not constitute financial advice. Always conduct your own research and consult a professional before trading.
#Mastercard #MA #WaveTheory #ElliottWave #SmartMoneyConcepts #SMC #Fibonacci #MarketStructure #PriceAction #TradingView #TechnicalAnalysis #StocksToWatch #MarketCycles #LiquidityHunt #TradingEducation #InvestSmart #StockAnalysis
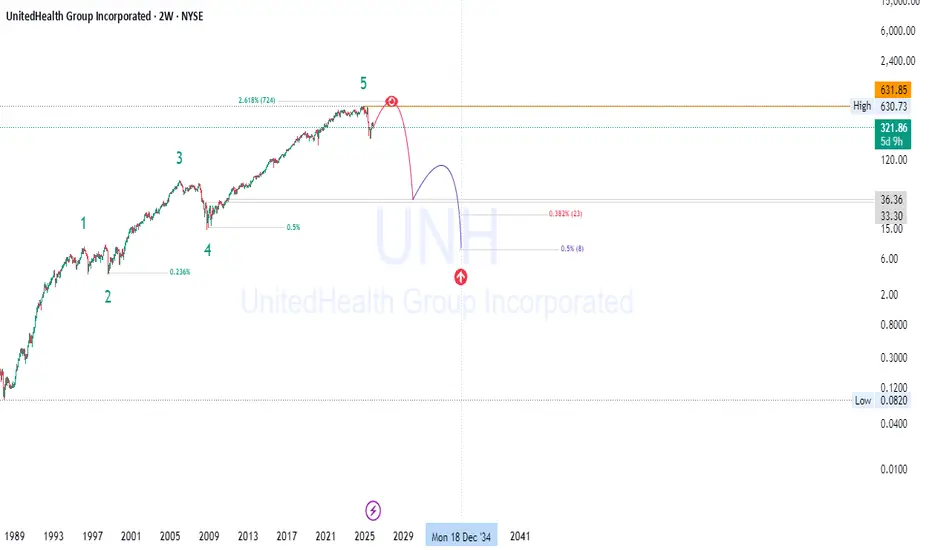
UNH Liquidity Grab Signals Cycle Reversal - Are you ready?A multi-decade bull cycle doesn’t end quietly.
UNH’s Wave 5 has reached exhaustion, and the chart is finally revealing what the next macro chapter might look like.
When price, structure, Fibonacci geometry, and smart money behavior all align — the market is speaking.
🌀 Wave Theory
UNH has completed a full 5-wave macro cycle , with Wave 5 extending unusually far. Extended fifth waves often lead to deep corrections as the trend matures.
🔍 Market Structure
For the first time in years:
higher highs stopped forming
internal structure broke
price failed to reclaim the breakdown
These are early signs of long-term reversal.
🧠 Smart Money Concepts
Institutional behavior is visible at the top:
liquidity sweeps above prior highs
distribution in premium pricing
immediate sell-offs after stop hunts
These are not accumulation behaviors.
📈 Price Action
Wicks, compression, and fading demand show exhaustion.
Large inefficiencies remain unfilled far below current price — and markets revisit these over time.
📊 Fibonacci Geometry
Wave 5 halted nearly at the 2.618 extension , a textbook termination point.
Retracement zones at 0.382–0.5 match the likely landing zone for a large ABC correction.
🔮 Takeaway
Even fundamentally strong companies undergo cycle resets.
This setup suggests UNH may be entering a multi-year corrective phase , fully consistent with long-term market cycles and technical exhaustion.
If you found this breakdown valuable, follow for more multi-timeframe analysis, wave theory insights, and institutional-level charting.
Drop your tickers in the comments 👇 — We’ll analyze the next one 📊🔥
#UNH #WaveTheory #ElliottWave #SmartMoneyConcepts #SMC #FibonacciTrading #MacroCycles
#PriceAction #MarketStructure #TradingView #TechnicalAnalysis #ChartPatterns
#LongTermInvesting #MarketCycles #Liquidity #TraderEducation #StocksAnalysis
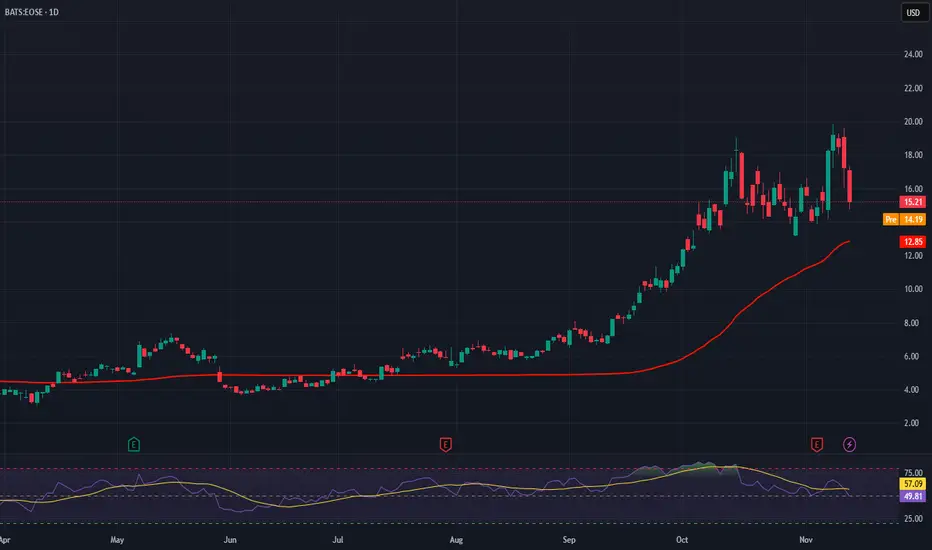
Perellla - Short 1. Price Rejected from Key Resistance Zone
The highlighted orange zone around $19.20 – $20.00 has rejected price over and over again.
This is a strong supply zone where sellers consistently take control.
Price failed again to break above it → bearish signal.
2. Below the 50-Day Moving Average
Price is trading under the 50 SMA (blue line).
The 50 SMA is sloping downward, confirming downtrend structure.
Every touch of the 50 SMA has resulted in sell-offs → clear resistance.
3. Lower Highs + Weak Bounces
The recent bounce couldn’t break above previous highs.
This creates a series of lower highs, a classic sign of continuation to the downside.
4. Bearish Break & Retest Pattern
Price broke below support around $19.00, then came back to retest it from below.
Retest failed → now turning down again.
This is one of the strongest short patterns.
5. Volume Weakness on the Upside
Recent green candles show weak volume, while selling candles have stronger pressure.
Bears are in control.

Eos Energy Enterprises (EOSE) —Zinc LDES for the AI-Powered GridCompany Overview:
Eos NASDAQ:EOSE builds zinc-based long-duration energy storage (LDES) for utility-scale and commercial use—an alternative to Li-ion with safer chemistry, broader temperature tolerance, and U.S. manufacturing.
Key Catalysts:
AI-Energy Momentum: Major wins include Talen Energy collaboration and a 228 MWh Frontier Power order—validating Z3™ systems for data centers and grid reliability.
Manufacturing Scale-Up: Project AMAZE set to double capacity to 2 GWh by Q4’25, supported by state incentives and an expanding domestic footprint.
Revenue Visibility: Pipeline includes an $18.8B opportunity backlog and $672.5M firm orders, featuring 750 MWh with MN8 Energy—supporting multi-year growth.
Why It Matters:
✔️ Non-Li-ion diversification for utilities and hyperscalers
✔️ U.S.-built supply chain + incentives
✔️ LDES fit for peaker replacement, resiliency, and 24/7 clean power
Investment Outlook:
Bullish above: $12.50–$13.00
Target: $40.00–$42.00 — driven by orders converting to revenue, capacity ramp, and AI/data-center demand for reliable long-duration storage.
📌 EOSE — powering AI-era reliability with zinc-based long duration storage.
SPX – Deep Correction or Opportunity for a Rebound?While the S&P 500 has seen impressive recoveries recently, current technical signals and macroeconomic factors indicate a high likelihood of a deep decline in the short term.
From a macroeconomic perspective , rising bond yields and excessive optimism about tech stocks have contributed to a strong correction in the SPX. Additionally, concerns about the Fed not continuing to cut interest rates have increased caution in the market.
From a technical analysis standpoint, SPX is currently facing strong resistance around 6,850. The chart shows that the index is trading near an upward trendline, but if it breaks the 6,600 support, SPX could continue to fall sharply to 6,550 in the medium term.
Conclusion: With both technical and macroeconomic factors supporting a bearish trend, the likelihood of SPX continuing a sharp correction in the next 24-48 hours is very high. If the price fails to hold the 6,600 support, a deeper decline is a likely scenario.
Recommendation: Monitor key support and resistance levels and consider opening a SELL position if the price confirms a break of these critical support zones.

Beta Bionics (BBNX) — Scaling the iLet Bionic PancreasCompany Overview:
Beta Bionics NASDAQ:BBNX leads automated insulin delivery with the iLet Bionic Pancreas, which auto-adjusts dosing and removes manual input—unlocking a large, underpenetrated U.S. diabetes market.
Key Catalysts:
Rapid Adoption: Installed base up +162% to 29,419 users (Q3’25), signaling strong product-market fit.
Beat & Raise: Q3 sales $27.25M (+14% vs. estimates) and FY25 guidance raised to $96.5M—driven by pharmacy-channel expansion and recurring consumables.
Ecosystem Strength: Abbott sensor integration supports seamless data flow and advances fully automated diabetes care.
Durable Model: Hardware + consumables flywheel enhances visibility and margin scalability as the base grows.
Investment Outlook:
Bullish above: $23.00–$23.50
Target: $42.00–$44.00, supported by accelerating user growth, recurring revenue leverage, and ecosystem partnerships.
📌 BBNX — Automating insulin, compounding recurring revenue.

There might be sudden pump in $LKQ If we can stay above $31,10 we are about to go toward $34. Lets see how this will play out. Good luck for you all

S&P 500 (ES1!): Is This The Dip We Were Waiting For? Yes!Welcome back to the Weekly Forex Forecast or the week of Nov. 10-14th.
In this video, we will analyze the following FX market: S&P 500 (ES1!)
The S&P500 is respecting the Weekly +FVG... barely! Friday's rally may indicate the pullback is over and the resumption of the bullish momentum is upon us.
Look for valid buy setups only! Sells are not valid unless there is a bearish break of structure!
Enjoy!
May profits be upon you.
Leave any questions or comments in the comment section.
I appreciate any feedback from my viewers!
Like and/or subscribe if you want more accurate analysis.
Thank you so much.
Disclaimer:
I do not provide personal investment advice and I am not a qualified licensed investment advisor.
All information found here, including any ideas, opinions, views, predictions, forecasts, commentaries, suggestions, expressed or implied herein, are for informational, entertainment or educational purposes only and should not be construed as personal investment advice. While the information provided is believed to be accurate, it may include errors or inaccuracies.
I will not and cannot be held liable for any actions you take as a result of anything you read here.
Conduct your own due diligence, or consult a licensed financial advisor or broker before making any and all investment decisions. Any investments, trades, speculations, or decisions made on the basis of any information found on this channel, expressed or implied herein, are committed at your own risk, financial or otherwise.

XAUUSD | Breakout Above Supply Zone – Targeting 4140–4150 NextGold has successfully broken above the supply zone (4020–4060), confirming a bullish structure shift after multiple rejections in the past week. The clean breakout now opens the path for a liquidity grab toward 4140–4150, aligning with higher timeframe inefficiencies.
Trade Plan:
Entry Zone: Retest of 4040–4060 (previous supply turned demand)
Bias: Bullish continuation
Target 1: 4129 (intra-day liquidity level)
Target 2: 4153 (major HTF resistance)
Invalidation: Below 4020

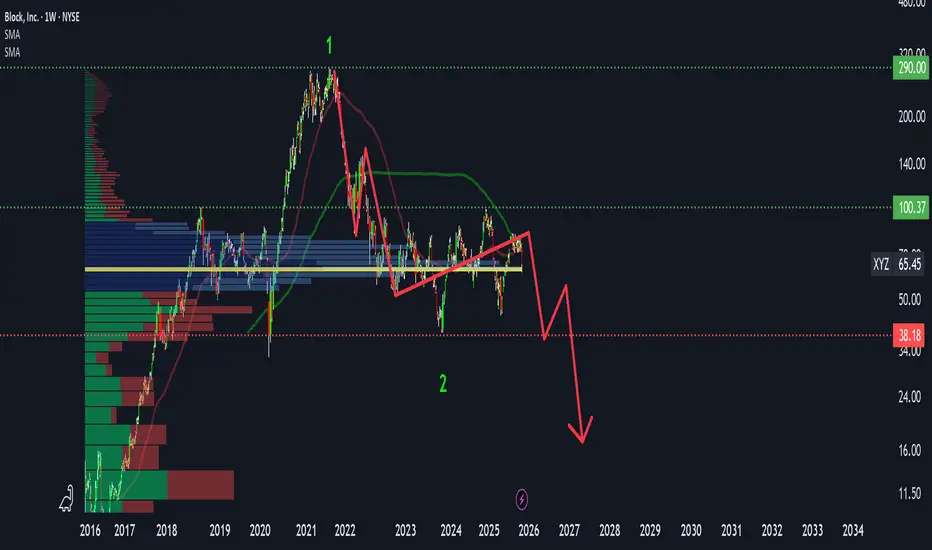
Block (XYZ): Weak Earnings, Bitcoin Exposure, and the Next Move📊 Fundamental Overview
I entered Block (XYZ) about a year ago when the company’s cash flow trends were very strong.
However, right now the picture is becoming more concerning.
EPS growth is not stable.
Previously, EPS was growing rapidly (65%, 38%, 155%), but the last two quarters showed only –10% and +13% growth.
Revenue growth stagnated.
Year-over-year revenue used to grow strongly —
2019: $4M → 2020: $9M → 2021: $17M → 2023: $21M → 2024: $24M — but is now roughly flat (~+1% YoY).
Forward P/E: ~22.7 — not particularly attractive considering the company’s decelerating fundamentals.
Share dilution stopped.
Since 2022, Block has halted share issuance, and total shares outstanding remain stable within ±2%, which is a positive signal compared to other fintech peers.
💥 Q3 Earnings Miss
In the latest earnings report:
Expected EPS: $0.63 → Actual: $0.54
Revenue: $6.11 B (below expectations)
The miss triggered a 15–18% drop after earnings, followed by a partial rebound as dip buyers stepped in.
But fundamentally, the company is clearly losing growth momentum.
₿ Bitcoin Exposure Risk
Block currently holds about 8,700 BTC (~$1 billion) on its balance sheet.
While this gives long-term upside potential, it also adds massive volatility risk.
If Bitcoin enters a –70% correction (which I expect in the next 3–4 months), that could hit Block’s balance sheet hard and accelerate the drawdown.
📈 Technical Structure
Technically, the stock has already corrected about –86% from its all-time high.
We’re currently sitting inside a major accumulation cluster between $50–80 — a very strong volume node.
If this cluster breaks down, the next major support zone is $8–15, which would imply a potential –90%+ drawdown, typically a “pre-bankruptcy” level of decline.
After the latest earnings report, XYZ dropped by nearly 18%, forming a noticeable gap down. However, the volume on this sell-off was relatively low compared to the massive volume spikes seen in July 2025.
Typically, such sharp post-earnings drops come with high capitulation volume, signaling panic selling and potential bottom formation, but this time, that confirmation is missing.
This raises the risk that the current decline might not yet be over, and that smart money may still be waiting lower, around the next demand zone.
From a wave-structure perspective, it looks like wave 1 is complete, followed by a sharp corrective move that has already exceeded the typical 38–62% retracement range, falling by about 86%, an unusually deep correction, but not impossible within a prolonged cycle.
The ongoing consolidation phase has lasted significantly longer than previous ones, which increases the probability of a final downward push, forming a classic zigzag pattern (A–B–C), a drop, consolidation, and one more leg down to complete seller capitulation.
Volume patterns in such structures usually peak in the middle of the formation, aligning with current price behavior.
Technically, both outcomes remain open,
we could see a short-term bounce from this zone or a double zigzag (dZ) structure unfolding lower before the true bottom forms.
Upside momentum currently lacks fuel, fundamentals don’t support a strong rally yet.
If price breaks above $100, the next upside target sits around $280, offering roughly 4× potential from current levels.
So the setup remains binary, either accumulation continues before reversal, or we break down further in sync with BTC weakness.
⚠️ Risk View
Fundamental growth has stalled.
Earnings miss raises red flags.
Bitcoin exposure magnifies downside risk.
If price breaks below $32–30, that would confirm a breakdown, potential free-fall to $8–15.
On the positive side, the company stopped share dilution, maintains good liquidity, and still has strong brand power in fintech.
🧩 My Position
I currently hold a protected position (protective puts) till march 2026, limited downside, but I’m considering a full exit.
There’s no visible fuel for strong upside, and with BTC risk rising, the short-term picture remains shaky.
If we see capitulation into the $30–40 range with BTC bottoming, that could be a smart-money accumulation zone again.
🔑 Key Levels
$100 → breakout confirmation, opens path to $280
$50–80 → main accumulation cluster
$32–30 → invalidation / stop-loss zone
$8–15 → next major demand zone if breakdown continues
🧭 Summary
Block’s fundamentals are slowing, its Bitcoin exposure is a double-edged sword, and technically we’re at a critical level.
If BTC corrects sharply, Block could retest the $30–40 area or even lower, but if it holds and reverses above $100, the next bull wave could be massive.
At this stage, risk management and patience are key.
Sold Half PYPL. Raised Stops.Trading Fam,
Recently, you may remember, my new indicator triggered a BUY alert on quite a few stocks. Paypal was one of them. I entered this trade at around $69 dollars with a moderate target of $79 for a 1:2 rrr. We've nearly reached that target today. So, I've sold half, taken profit, raised my stops, and I'll let the rest ride. You know where to track the remainder of my trades.
Congrats to those who followed me. We've now won the last 13 of 13 trades for an avg. profit of 37%. As I continue to grow in experience with my indicator, we will only get better.
✌️Stew

Sold Half Amazon - Raised Stops - Halfway to Final Target!Trading Fam,
We are halfway to my final target. I've been trading safe lately. So, I decided to sell half here, capture some profit, and raise my stops to $225, ensuring we're all in the money on this trade.
Congrats to those who followed me. We are 14 wins for the last 14 trades with an avg. of 33% profit per trade. Since implementing my new indicator just over a year ago, I continue to improve trade accuracy with each trade. Experience is growing and so are our wallets. Our portfolio is up 69% since we started with the indicator! Those are incredible stats for any trader, nevermind someone like me who just learned how to trade liquidity!
You guys know where to find me and all of my trades. 100% free to all of my followers.
✌️Stew
The Psychology Behind Winning Trades The Psychology Behind Winning Trades 🧠💹✨
Introduction – Hook:
📊 “Why do some traders consistently win 💰 while others struggle 💔?”
It’s rarely the strategy—it’s the mindset behind the trade! 🧠🌟
Your emotions, thoughts, and biases control your decisions, even with perfect technical skills. 🎯
1️⃣ What is Trading Psychology?
Trading psychology is the study of how emotions and mental habits affect trading decisions. 🌈🧘♂️
It’s about understanding:
How fear 😨, greed 😍, or impatience ⏳ impacts your trades
Why you sometimes ignore your rules 📝
How discipline 💪 can make the difference between profit 🏆 and loss 💸
💡 Tip: Even the best strategies fail if your mind isn’t in control. 🧠✨
2️⃣ Common Psychological Traps & How They Appear in Trades
Trap Emoji Effect Example in Trading
Fear 😨 Exiting too early Closing a winning trade because you’re scared of losing profits 💔
Greed 😍 Holding losing trades Waiting for a loss to “come back” and losing more money 💸
FOMO 🏃♂️💨 Jumping impulsively Entering trades last minute because everyone else is trading 🚀
Revenge Trading 😤🔥 Emotional loss-chasing Trying to recover losses by taking bigger, risky trades 💣
💡 Insight: Recognizing these emotions is the first step to controlling them. 🌟
3️⃣ How to Master Your Trading Mind
1️⃣ Pre-Trade Preparation 🧘♀️✅
Check your emotional state before trading 🕊️
Confirm your trade plan is clear 📋✨
2️⃣ During the Trade ✋🎯
Stick to your rules, don’t let emotions take over 💪🔥
Avoid impulsive exits or entries ⏱️❌
3️⃣ Post-Trade Reflection 📖🖊️
Keep a Trading Journal: note emotions, mistakes & wins ✨📓
Review trades to improve your mindset over time 📈🌟
4️⃣ Pro Tips for Winning Psychology
🔥 Mindset Checklist:
Am I trading calmly? 😌💭
Am I following my plan? 📋✅
Am I chasing losses or profits emotionally? ⚖️💡
💡 Daily Mindset Practice: Meditation 🧘♂️, journaling ✍️, or reviewing trades 📊 can help you stay disciplined under pressure 💎🌟
5️⃣ Why It Matters
Trading without psychology = strategy leaks money 💸💨
Emotional control = consistency, higher win rates, confidence 🏆💪
Professionals don’t just trade charts—they trade themselves 🧠✨
6️⃣ Engagement Section
👇 Question for your audience:
“What’s the biggest psychological trap YOU’ve faced in trading? Share your story below! 💬💭💖”

Taking the QUBT Here - LONGTrading Fam,
Got the BUY from my indicator here on QUBT. Even with the market acting toppy, I've got to trust this thing! I can hardly believe how accurate it has been in stocks, nearly doubling our portfolio in just over a year since implementation. No more hours and hours of studying charts, drawing trendlines and patterns, and then ...essentially guessing. When the thing alerts me to buy, I buy, and when the thing alerts me to sell, I sell (or go short). The results are there. I've been doing this all publicly so that you can observe the results right along with me and everyone else who cares. Wins are posted. Losses are posted. It works on stocks. It's horrible with crypto. Two trackers. Both telling very different stories. And I've learned. It's about high mc and high volume. If I don't have that, it just isn't as accurate. But when I do, we are on fire. Indeed, my last 18 exits from stocks have all been wins, and we have averaged 30% profit per trade. So, let's do this again!
Here on QUBT, you can see I have one trendline drawn. If we break that? I might have my first loss since March and it is probably time to sell. But since I received a buy signal from my indicator right on that line, I'm going to take the trade. I'll be shooting for just over $23 for a net profit of over 46%. My stops are set at $13.13 rn. This give me a rrr of 1:3.
Let's go!
✌️Stew

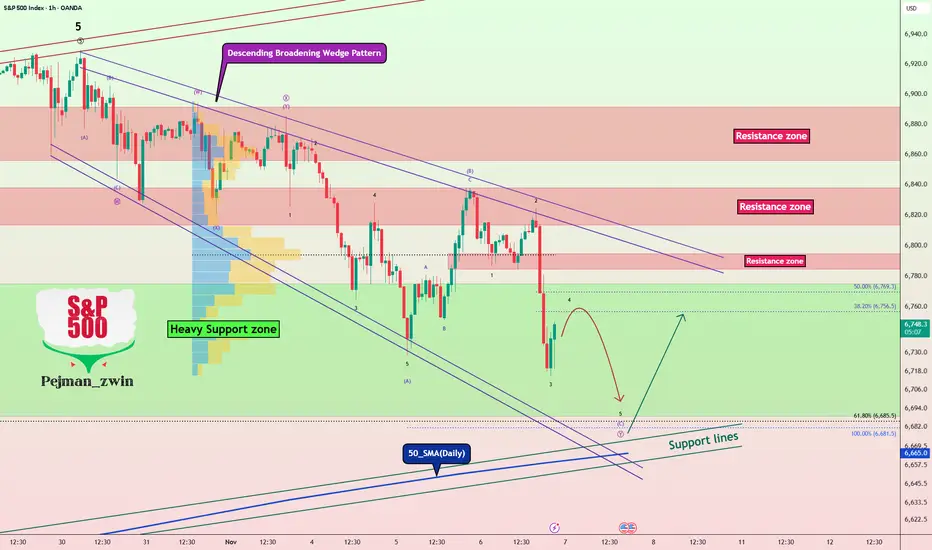
S&P 500 at Make-or-Break Level – Bulls’ Last Chance!As I expected in the previous idea , the S&P 500 index ( SP:SPX ) has reached its target.
Given that the S&P 500 index has a strong correlation with other financial markets, especially Bitcoin ( BINANCE:BTCUSDT )—sometimes even tracking them candle-by-candle—it's a good idea to pay extra attention to the S&P 500 index these days.
Currently, the S&P 500 index is moving in a Heavy Support zone($6,775_$6,689) , although it entered this zone with a lot of downside momentum.
From a classic technical analysis perspective, there's still a chance that the descending broadening wedge pattern will hold. As long as this pattern isn't invalidated, we can still hope for at least a short-term bullish move.
From an Elliott Wave perspective , it seems like the S&P 500 index is completing the microwave 4 of the microwave C of the main wave Y within the descending broadening wedge.
I expect that after the next small dip, the S&P 500 index will start rising again from near the lower boundary of the wedge, the 50_SMA(Daily) , and Support lines .
Note: If the S&P 500 index falls below about $6,650, we should expect further downside. So let's keep an eye on that level.
Please respect each other's ideas and express them politely if you agree or disagree.
S&P 500 Index Analyze (SPX500USD), 1-hour time frame.
Be sure to follow the updated ideas.
Do not forget to put a Stop loss for your positions (For every position you want to open).
Please follow your strategy and updates; this is just my Idea, and I will gladly see your ideas in this post.
Please do not forget the ✅' like '✅ button 🙏😊 & Share it with your friends; thanks, and Trade safe.
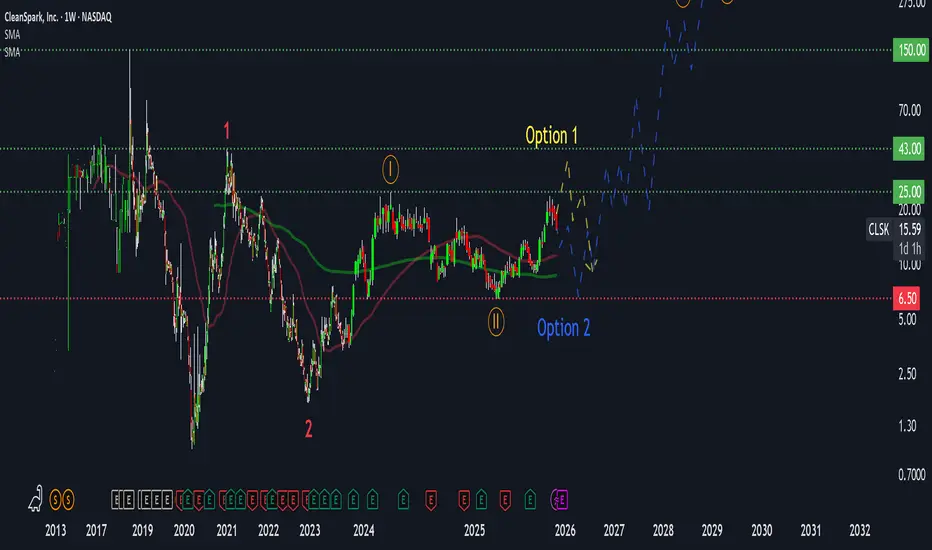
CleanSpark (CLSK): Strong Upside Expected After CorrectionWhy this matters now:
CleanSpark remains one of the strongest miners in the sector, but the current technical structure suggests a likely correction before the start of a major bullish cycle.
🔹 Main Thesis
Technically, CLSK is bullish, but a short-term correction to $8–10 is expected, after which the stock could launch a strong upward move toward $43 and beyond.
🔹 Key Arguments
Wave Structure:
Wave 1 is complete ✅, Wave 2 (correction) is underway. We are now in the final phase before the next impulse wave.
Resistance $25–43:
$25 is a key previous high. A short-term breakout with a small pullback is possible, followed by a retest and formation of the next upward wave. Targets: $43, then $150+.
Volume Cluster $8–10:
The main smart money cluster where significant positions were accumulated provides strong support. This is likely the bounce zone after the correction.
Fundamentals:
EPS growth ~50% YoY, forward P/E ~15. Cash flows are unstable.
Correlation with Bitcoin:
As a Bitcoin miner, CLSK is highly correlated with BTC. Historically, when BTC corrected 70–80%, CLSK tested lows in the $8–10 zone.
Currently, CLSK could first rise to $30–35 and then correct along with BTC by roughly 70%, aligning with the $8–10 support cluster.
Levels and Targets
Resistance: $25 - key level, possible false breakout
Support / Smart Money Cluster: $8–10 - likely bounce zone
Final Cycle Targets: $43 → $150 - breakout above $43 opens the path to $150+
🔹 Risk & Invalidation
Main Risk: strong BTC correction → CLSK tests $8–10 cluster.
Historically, four previous corrections in BTC were around 70–80%, matching the current structure.
❌ Invalidation: break and close below $6 → current wave structure would be invalidated and require reassessment.
🔹 Summary
CleanSpark is forming a strong bullish trend. After a possible correction to $8–10, a powerful upward impulse is likely, with targets at $43 and beyond. Potential from current levels: 10x+, but the path includes a consolidation phase.
🔹 Discussion
What’s your take on CLSK? Do you agree with the correction scenario, or do you see a different move?
💬 Comment below or suggest which ticker we should analyze next!
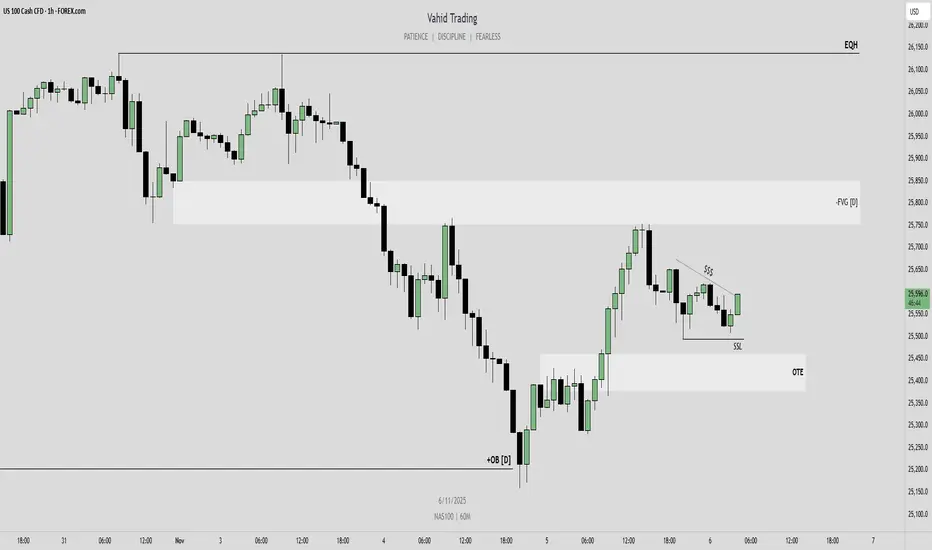
US100 – Bullish Continuation in Play After Daily OB ReactionHello traders,
On the 1-hour chart, NASDAQ (US100) has reacted strongly from the bullish Daily Order Block, showing clear signs of higher-timeframe strength. This reaction suggests that the bullish order flow is still intact.
With this structure in mind, I expect the upward move to continue toward the bearish Daily Fair Value Gap, which serves as my first target.
My final target for this bullish leg is the equal highs around 26,136, where a significant liquidity pool rests.
However, before the next expansion higher, I would prefer to see price move lower to sweep the liquidity below the recent lows and trade into an Optimal Trade Entry (OTE) zone. From there, I’ll look for lower-timeframe confirmation to catch the next leg up.
Staying bullish unless higher-timeframe invalidation occurs.
💌It is my honor to share your comments with me💌
🔎 DYOR
💡Wait for the update!
S&P 500 at Critical Support – Last Line of Defense?Since the S&P 500 index( SP:SPX ) is one of the key indicators in the financial markets, and it’s been highly correlated with parallel markets recently, it's always a good idea to keep an eye on its analysis.
Now, for example, Bitcoin ( BINANCE:BTCUSDT ) started to decline as the S&P 500 index dropped, and right now the S&P 500 index is at a pretty critical Support zone($6,774_$6,689) and Support lines. It's essentially moving right around its last line of hope.
From an Elliott Wave theory perspective, in this current zone, the S&P 500 index could be completing the Triple Three Correction(WXYXZ)=main wave 4.
Looking ahead, we might expect the S&P 500 index to climb up toward its Resistance zone($6,894_$6,859). And given the current positioning, the risk-to-reward ratio looks quite favorable—as long as you keep a reasonable stop loss in place and practice good risk management.
Note: if these Support lines break downward, we could see further declines in the S&P 500 index and in those correlated markets as well. So it's definitely something to monitor closely.
Please respect each other's ideas and express them politely if you agree or disagree.
S&P 500 Index Analyze (SPX500USD), 1-hour time frame.
Be sure to follow the updated ideas.
Do not forget to put a Stop loss for your positions (For every position you want to open).
Please follow your strategy and updates; this is just my Idea, and I will gladly see your ideas in this post.
Please do not forget the ✅' like '✅ button 🙏😊 & Share it with your friends; thanks, and Trade safe.

S&P 500 Bulls Back in Control – New All-Time High Ahead?As I expected in my previous idea , the S&P 500 index( SP:SPX ) pulled back from its Resistance lines and hit its target.
Right now, the S&P 500 index is in the process of breaking through a Resistance zone($6,894_$6,859). Just a few hours ago, it successfully broke above the upper line of a descending channel , which is a positive sign for a renewed upward move .
From an Elliott Wave perspective, it seems that the S&P 500 index has completed its main wave four, and after breaking this Resistance zone($6,894_$6,859) , we can anticipate the start of a main wave 5 .
I expect that once the S&P 500 index breaks through this Resistance zone($6,894_$6,859) , it will likely climb at least up to the next Resistance lines and the Potential Reversal Zone (PRZ) .
Note: The cryptocurrency market, and especially Bitcoin( BINANCE:BTCUSDT ), has been highly correlated with the S&P 500 index these weeks.
Please respect each other's ideas and express them politely if you agree or disagree.
S&P 500 Index Analyze (SPX500USD), 1-hour time frame.
Be sure to follow the updated ideas.
Do not forget to put a Stop loss for your positions (For every position you want to open).
Please follow your strategy and updates; this is just my Idea, and I will gladly see your ideas in this post.
Please do not forget the ✅' like '✅ button 🙏😊 & Share it with your friends; thanks, and Trade safe.

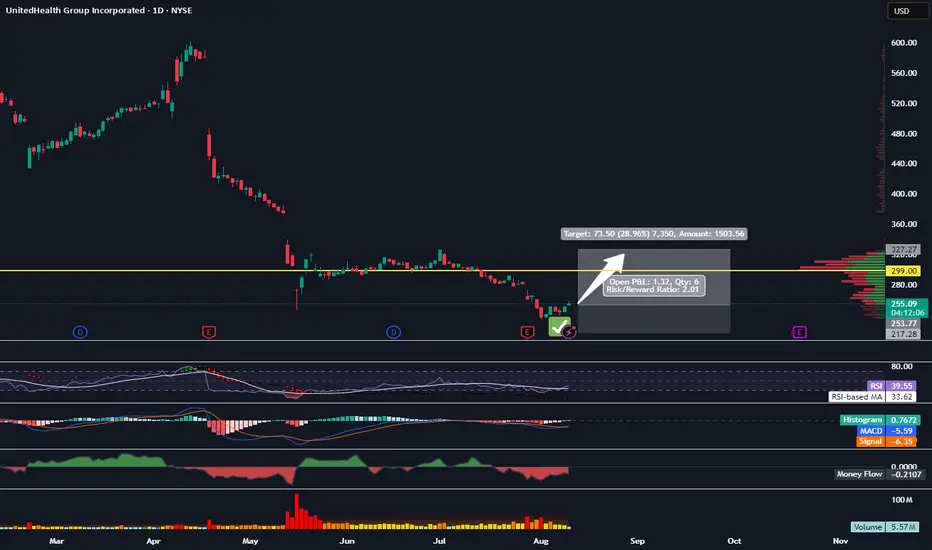
Entering UNH HereTrading Fam,
I'm not going to go into a long exposé about how great the technicals are here because, truthfully, they are not great. In fact, there is relatively little that supports any kind of entry here other than the fact that this stock is extremely oversold. Really, the only reason I even considered an entry here is that my indicator has given me a buy. If you have been following me for any length of time, you know that this thing is knocking it out of the park in stocks. But to keep it safe, I am entering a 1:2 long rrr, shooting for $327 with a $217 SL. Let's see if my little indicator can keep its amazing win streak going even without a lot of technicals to support it.
✌️Stew